


Abstract
PET with 18F-FDG (18F-FDG PET) is increasingly used in the definition of target volumes for radiotherapy, especially in patients with non–small cell lung cancer (NSCLC). In this context, the delineation of tumor contours is crucial and is currently done by different methods. This investigation compared the gross tumor volumes (GTVs) resulting from 4 methods used for this purpose in a set of clinical cases. Methods: Data on the primary tumors of 25 patients with NSCLC were analyzed. They had 18F-FDG PET during initial tumor staging. Thereafter, additional PET of the thorax in treatment position was done, followed by planning CT. CT and PET images were coregistered, and the data were then transferred to the treatment planning system (PS). Sets of 4 GTVs were generated for each case by 4 methods: visually (GTVvis), applying a threshold of 40% of the maximum standardized uptake value (SUVmax; GTV40), and using an isocontour of SUV = 2.5 around the tumor (GTV2.5). By phantom measurements we determined an algorithm, which rendered the best fit comparing PET with CT volumes using tumor and background intensities at the PS. Using this method as the fourth approach, GTVbg was defined. A subset of the tumors was clearly delimitable by CT. Here, a GTVCT was determined. Results: We found substantial differences between the 4 methods of up to 41% of the GTVvis. The differences correlated with SUVmax, tumor homogeneity, and lesion size. The volumes increased significantly from GTV40 (mean 53.6 mL) < GTVbg (94.7 mL) < GTVvis (157.7 mL) and GTV2.5 (164.6 mL). In inhomogeneous lesions, GTV40 led to visually inadequate tumor coverage in 3 of 8 patients, whereas GTVbg led to intermediate, more satisfactory volumes. In contrast to all other GTVs, GTV40 did not correlate with the GTVCT. Conclusion: The different techniques of tumor contour definition by 18F-FDG PET in radiotherapy planning lead to substantially different volumes, especially in patients with inhomogeneous tumors. Here, the GTV40 does not appear to be suitable for target volume delineation. More complex methods, such as system-specific contrast-oriented algorithms for contour definition, should be further evaluated with special respect to patient data.
In radiotherapy of patients with non–small cell lung cancer (NSCLC), still having a comparatively bad prognosis, the probability of local tumor control increases with higher applied radiation doses. Because of the risk of damaging normal tissue, these cannot be achieved in large treatment volumes.
Therefore, although still a matter of discussion (1,2), the concept of elective nodal irradiation is being abandoned in favor of the irradiation of the macroscopic tumor tissue alone by increasing doses of high-precision radiotherapy. For this concept, detailed information about the actual 3-dimensional tumor spread is essential.
The definition of target volumes by the treating physicians has been found to bear the largest source of error in the whole chain of radiotherapy (3). Among other factors, the use of PET with 18F-FDG (18F-FDG PET) was shown to reduce this interobserver variability (4). In recent years the possibly high impact of 18F-FDG PET on the size and form of target volumes in lung cancer was demonstrated (5–10).
In diagnostic nuclear medicine, extensive research on 18F-FDG PET was conducted, mostly dealing with diagnostic performance—for example, the determination of standardized uptake values (SUVs) (11–14). Neither the lesion size nor the localization of the tumor contour played an important role in these investigations.
However, these factors are directly linked to the size and shape of target volumes and, therefore, crucial for radiotherapy planning.
Various methods are currently used to determine the outline of 18F-FDG–positive tissue. The first one applied (5,7), and still widely used, is the visual interpretation of the PET scan and the definition of contours as judged by the experienced nuclear medicine physician.
Other methods attempt to find a threshold for image segmentation: In diagnostic studies, a maximum SUV (SUVmax) of 2.5 is often defined and still discussed as a threshold for the distinction between malignant and benign lesions. Although aimed at the characterization of a point of most intense 18F-FDG accumulation within a questionable lesion, this value was also suggested as a threshold for gross tumor volume (GTV) delineation (15).
From the physics side, after phantom studies (16,17), thresholding by percentage (e.g., 40% or 50%) of the maximum uptake was done (4,8,18–20). Recently, more complex algorithms—including, for example, the source-to-background ratio or local contrast—were proposed (21,22).
Today, all these philosophies are applied simultaneously by different groups active in this field. To our knowledge, no comparison of the resulting volumes and quantification of possible differences were performed in patient data. This was the aim of the present investigation.
MATERIALS AND METHODS
Data of 25 patients with histologically proven primary NSCLC were used, who had a routine 18F-FDG PET examination for staging purposes. All patients had an option for radiotherapy at the time of the PET examination, although not all patients finally received this treatment.
Tumor stages were T1 or T2 in 17 patients and T3 or T4 in 8 patients. Eighteen patients had positive mediastinal nodes; 6 patients had distant metastases.
Our investigation focuses on the GTVs concerning the primary tumors, regardless of the N and M stages.
After obtaining informed consent, patients underwent routine whole-body 18F-FDG PET (250 MBq 18F-FDG; fasting blood glucose level, <150 mg/dL; CTI/Siemens ECAT ART PET scanner; 6 or 7 bed positions; attenuation correction by transmission scanning with 137Cs single-photon transmission; axial spacing 3.4 mm; iterative reconstruction into 128 × 128 pixels of 5.1 mm), with the acquisition being started 90 min after injection. Afterward (160 min after injection), an additional PET scan of the chest was acquired in radiotherapy treatment position (2 or 3 bed positions). On the same day, spiral planning CT of the chest (El-Scint TWIN FLASH CT; 3-mm slice thickness, 512 × 512 pixels of 0.98 mm, flat breathing) was performed in identical position verified by laser localizer, skin marks, and photographic documentation. The coregistration of CT and PET data (23) was performed by a Hermes (Nuclear Diagnostics) workstation; the data were then transferred to the radiotherapy planning system (Philips Pinnacle).
As a first step, in all patients, an experienced double board-certified nuclear medicine and radiotherapy physician used the region-of-interest (ROI) standard evaluation tool provided by the manufacturer of the PET system and a global logarithmic scaling to generate a “visual” PET GTV, comprising the tissue considered visually as part of the malignant primary tumor (GTVvis). Clinical information and CT reports of the patients were used in this process but CT images or image fusion was not used.
Then, for all tumors, 2 further GTVs were defined at the PET console. ROIs were positioned around the tumors slice by slice in the volume file, using first an isocontour of SUV = 2.5 (GTV2.5) and, second, an isocontour of 40% of the SUVmax of the whole lesion (GTV40) similarly for all slices.
In our opinion, the radiotherapy planning system (PS) is the most likely place for PET target volumes to be defined in clinical practice. The data transfer described converts the voxel values of PET activity (kBq/mL) to visual intensities (I), so that the SUV is lost. Furthermore, the matrix is changed from 128 × 128 to 512 × 512. Therefore, the delineation of the fourth set of GTVs was done on the PS using an in-house algorithm.
As reported earlier in part (24), in-house phantom measurements were performed using spheres with varying diameters and source-to-background activities.
The physical and mathematic features and results of these phantom experiments will be published separately in more detail. However, the clinical application of the resulting algorithm was included into our comparison.
In short, by means of the PS, thresholds for volume contouring are determined by a function of tumor and background intensities: Ithreshold = (0.15 × Imean) + Ibackground.
In patient datasets, Imean was calculated as the mean intensity of all pixels surrounded by the 70% Imax isocontour within the tumor. The rationale for the choice of Imean rather than Imax was to minimize the influence of statistically not representative maximum values on the resulting threshold.
Ibackground was defined as follows: Anatomic entities adjacent to the tumor (e.g., lung, mediastinum, liver) were identified. By visual comparison of these, the structure with the highest 18F-FDG uptake was defined as “relevant backround.” A ROI was placed into the relevant background structure at a safe distance from the target, and the mean SUV of this ROI was used as Ibackground for threshold calculation. This procedure was established on the assumption that, for tumors adjacent to various anatomic structures, those with more intense 18F-FDG accumulation after injection (e.g., mediastinum, liver) were more relevant for threshold calculation than faintly accumulating tissue (e.g., lung). We further assumed, and confirmed this assumption by exploratory measurements, that normal organs show a rather homogeneous 18F-FDG accumulation after injection within themselves.
Applying the resulting thresholds in the 22 patients eligible for evaluation at the PS (in 3 patients, data transfer failed because of technical reasons), tumor contours were outlined automatically and then manually corrected to exclude nontumor tissue—for example, myocardium. This procedure led to the fourth set of GTVs (GTVbg).
As a common feature in lung cancer, in some cases 18F-FDG–positive lymph nodes directly adjacent to the primary tumors could not be separated from the tumor itself. Here, the whole structure accumulating 18F-FDG was included into all GTVs as if it was part of the primary tumor.
To correct for a possible influence of the tumor size on the differences detected, virtual spheric radii were calculated for all GTVs (Rvis, R40, R2.5, Rbg, RCT). In addition, this yielded a value comparable to clinical practice, where the differences in radius would reflect the distance between the contours drawn in the same image.
In CT, as common in lung cancer, in most tumors the circumferences could only be partially contoured unequivocally. However, in 5 patients, a peripheral tumor was fully delimitable. Here a GTV derived from CT was generated using the soft-tissue window with respect to lung window (GTVCT). To correct for breathing excursions during the PET scan, and therefore to provide a measure for the size of PET GTVs to be expected, “expanded CT volumes” were calculated (GTVCTexp). Following the lower levels of tumor movements reported, and of correction margins recommended in the literature for radiotherapy planning (25–28), the expansion was 0.15 cm lateral, 0.2 cm anteroposterior, and 0.3 cm craniocaudal. Radius values derived from the unexpanded CT volumes were “expanded” by 0.25 cm.
By means of visual characterization of the 18F-FDG accumulation, the tumors were classified as “rather homogeneous” or “grossly inhomogeneous.”
The results were evaluated by standard methods of descriptive statistics, including combined t test and the Pearson correlation.
RESULTS
The SUVmax values of the primary tumors were in mean 17.1 (range, 1.7–38.7). As expected (29), this value was significantly higher compared with the whole-body examinations 90 min after injection (mean SUVmax, 13.4; P < 0.0001). However, 3 patients showed a decrease of SUVmax. One of these had the overall minimum SUVmax of 1.7 after an initial value of 3.6. Because the patient had a malignant lesion, later confirmed histologically, we decided to include this case as far as possible into the present investigation. However, no GTV2.5 could be determined.
Table 1 shows the results with respect to volumes and spheric radii of the GTVs created as well as the results of the statistical comparison. Mean GTVvis was 157.7 mL, representing a Rvis of 3.03 cm. As can be seen, there are clear differences between the GTVs created. While the differences between GTVvis and GTV2.5 appear rather small, all other differences were equal to or larger than the spatial resolution of the PET system. Despite the small group of patients examined, this was statistically highly significant.
Results of GTV Delineation Following Different Philosophies for Contour Definition: All Patients
The maximum difference in radius detected in an individual patient was 2.22 cm (Rvis − R40), 41% of Rvis of this tumor.
The differences between GTVvis and GTV2.5 compared with GTV40 or GTVbg correlated significantly with the SUVmax, the size of the lesion, and the presence of gross inhomogeneity (all P values < 0.01).
On further examination of these findings, 2 subgroups were analyzed exploratively:
In 8 patients, the tumors showed a grossly inhomogeneous 18F-FDG accumulation. These tumors (Table 2) were significantly larger than the others (mean Rvis = 4.16 vs. 3.03 cm; P < 0.0001). However, they did not show a significantly different SUVmax (mean, 17.1 vs. 19.7; not significant [NS]).
Results of GTV Delineation Following Different Philosophies for Contour Definition: Patients with Grossly Inhomogeneous 18F-FDG Accumulation
In this group, the differences were as before but were more pronounced. Furthermore, by visual impression, in at least 3 of the 8 patients, there was grossly inadequate coverage of the malignant tissue by the GTV40 (Figs. 1 and 2), whereas GTVbg proposed a better concordance of the 18F-FDG accumulation with the lesions depicted by CT.

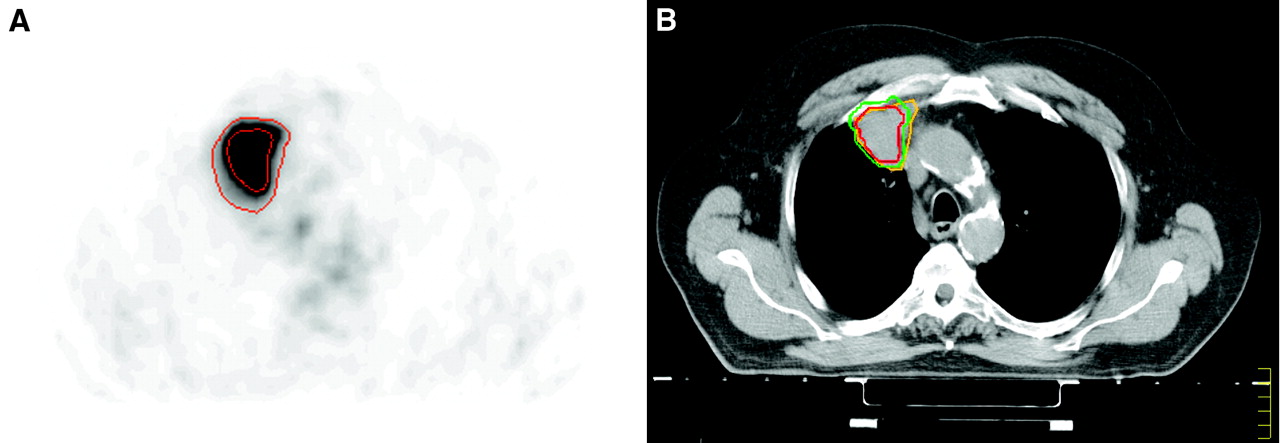
Two slices of image fusion in patient 1 with inadequate tumor coverage by GTV40 (red) in 18F-FDG–inhomogeneous tumor (green = outline of GTVbg).
The 5 tumors, which were fully delimitable by CT (Table 3), were all located peripherally and, on average, smaller than those of the whole group examined (mean GTVvis = 66.5 mL). The differences between the GTVs here were less pronounced than seen before (Fig. 3).

Planning CT scan (A) and corresponding fusion image (B) of patient 8 show inadequacy of GTV40: green = GTVbg, red = GTVCT, yellow = GTV40.
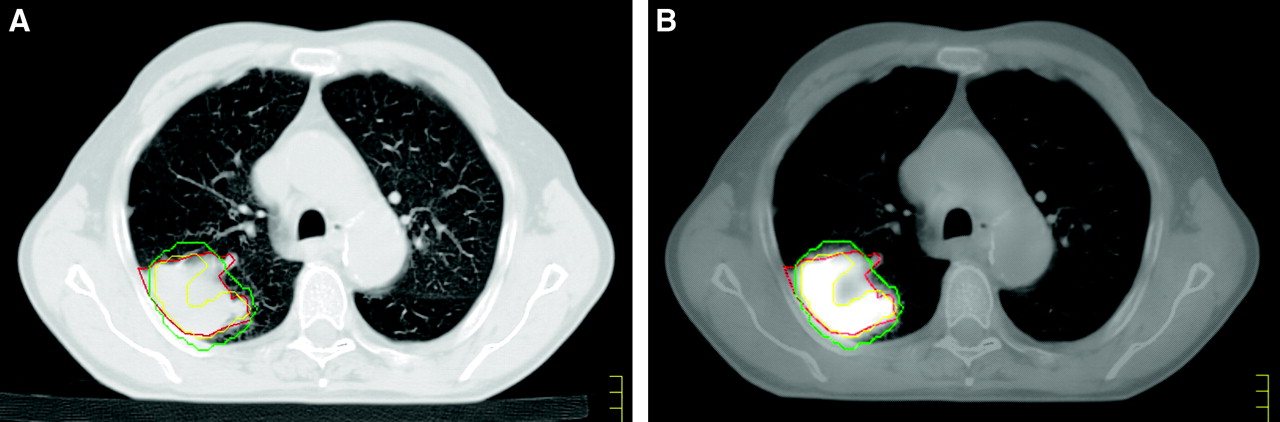
Example of difference between target volumes in patient 4 with a tumor clearly delimitable by CT. (A) 18F-FDG PET. SUVmax = 30. Isocontours: narrow = GTV40, wide = GTV2.5. (B) Corresponding planning CT. Isocontours: red = GTV40, green = GTVbg, yellow = GTVCT.
Results of GTV Delineation Following Different Philosophies for Contour Definition: Patients with Clearly CT-Defined Tumors
Despite the small number of cases, the GTVvis, GTV2.5, and GTVbg values correlated clearly with GTVCT (correlation coefficient = 0.96–0.98; all P values ≤ 0.02), whereas the GTV40 did not (correlation coefficient, 0.70; P = NS). However, because of the small number of cases, this result must be regarded with caution, and further statistical evaluation was not done.
DISCUSSION
The present investigation attempts to contribute to the discussion about the standardization of target volumes in radiotherapy planning as derived from 18F-FDG PET. Though there are numerous investigations on phantom measurements addressing this problem, only a small number of studies including patient data have been published (16,17,30). To our knowledge, there is no clinical investigation on the potential differences between the various approaches.
Our study addressed this question by investigating the primary tumors of patients with NSCLC. Because of substantial anatomic and pathohistologic differences between primary tumors and lymph nodes, we believed that these should be dealt with separately.
Primarily, the aim of our investigation was to detect and quantify any differences between the delineation philosophies for 18F-FDG PET. During this comparison, we perceived the need to determine the “true” volumes of the lesions investigated. However, for patient data—in contrast to phantom measurements—there is no golden standard for the evaluation of volumes as measured by different imaging modalities except pathologic specimens, which were not available because of the nature of our patient population. Furthermore, in lung tumors, results of in situ volumetry will always be dependent on how the individual method deals with tumor motion. Despite blurring, volumes of chest tumors as measured by 18F-FDG PET (representing the accumulation averaged over several breathing cycles) would be expected to be equal or larger than the volumes as measured by CT, representing rather a “snapshot” of the density at one point of time during the breathing cycle (28). We therefore calculated “expanded” CT volumes according to the smallest margins recommended (25–28) for motion correction in radiotherapy planning for tumors clearly delimitable by CT. To us, these expanded volumes appeared to be closest to the true PET volumes to be expected. For the other tumors, which—as frequently observed in lung cancer—were not fully delimitable, and, therefore, for which no CT volume could be determined, we compared the PET GTVs visually to CT findings in fusion images. As illustrated in Figures 1 and 2, even in tumors that are not fully delimitable, it can at least be determined whether or not a mass is roughly surrounded by an isocontour.
In the overall comparison of the 4 philosophies of contour definition, we found significant differences between the resulting target volumes. These differences correlated with SUVmax, lesion size, and tumor inhomogeneity.
Visual definition and the application of a constant isocontour of SUV = 2.5 rendered surprisingly similar results. No differences exceeding the spatial resolution of the PET scan were observed between these 2 methods. However, visual judgment is very much dependent on the individual investigator and display window setting—for example, the type of gray scale applied. Furthermore, the GTVs generated by these approaches appeared rather large in comparison with expanded CT data. Exploratory results on mediastinal lymph nodes have further shown us that, for faintly accumulating structures in a background with relatively high activity, the SUV = 2.5 isocontours are not suitable for target volume delineation.
The most striking findings of this study relate to the 40% SUVmax approach, which, in general, yielded the smallest set of GTVs. The differences in comparison with the visual or the SUV2.5 approach were found to be larger than the resolution of the PET system.
In patients with inhomogeneous tumors, we observed a 3.6-fold difference in mean volume (GTV25 − GTV40), corresponding to differences in radius up to 2.2 cm. In 3 of 8 patients, the visual impression of inadequate coverage of the malignant tissue by the 40% isocontour was obvious (Figs. 1 and 2).
In the tumors fully delimitable by CT, there was no correlation of GTV40 with GTVCT, though this was the case for all other concepts.
The mean GTV40 in the present investigation was in the range of GTVCT without expansion in well-delineated tumors, which were relatively small and situated peripherally. This finding is in line with the data by Erdi et al. (16), who used the 40% approach for GTV delineation. This group has meanwhile developed systems of breath control to be used for planning and irradiation (9,31), thus avoiding the problem of incongruent imaging of tumor motion. However, if breath control is not applied, “tailoring down” CT-defined GTVs to PET contours generated by an automatic 40% SUV approach in lung cancer does not safely lead to a complete coverage of the malignant tissue.
The philosophy of defining target volume contours by an algorithm with respect to local background was proposed by several authors (17,21). One group even showed superiority of the 18F-FDG PET volumes defined by a source-to-background algorithm over CT- and MRI-measured volumes when compared with histologic specimens in larynx tumors (30).
The algorithm developed in our institution, to be used in the PS to define the threshold for the PET-positive volume as a function of the intensities of tumor and background, led to volumes (GTVbg) of an intermediate size between the GTV2.5 and the GTV40. In visual comparison with CT data, these volumes seemed to fit pathoanatomic structures better than the GTV40.
The GTVbg algorithm is closely related to the departmental setup. The exploratory use of the formula for volume definition away from the PS—for example, at the PET system itself—led to significantly different volumes. It must be pointed out that technical and software factors of all steps involved do have an important influence on the structure of image data and on resulting volumes. Therefore, any contouring algorithm must be regarded as system specific for use at the point of the radiotherapy chain for which it was developed. As with all other parts of the radiotherapy chain, PET contouring algorithms must be quality controlled for each system, including phantom measurements, before being used in any application.
The GTVbg method, however, appears to be more stable against the inhomogeneity of tumor uptake, and the broad variation of SUVmax values between patients, than, for example, the 40% approach.
An important issue to be discussed before the use of complex algorithms in radiotherapy planning for lung cancer is the choice of the “relevant” background. Until now, most publications in this context have been phantom studies (21,22) so that the current literature does not provide solutions for this problem. To our knowledge, the only investigation published to date on the use of a source-to-background algorithm in patients (30) focused on larynx tumors. In the head-and-neck region, the differences in normal tissue accumulation are not as high as in the thorax. In the chest, mean 18F-FDG uptake in normal tissues may vary between a SUV of <1 (lung) up to a SUV of >3 (liver). Depending on the algorithm used, these differences may lead to significantly different thresholds, especially in contouring tumors with only faint accumulation of 18F-FDG. For the present investigation we used a differentiated approach, choosing and measuring the relevant background as defined for each patient separately, with the encouraging results reported.
A possible limitation of the present investigation might be found in the late acquisition of the planning PET scans. Other groups have reported on PET scans acquired much earlier after injection (e.g., 45–60 min). It is known that the 18F-FDG uptake in malignant tumors rises over time, though decreasing in other tissues (29,32,33). This may possibly lead to an accentuation of our findings. However, exploratory delineation of GTVs both in early and in late PET scans of several patients did not show relevant changes of the results.
Overall, there is a great need for imaging methods that precisely depict tumor tissue to aid the delineation of target volumes in high-dose 3-dimensional irradiation. Because of the high image contrast, and the comparably high diagnostic accuracy, 18F-FDG PET has a large potential in this context, which urgently needs to be integrated into clinical trials.
A first prospective study has already shown that the probability of local tumor recurrence outside the planning target volume is low after irradiating only the 18F-FDG–positive tissue (34). It is clear that patients with large—and therefore inhomogeneous—tumors might benefit from dose escalation (35). Because the differences between the philosophies for target volume definition by 18F-FDG PET are most pronounced in this group of patients, the development of a standard for the delineation of 18F-FDG–positive tissue is needed.
CONCLUSION
The different techniques used for tumor contour definition by 18F-FDG PET in radiotherapy planning resulted in substantially different volumes, especially in patients with inhomogeneous tumors.
Because of possibly incomplete tumor coverage, to us, the 40% SUVmax concept does not appear generally suitable for target volume delineation unless systems are used for breath control.
More complex algorithms—for example, contrast-oriented methods for contour definition—should further be evaluated with special respect to patient data.
It must be emphasized that such algorithms are system specific and that the whole chain from the PET system to the treatment PS must strictly be quality controlled when used in clinical practice.
Acknowledgments
The authors thank the staff of our departments as well as the colleagues from the Department of Pneumology for their close collaboration. Furthermore, we thank Andrew Page for his help in the wording of the manuscript.
Footnotes
Received Jan. 21, 2005; revision accepted Apr. 13, 2005.
For correspondence contact: Ursula Nestle, MD, Klinik für Nuklearmedizin, Universitätsklinikum des Saarlandes, D-66421 Homburg/Saar, Germany.
E-mail: raunes{at}uniklinik-saarland.de
REFERENCES
In this issue


Jump to section
Related Articles
Cited By...
- Robustness of 18F-FDG PET Radiomic Features in Lung Cancer: Impact of Advanced Reconstruction Algorithm
- Additional value of volumetric and texture analysis on FDG PET assessment in paediatric Hodgkin lymphoma: an Italian multicentric study protocol
- FAPI-74 PET/CT Using Either 18F-AlF or Cold-Kit 68Ga Labeling: Biodistribution, Radiation Dosimetry, and Tumor Delineation in Lung Cancer Patients
- 18F-FDG PET/CT for Target Volume Contouring in Lung Cancer Radiotherapy (perspective on "Comparison of Different Methods for Delineation of 18F-FDG PET-Positive Tissue for Target Volume Definition in Radiotherapy of Patients with Non-Small Cell Lung Cancer" J Nucl Med. 2005;46:1342-1348)
- Time to Prepare for Risk Adaptation in Lymphoma by Standardizing Measurement of Metabolic Tumor Burden
- Prognostic Value of Standardized Uptake Ratio in Patients with Trimodality Treatment of Locally Advanced Esophageal Carcinoma
- Metabolic heterogeneity on baseline 18FDG-PET/CT scan is a predictor of outcome in primary mediastinal B-cell lymphoma
- 18F-FDG PET and CT Scans Detect New Imaging Patterns of Response and Progression in Patients with Hodgkin Lymphoma Treated by Anti-Programmed Death 1 Immune Checkpoint Inhibitor
- Understanding Changes in Tumor Texture Indices in PET: A Comparison Between Visual Assessment and Index Values in Simulated and Patient Data
- Baseline Total Metabolic Tumor Volume Measured with Fixed or Different Adaptive Thresholding Methods Equally Predicts Outcome in Peripheral T Cell Lymphoma
- 18F-FDG PET/CT of Non-Small Cell Lung Carcinoma Under Neoadjuvant Chemotherapy: Background-Based Adaptive-Volume Metrics Outperform TLG and MTV in Predicting Histopathologic Response
- Estimation of Tumor Volumes by 11C-MeAIB and 18F-FDG PET in an Orthotopic Glioblastoma Rat Model
- Prognostic Value of Pretherapeutic Tumor-to-Blood Standardized Uptake Ratio in Patients with Esophageal Carcinoma
- Tumor Texture Analysis in 18F-FDG PET: Relationships Between Texture Parameters, Histogram Indices, Standardized Uptake Values, Metabolic Volumes, and Total Lesion Glycolysis
- Interobserver Agreement of Qualitative Analysis and Tumor Delineation of 18F-Fluoromisonidazole and 3'-Deoxy-3'-18F-Fluorothymidine PET Images in Lung Cancer
- Subcentimeter Tumor Lesion Delineation for High-Resolution 18F-FDG PET Images: Optimizing Correction for Partial-Volume Effects
- Impact of Tumor Size and Tracer Uptake Heterogeneity in 18F-FDG PET and CT Non-Small Cell Lung Cancer Tumor Delineation
- Conventional 3D staging PET/CT in CT simulation for lung cancer: impact of rigid and deformable target volume alignments for radiotherapy treatment planning
- The physical basis and future of radiation therapy
- Autocontouring Versus Manual Contouring
- Reply: Autocontouring Versus Manual Contouring
- Autocontouring and Manual Contouring: Which Is the Better Method for Target Delineation Using 18F-FDG PET/CT in Non-Small Cell Lung Cancer?
- Reproducibility of 18F-FDG and 3'-Deoxy-3'-18F-Fluorothymidine PET Tumor Volume Measurements
- Comparative Assessment of Methods for Estimating Tumor Volume and Standardized Uptake Value in 18F-FDG PET
- SUV: From Silly Useless Value to Smart Uptake Value
- Innovations in Radiotherapy Planning of Head and Neck Cancers: Role of PET
- 18F-FDG PET/CT for Image-Guided and Intensity-Modulated Radiotherapy
- Metabolic Tumor Volume of [18F]-Fluorodeoxyglucose Positron Emission Tomography/Computed Tomography Predicts Short-Term Outcome to Radiotherapy With or Without Chemotherapy in Pharyngeal Cancer
- 18F-FDG PET/CT as an Indicator of Progression-Free and Overall Survival in Osteosarcoma
- Tumor Volume Assessment by 18F-FDG PET/CT in Patients with Oral Cavity Cancer with Dental Artifacts on CT or MR Images
- Deep-Inspiration Breath-Hold PET/CT of Lung Cancer: Maximum Standardized Uptake Value Analysis of 108 Patients
- Dynamic Threshold for Radiation Target Volume by PET/CT
- PET-Based Treatment Planning in Radiotherapy: A New Standard?
- 18F-FDG PET Definition of Gross Tumor Volume for Radiotherapy of Non-Small Cell Lung Cancer: Is a Single Standardized Uptake Value Threshold Approach Appropriate?
- Experience of PET for target localisation in radiation oncology