


Abstract
PET with 18F-FDG has been used in radiation treatment planning for non–small cell lung cancer (NSCLC). Thresholds of 15%–50% the maximum standardized uptake value (SUVmax) have been used for gross tumor volume (GTV) delineation by PET (PETGTV), with 40% being the most commonly used value. Recent studies indicated that 15%–20% may be more appropriate. The purposes of this study were to determine which threshold generates the best volumetric match to GTV delineation by CT (CTGTV) for peripheral NSCLC and to determine whether that threshold can be generalized to tumors of various sizes. Methods: Data for patients who had peripheral NSCLC with well-defined borders on CT and SUVmax of greater than 2.5 were reviewed. PET/CT datasets were reviewed, and a volume of interest was determined to represent the GTV. The CTGTV was delineated by using standard lung windows and reviewed by a radiation oncologist. The PETGTV was delineated automatically by use of various percentages of the SUVmax. The PETGTV-to-CTGTV ratios were compared at various thresholds, and a ratio of 1 was considered the best match, or the optimal threshold. Results: Twenty peripheral NSCLCs with volumes easily defined on CT were evaluated. The SUVmax (mean ± SD) was 12 ± 8, and the mean CTGTV was 198 cm3 (97.5% confidence interval, 5–1,008). The SUVmax were 16 ± 5, 13 ± 9, and 3.0 ± 0.4 for tumors measuring greater than 5 cm, 3–5 cm, and less than 3 cm, respectively. The optimal thresholds (mean ± SD) for the best match were 15% ± 6% for tumors measuring greater than 5 cm, 24% ± 9% for tumors measuring 3–5 cm, 42% ± 2% for tumors measuring less than 3 cm, and 24% ± 13% for all tumors. The PETGTV at the 40% and 20% thresholds underestimated the CTGTV for 16 of 20 and 14 of 20 lesions, respectively. The mean difference in the volumes (PETGTV minus CTGTV [PETGTV – CTGTV]) at the 20% threshold was 79 cm3 (97.5% confidence interval, −922 to 178). The PETGTV at the 20% threshold overestimated the CTGTV for all 4 tumors measuring less than 3 cm and underestimated the CTGTV for all 6 tumors measuring greater than 5 cm. The CTGTV was inversely correlated with the PETGTV – CTGTV at the 20% threshold (R2 = 0.90, P < 0.0001). The optimal threshold was inversely correlated with the CTGTV (R2 = 0.79, P < 0.0001). Conclusion: No single threshold delineating the PETGTV provides accurate volume definition, compared with that provided by the CTGTV, for the majority of NSCLCs. The strong correlation of the optimal threshold with the CTGTV warrants further investigation.
PET with 18F-FDG has been shown to improve the staging of non–small cell lung cancer (NSCLC), especially with respect to the detection of nodal and distant metastases (1–5). 18F-FDG PET after definitive chemoradiation therapy has also been shown to predict survival in patients with NSCLC (6–8). Many centers are beginning to adopt 18F-FDG PET for the purposes of radiation treatment planning. PET often identifies or clarifies tumor targets, resulting in a change in the planned target volume (7–16). Investigators have reported various methods for incorporating PET into the radiation treatment plan; these include visual side-by-side comparisons, image overlays, direct fusion of PET and CT images, and PET/CT simulation (see Table 2).
When a physician is placing contours on fused PET and CT images at the radiation treatment planning workstation, a problem is encountered in setting the threshold for the PET images. The physician doing the contouring can easily alter the apparent volume of the tumor on the PET images by simply adjusting the threshold setting. There is no validated standardized method for setting this threshold. The choice of this PET threshold is tantamount to determining tumor volume. Various methods have been used; these include using the absolute standardized uptake value (SUV) (i.e., gross tumor volume [GTV] = SUV of >2.5), using percentages of the maximum SUV (SUVmax) (i.e., GTV = volume encompassed by >40% the SUVmax), or ignoring the threshold setting and simply contouring the CT volume corresponding to the visually identified lesion. Published methods based on a threshold determined as a percentage of the SUVmax (percentage threshold) have used values ranging from 15% to 50% (9–11,13–15,17–21). Many factors affect SUV measurements and therefore tumor contours: the metabolic activity of a tumor, heterogeneity within a tumor, and tumor motion.
A few early investigations estimated that a threshold of 40% the SUVmax approximated tumor volume (10,22,23). On the basis of these data, we performed an initial prospective study comparing treatment plans defined with CT only and with fused PET and CT images and with the 40% SUVmax threshold (9). More recently, a 20% threshold was recommended (24). The purposes of this study were to evaluate the appropriateness of the percentage threshold approach by determining the optimal threshold for the best volumetric match between PET and CT for NSCLC and to determine whether the optimal threshold will adequately delineate GTV for tumors of various sizes.
MATERIALS AND METHODS
Institutional review board approval was obtained before review of PET/CT datasets for patients in this study. The study population consisted of 19 patients who underwent diagnostic PET/CT. All patients had peripheral stage I–stage IV disease with no evidence of distant metastatic disease detected by history, physical examination, routine laboratory testing, CT of the chest and upper abdomen (to include the liver and adrenal glands), and bone scintigraphy. One patient had bilateral disease with 2 small lesions without lymphadenopathy. Patients with metastatic disease revealed by PET/CT were excluded.
PET/CT
Each patient was scanned on the flat tabletop with a hybrid PET/CT scanner (Biograph LSO 2; Siemens Medical Solutions). The CT component of the PET/CT studies was performed without the administration of either oral or intravenous contrast agents. CT images (5-mm slices) typically were obtained during quiet breathing from the base of the skull through the proximal thighs at 130 kVp and 110 mA. Emission PET images were obtained over the same anatomic extent beginning 45–60 min after the administration of 555–740 MBq of 18F-FDG, with imaging times of 2–4 min per bed position, depending on patient weight. PET images were scatter corrected and reconstructed by use of ordered-subset expectation maximization with a postreconstruction gaussian filter at 5 mm full width at half maximum.
PET Interpretation
After PET/CT, the image sets were transferred to the PET/CT workstation. After a radiation oncologist reviewed the PET images with a nuclear radiologist, the PET-based GTV (PETGTV) was delineated for each tumor with isodensity contours. For estimation of the SUV, determination of the percentage threshold isodensity contours, and volumetric analysis, e-soft (version 2.5; Siemens) was used. An ellipsoid volume of interest was determined for each lesion at its maximal diameter in the axial, coronal, and sagittal planes on the fused PET and CT images. This volume excluded any lymph nodes. The percentage threshold was adjusted from 10% to 50%, and the PETGTV was determined for each threshold.
Delineation of Contours for Dataset from CT Alone
The CT-based GTV (CTGTV) was delineated by use of the isodensity tool with lung window settings (1,600 and −300). The CTGTV was then reviewed and altered by a single radiation oncologist without knowledge of the PET results in an effort to reduce bias. Maximum primary tumor diameter and total tumor volume on CT were measured and calculated for each patient. No positive lymph nodes were contoured.
Best Volumetric Match, or Optimal Threshold
The PET and CT data were used to determine the percentage threshold required to obtain a 1:1 volumetric correlation between CT- and PET-delineated tumors. A first-order, linear approximation was made after determination of the 2 PET thresholds between which the PETGTV and the CTGTV were equal. All data are reported as mean ± SD or confidence intervals.
Difference in Volumes (PETGTV Minus CTGTV [PETGTV – CTGTV])
The mean difference in the volumes (PETGTV – CTGTV) was calculated for tumors at the 40% and 20% thresholds. Linear and logarithmic regression analyses were used to determine the relationship between the CTGTV and the optimal threshold as well as between the CTGTV and the PETGTV – CTGTV at the optimal threshold.
RESULTS
Data for 19 patients with 20 primary lesions measurable on PET and CT were evaluated and reported. One patient had 2 small (<3-cm) solitary lesions bilaterally.
The mean ± SD maximum tumor diameter in any direction on CT was 6.0 ± 3.4 cm, and the range was 1.2–11.7 cm. A total of 6 tumors measured greater than 5 cm, 10 measured 3–5 cm, and 4 measured less than 3 cm. The mean CTGTV was 198 cm3, and the range was 5–1,008 cm3. The mean ± SD PETGTV at the 40% threshold was 44 ± 30 cm3, and the range was 6–199 cm3.
The mean ± SD SUVmax for all tumors was 12 ± 8. The mean ± SD SUVmax were 16 ± 5 for tumors measuring greater than 5 cm, 13 ± 9 for tumors measuring 3–5 cm, and 3.0 ± 0.4 for tumors measuring less than 3 cm. The mean ± SD CTGTVs were 13 ± 7, 90 ± 69, and 502 ± 348 cm3 for tumors measuring less than 3 cm, 3–5 cm, and greater than 5 cm, respectively.
Comparison of PETGTV and CTGTV
For all patients, the optimal threshold for the best match was 24% ± 13%. The optimal threshold was associated with tumor size. It was 15% ± 6% for tumors measuring greater than 5 cm, 24% ± 9% for tumors measuring 3–5 cm, and 42% ± 2% for tumors measuring less than 3 cm (Table 1). The PETGTV underestimated the CTGTV for 16 of 20 lesions when the 40% threshold was used and for 11 of 20 lesions when the 20% threshold was used.
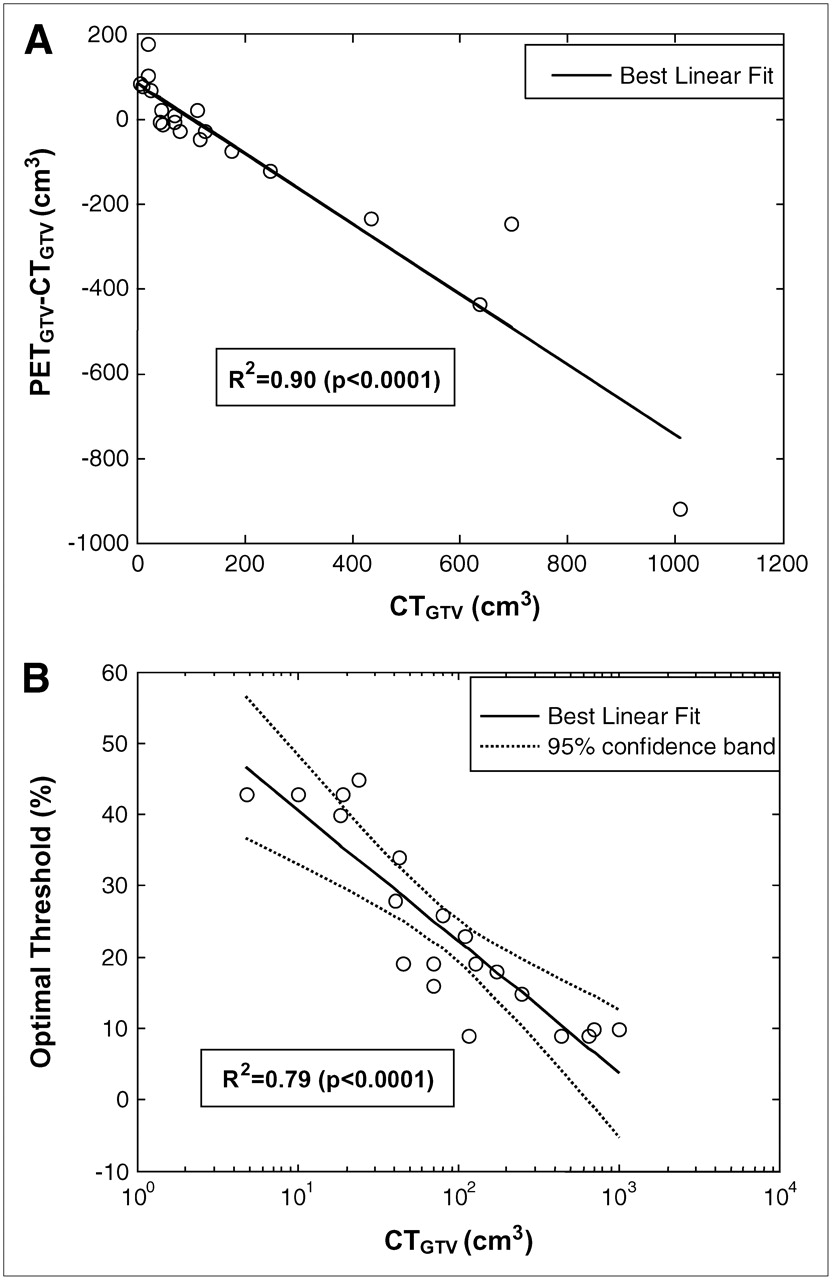
The mean ± SD PETGTV – CTGTV for all tumors at the 40% and 20% thresholds were 465 ± 307 and 79 ± 243 cm3, respectively. The PETGTV at the 40% threshold minimally overestimated the CTGTV for all 4 tumors measuring less than 3 cm by 2.7 ± 1.4 cm3 and underestimated the CTGTV for all 16 tumors measuring greater than 3 cm by 261 ± 301 cm3. The PETGTV at the 20% threshold overestimated the CTGTV for all 4 tumors measuring less than 3 cm by 91 ± 13 cm3 and underestimated the CTGTV for all 6 tumors measuring greater than 5 cm by 363 ± 312 cm3. The values for 5 of 10 tumors measuring 3–5 cm were overestimated, with a mean ± SD PETGTV – CTGTV of 23 ± 63 cm3. As determined with a logarithmic regression algorithm, the optimal threshold was inversely correlated with the CTGTV [R2 = 0.79, P < 0.0001; the optimal threshold was 59 × log(CTGTV) − 18] (Fig. 1B). The CTGTV was inversely correlated with the PETGTV – CTGTV at the 20% threshold (R2 = 0.90, P < 0.0001) (Fig. 1A).

(A) CTGTV vs. PETGTV-CTGTV at threshold of 20%. (B) CTGTV vs. optimal threshold with best-fit logarithmic regression curve.
DISCUSSION
The data reiterate the earlier finding that the 40% threshold is inadequate for delineating all NSCLC (10,22,23). Although we determined a 24% ± 13% threshold for all tumors, corresponding to a more recent finding (24), this threshold also failed to adequately delineate all tumors. In fact, for tumors measuring less than 3 cm, the PETGTV at the 20% threshold overestimated the mean CTGTV by more than 8 times, whereas the mean volume for tumors measuring greater than 5 cm was underestimated by more than two thirds. These data illustrate the inability of the percentage threshold method to provide a single threshold that will adequately delineate volumes for all tumors.
Table 2 shows the use of the percentage threshold method by several investigators who used PET and CT for radiation treatment planning. In several trials, visual identification of tumors on PET and CT images by nuclear and radiation oncologists was used to delineate tumor volume. In other trials, a 40%–50% threshold was used to delineate NSCLC volume (9–15,17,19–21).
Methods of Tumor Delineation by PET and CT in Several Studies
Erdi et al. initially proposed a 40%–50% threshold on the basis of measurements of stationary spheres containing 18F-FDG (22). In a subsequent phantom study, when motion was introduced, the use of a 40% threshold for maximum uptake yielded a measured volume far smaller than the actual volume of the phantom sphere as it moved through simulated lung motion (25). Black et al. reported the results of a phantom experiment designed to evaluate the role of mean target SUVs in conditions of various target-to-background 18F-FDG activities (26). They concluded that the PETGTV can be defined by the following equation: threshold SUV = 0.307 × (mean target SUV + 0.588). However, the phantoms used in that experiment were stationary. The effect of tumor motion on the use of this equation is not known.
Although several prospective studies noted an increase in tumor volume when PET and CT images were used for treatment planning, the larger volumes were primarily dependent on upstaging based on nodal involvement. For patients without new nodal or distant metastases, several studies reported a decrease in treatment volume in the setting of atelectasis when a 40% SUVmax threshold was used (10,17,21). Nestle et al. compared various modalities for determining the PETGTV, including visual GTV, 40% SUVmax, an absolute SUV of 2.5, and tumor-to-background ratio (18). They found substantial differences of up to 41% among these 4 different methods. Specifically, 3 of 8 patients had inadequate tumor coverage with the 40% threshold method. They concluded that the 40% threshold method was not suitable for target volume delineation.
For several reasons, a single-threshold model for NSCLC is less than ideal. First, it relies on the uniformity of SUVs within the tumor. A single threshold may fail to adequately model the lack of uniformity of 18F-FDG uptake because of factors such as hypoxia and necrosis, which are more likely to occur in large tumors. This conclusion was established by the inverse correlation of the CTGTV with the optimal threshold, showing that a much lower threshold is required to adequately encompass large areas of heterogeneity within large tumors.
In addition, lung motion and time spent in different portions of the breathing cycle also contribute to SUV fluctuations. A recent analysis of gated, 4-dimensional (4D) PET showed a significant influence of the breathing cycle on the measured SUVmax, with variations in SUV measurements of up to 24% (27,28).
The generalization of any method of tumor delineation by PET presents several difficulties. Inter- and intrainstitutional differences in the reconstruction of images and reconstruction filters, the dose of 18F-FDG administered, lean body mass, blood glucose levels, and time from the injection of 18F-FDG until the patient is scanned may contribute to alterations in percentage threshold isodensity curves. The method of reconstruction of PET images alters the SUVmax-to-SUVmean ratio and will likely change percentage threshold contours (29). The choice of reconstruction filters also alters the SUVmax-to-SUVmean ratio (30,31). Institutional differences are to be expected if these criteria are not standardized and adhered to diligently. Although the percentage threshold method is designed to standardize against these differences, problems association with institutional variations cannot be ignored.
There are weaknesses in an effort to create a 1:1 volumetric match between PET- and CT-delineated tumors. Because of the motion of the tumor during PET, it is expected that the PET tumor volume will be larger than the CT tumor volume, as PET tracks tumors through many breathing cycles. Contouring of the larger PET volume may be a surrogate for incorporating tumor motion into the radiation target (Fig. 2). However, the use of PET as a surrogate for tumor motion has not been validated.

Fused PET and CT coronal images of patient with stage I NSCLC. CT image of tumor (white) can be seen within larger PET image of tumor. Contours represent gross tumor volume (inner contour), clinical target volume (middle contour), and planning target volume (outer contour).
The extent of tumor motion may be better quantified by comparing PET with 4D CT and by using CT images as a guide for tumor contouring and PET. Future work with 4D multislice PET/CT may help to individualize the proper threshold setting for each patient, although other methods of tumor delineation by PET should be evaluated. We are currently reviewing our logarithmic model and an in-house automated segmentation algorithm to attempt to better delineate tumor volume (32).
CONCLUSION
The use of a single SUVmax threshold to delineate the GTV by PET results in poor delineation of the GTV, as manifested by a significant inverse correlation between the CTGTV and the optimal threshold for the majority of peripheral primary NSCLCs. A 40% threshold may provide a close estimation of the CTGTV for peripheral tumors smaller than 3 cm. The solution to setting the PET threshold is likely to be individualized on the basis of tumor size, location, nonuniform distribution of 18F-FDG activity of the tumor, and status of breathing control.
Footnotes
-
COPYRIGHT © 2006 by the Society of Nuclear Medicine, Inc.
References
- Received for publication May 31, 2006.
- Accepted for publication August 17, 2006.


Jump to section
Related Articles
Cited By...
- 18F-DCFPyL PET/CT in Patients with Subclinical Recurrence of Prostate Cancer: Effect of Lesion Size, Smoothing Filter, and Partial-Volume Correction on PROMISE Criteria
- Is FDG-PET/CT Useful for Diagnosing Pulmonary Metastasis in Patients with Soft Tissue Sarcoma?
- Estimation of Tumor Volumes by 11C-MeAIB and 18F-FDG PET in an Orthotopic Glioblastoma Rat Model
- 18F-FDG PET/CT to Predict Response to Neoadjuvant Chemotherapy and Prognosis in Inflammatory Breast Cancer
- Initial Metabolic Tumor Volume Measured by 18F-FDG PET/CT Can Predict the Outcome of Osteosarcoma of the Extremities
- Impact of Tumor Size and Tracer Uptake Heterogeneity in 18F-FDG PET and CT Non-Small Cell Lung Cancer Tumor Delineation
- Reproducibility of 18F-FDG and 3'-Deoxy-3'-18F-Fluorothymidine PET Tumor Volume Measurements
- Metabolic Tumor Volume of [18F]-Fluorodeoxyglucose Positron Emission Tomography/Computed Tomography Predicts Short-Term Outcome to Radiotherapy With or Without Chemotherapy in Pharyngeal Cancer
- Deep-Inspiration Breath-Hold PET/CT of Lung Cancer: Maximum Standardized Uptake Value Analysis of 108 Patients
- Comparison of Tumor Volumes Derived from Glucose Metabolic Rate Maps and SUV Maps in Dynamic 18F-FDG PET
- Reply: 18F-FDG PET in Planning Radiation Treatment of Non Small Cell Lung Cancer: Where Exactly Is the Tumor?
- 18F-FDG PET in Planning Radiation Treatment of Non Small Cell Lung Cancer: Where Exactly Is the Tumor?
- Reply: Dynamic Threshold for Radiation Target Volume by PET/CT
- Dynamic Threshold for Radiation Target Volume by PET/CT