


Abstract
The objective of this study was to establish the repeatability and reproducibility limits of several volume-related PET image–derived indices—namely tumor volume (TV), mean standardized uptake value, total glycolytic volume (TGV), and total proliferative volume (TPV)—relative to those of maximum standardized uptake value (SUVmax), commonly used in clinical practice. Methods: Fixed and adaptive thresholding, fuzzy C-means, and fuzzy locally adaptive Bayesian methodology were considered for TV delineation. Double-baseline 18F-FDG (17 lesions, 14 esophageal cancer patients) and 3′-deoxy-3′-18F-fluorothymidine (18F-FLT) (12 lesions, 9 breast cancer patients) PET scans, acquired at a mean interval of 4 d and before any treatment, were used for reproducibility evaluation. The repeatability of each method was evaluated for the same datasets and compared with manual delineation. Results: A negligible variability of less than 5% was measured for all segmentation approaches in comparison to manual delineation (5%–35%). SUVmax reproducibility levels were similar to others previously reported, with a mean percentage difference of 1.8% ± 16.7% and −0.9% ± 14.9% for the 18F-FDG and 18F-FLT lesions, respectively. The best TV, TGV, and TPV reproducibility limits ranged from −21% to 31% and −30% to 37% for 18F-FDG and 18F-FLT images, respectively, whereas the worst reproducibility limits ranged from −90% to 73% and −68% to 52%, respectively. Conclusion: The reproducibility of estimating TV, mean standardized uptake value, and derived TGV and TPV was found to vary among segmentation algorithms. Some differences between 18F-FDG and 18F-FLT scans were observed, mainly because of differences in overall image quality. The smaller reproducibility limits for volume-derived image indices were similar to those for SUVmax, suggesting that the use of appropriate delineation tools should allow the determination of tumor functional volumes in PET images in a repeatable and reproducible fashion.
Most current PET clinical practices for diagnosis, staging, prognosis, therapy-response assessment, and patient follow-up rely on manual and visual analysis (1). The index most commonly used in PET clinical studies is the standardized uptake value (SUV). To obtain this index of activity accumulation, a region of interest (ROI) should be determined, usually drawn manually or using some fixed threshold. Although an ROI is not the only factor that can affect the accuracy of SUVs, the type and size of an ROI are large contributors to the variability of such measurements, as has been previously demonstrated (2,3). A popular alternative is the use of the pixel with the maximum activity value, usually referred to as the maximum SUV (SUVmax). Many studies have demonstrated the prognostic and predictive value of SUVmax, despite the fact that it is sensitive to image noise (4,5). On the other hand, a few, mostly recent, studies have explored the use of overall tumor volume (TV) as an index for prognosis and response assessment (6–8). These studies considered the TV either alone or in combination with the mean SUV (SUVmean), to form the total glycolytic volume (TGV) and total proliferative volume (TPV) (for 18F-FDG and 3′-deoxy-3′-18F-fluorothymidine [18F-FLT], respectively), defined as the product of TV × SUVmean (9–11).
The accuracy, robustness, repeatability, and reproducibility of image delineation are directly responsible for the reduced use of functional volumes derived from PET images. On the one hand, manual delineation of functional volumes using PET images leads to high inter- and intraobserver variability (3), principally arising from the poor quality of PET images. On the other hand, current state-of-the-art algorithms for functional-volume segmentation consist of fixed- (12) or adaptive-threshold approaches (13,14). Although fixed-threshold approaches are attractive because of their simplicity, their drawbacks are numerous given that the value of the threshold to be used for each lesion clearly depends on multiple factors, such as lesion contrast and size and image noise (15). The solutions based on the use of adaptive thresholding consider the contrast between the object to delineate and its surrounding background. However, adaptive thresholding requires imaging system–specific optimization using uniformly filled spheric lesions, hence reducing the robustness of the approach, particularly in the case of multicenter trials. In addition, this method depends on the background ROI choice, which can in turn lead to reduced interobserver reproducibility for functional-volume determination. A few automatic algorithms have been proposed (16–19). The main difference between these algorithms and the threshold-based approaches is that the algorithms automatically estimate the parameters of interest and find the optimal regions’ characteristics in a given image, without system-dependent parameters. This technique may reduce issues associated with deterministic approaches based on thresholding, potentially increasing the robustness and reproducibility of PET functional-volume determination (20).
Establishing the level of reproducibility and repeatability is essential in the use of any image-derived index in prognostic or therapy-response studies, allowing the evaluation of which change between 2 studies can be considered significant. To date, only a few reproducibility studies (21–25), almost exclusively concentrating on SUVmax and SUVmean variability in double-baseline 18F-FDG PET scans, have shown a relative absolute percentage difference of up to 13%, with an SD of 10%. The reproducibility of quantitative indices (Patlak influx constant), associated with the acquisition of dynamic datasets, has also been assessed (21,22), showing similar levels of reproducibility (mean percentage difference, 8%–10%). Studies on the reproducibility of such indices in the case of 18F-FLT PET have shown that changes larger than 15%–20% and 25%–30% may be considered significant in SUVmean (obtained using a 41% fixed threshold) and SUVmax or Patlak influx constant, respectively (26,27).
In most of these studies, SUVmean has been calculated using manually drawn ROIs or a single fixed threshold (varying from 40% to 75% of the maximum activity). Among these studies, only 1 has considered the reproducibility of metabolic functional volumes using a fixed threshold. Krak et al. (3) have shown a mean percentage difference in the ROI volumes of 23% ± 20% and 55% ± 35% for a fixed threshold of 50% and 75%, respectively. Finally, to our knowledge there has been no published study evaluating the reproducibility of TGV and TPV.
To date, despite numerous studies assessing the accuracy of different segmentation algorithms, there is a lack of evaluation of the repeatability and reproducibility of these algorithms relative to different threshold- and automatic-based delineation approaches. Therefore, the main objective of this study was to assess the repeatability and reproducibility in determining 3-dimensional (3D) functional volumes and associated indices (SUVmean, TGV, and TPV) in PET using different algorithms. The reproducibility of SUVmax was also included because it represents the index most used today in clinical practice and facilitates a direct comparison with previous studies. This evaluation was performed on double-baseline 18F-FDG and 18F-FLT clinical PET datasets.
MATERIALS AND METHODS
Segmentation Algorithms Considered
Four approaches were used in this work. Two different fixed thresholds (12) were considered, at 42% (T42) and 50% (T50) of the maximum voxel value, using a region-growing algorithm with the maximum-intensity voxel as seed.
An adaptive-threshold method (TSBR, for threshold source–to–background ratio) (13) was also included:
For automatic-segmentation approaches, the fuzzy C-means (FCM) (28) clustering algorithm, with 2 clusters (background and lesion), was considered. This algorithm has been previously used for functional-volume segmentation tasks in both brain and oncology applications (29,30) and iteratively minimizes a cost function of the voxel-intensity values to estimate the center of each cluster and membership of each voxel to these clusters. The second automatic algorithm considered was the fuzzy locally adaptive Bayesian (FLAB) (19) methodology, based on a combination of statistical models with a fuzzy measure to simultaneously address issues of both noise and blur resulting from partial-volume effects in PET images. FLAB is also able to deal with strongly heterogeneous uptake in tumors of complex shape and generate nonbinary segmented volumes by considering 3 classes and the associated fuzzy transitions (31). The parameters required for the segmentation (gaussian mean and variance of each class and spatial priors for each voxel) were estimated using the iterative stochastic expectation maximization procedure. For all approaches, the tumors were delineated after having been isolated in a 3D box of interest previously defined and fixed for all segmentation methodologies (manual and automatic).
Repeatability and Reproducibility: Definitions
Within the context of this study, repeatability is defined as the ability of a given segmentation algorithm to reach the same result regarding the definition of a functional volume when applied multiple times on a single image. In such a task, entirely deterministic fixed-threshold approaches (T42, T50) will always give the same result. On the other hand, more advanced methods—for example, the adaptive thresholding or automatic algorithms such as FCM and FLAB considered here—are susceptible to giving different results when applied multiple times on the same image. The adaptive-threshold segmentation, for instance, depends on a manually drawn background ROI and may thus result in variable delineation depending on the choice of this ROI. On the other hand, FCM and FLAB are iterative procedures that may not converge to the same result at each execution. Finally, manual delineation may be considered as the least repeatable, even when considering a single operator (intraoperator variability). A second aspect considered in this study was the impact of a segmentation algorithm on the reproducibility of determining functional volumes from 2 baseline PET scans.
Two different clinical datasets—comprising esophageal and breast cancer patients scanned with 18F-FDG and 18F-FLT, respectively—were used. In both cases, 2 consecutive PET scans were acquired at an interval of a few days. We therefore studied the differences in derived functional TVs, lesion SUVmean, and TGVs and TPVs extracted from both images. The repeatability of measuring TVs using the various delineation approaches considered in this study was investigated for the same clinical datasets.
Validation Studies
Fourteen whole-body 18F-FDG PET/CT images acquired for patients with esophageal cancer (n = 17 lesions) and nine 18F-FLT PET/CT images acquired for breast cancer patients (n = 12 lesions) were considered. Esophageal cancer patients’ images were acquired at 3.4 ± 2.2 d on a PET/CT scanner (Gemini; Philips), with 2-min acquisitions per bed position, 60 min after the 18F-FDG injection (6 MBq/kg). Data were reconstructed using a 3D row-action maximization-likelihood algorithm with standard clinical protocol parameters (2 iterations, relaxation parameter of 0.05, 5 mm in full width at half maximum, 3D gaussian postfiltering). 18F-FLT PET images were acquired for patients with breast cancer (27); 2 scans were obtained within 2–7 d (median, 4.1 d) before treatment. All patients received a single bolus intravenous injection of 18F-FLT (153–381 MBq) over 30 s, and dynamic PET was performed for 95 min. Patients were scanned on a PET scanner (ECAT962/HR+; CTI/Siemens), and data were reconstructed using ordered-subset expectation maximization (360 iterations, 6 subsets, no postfiltering).
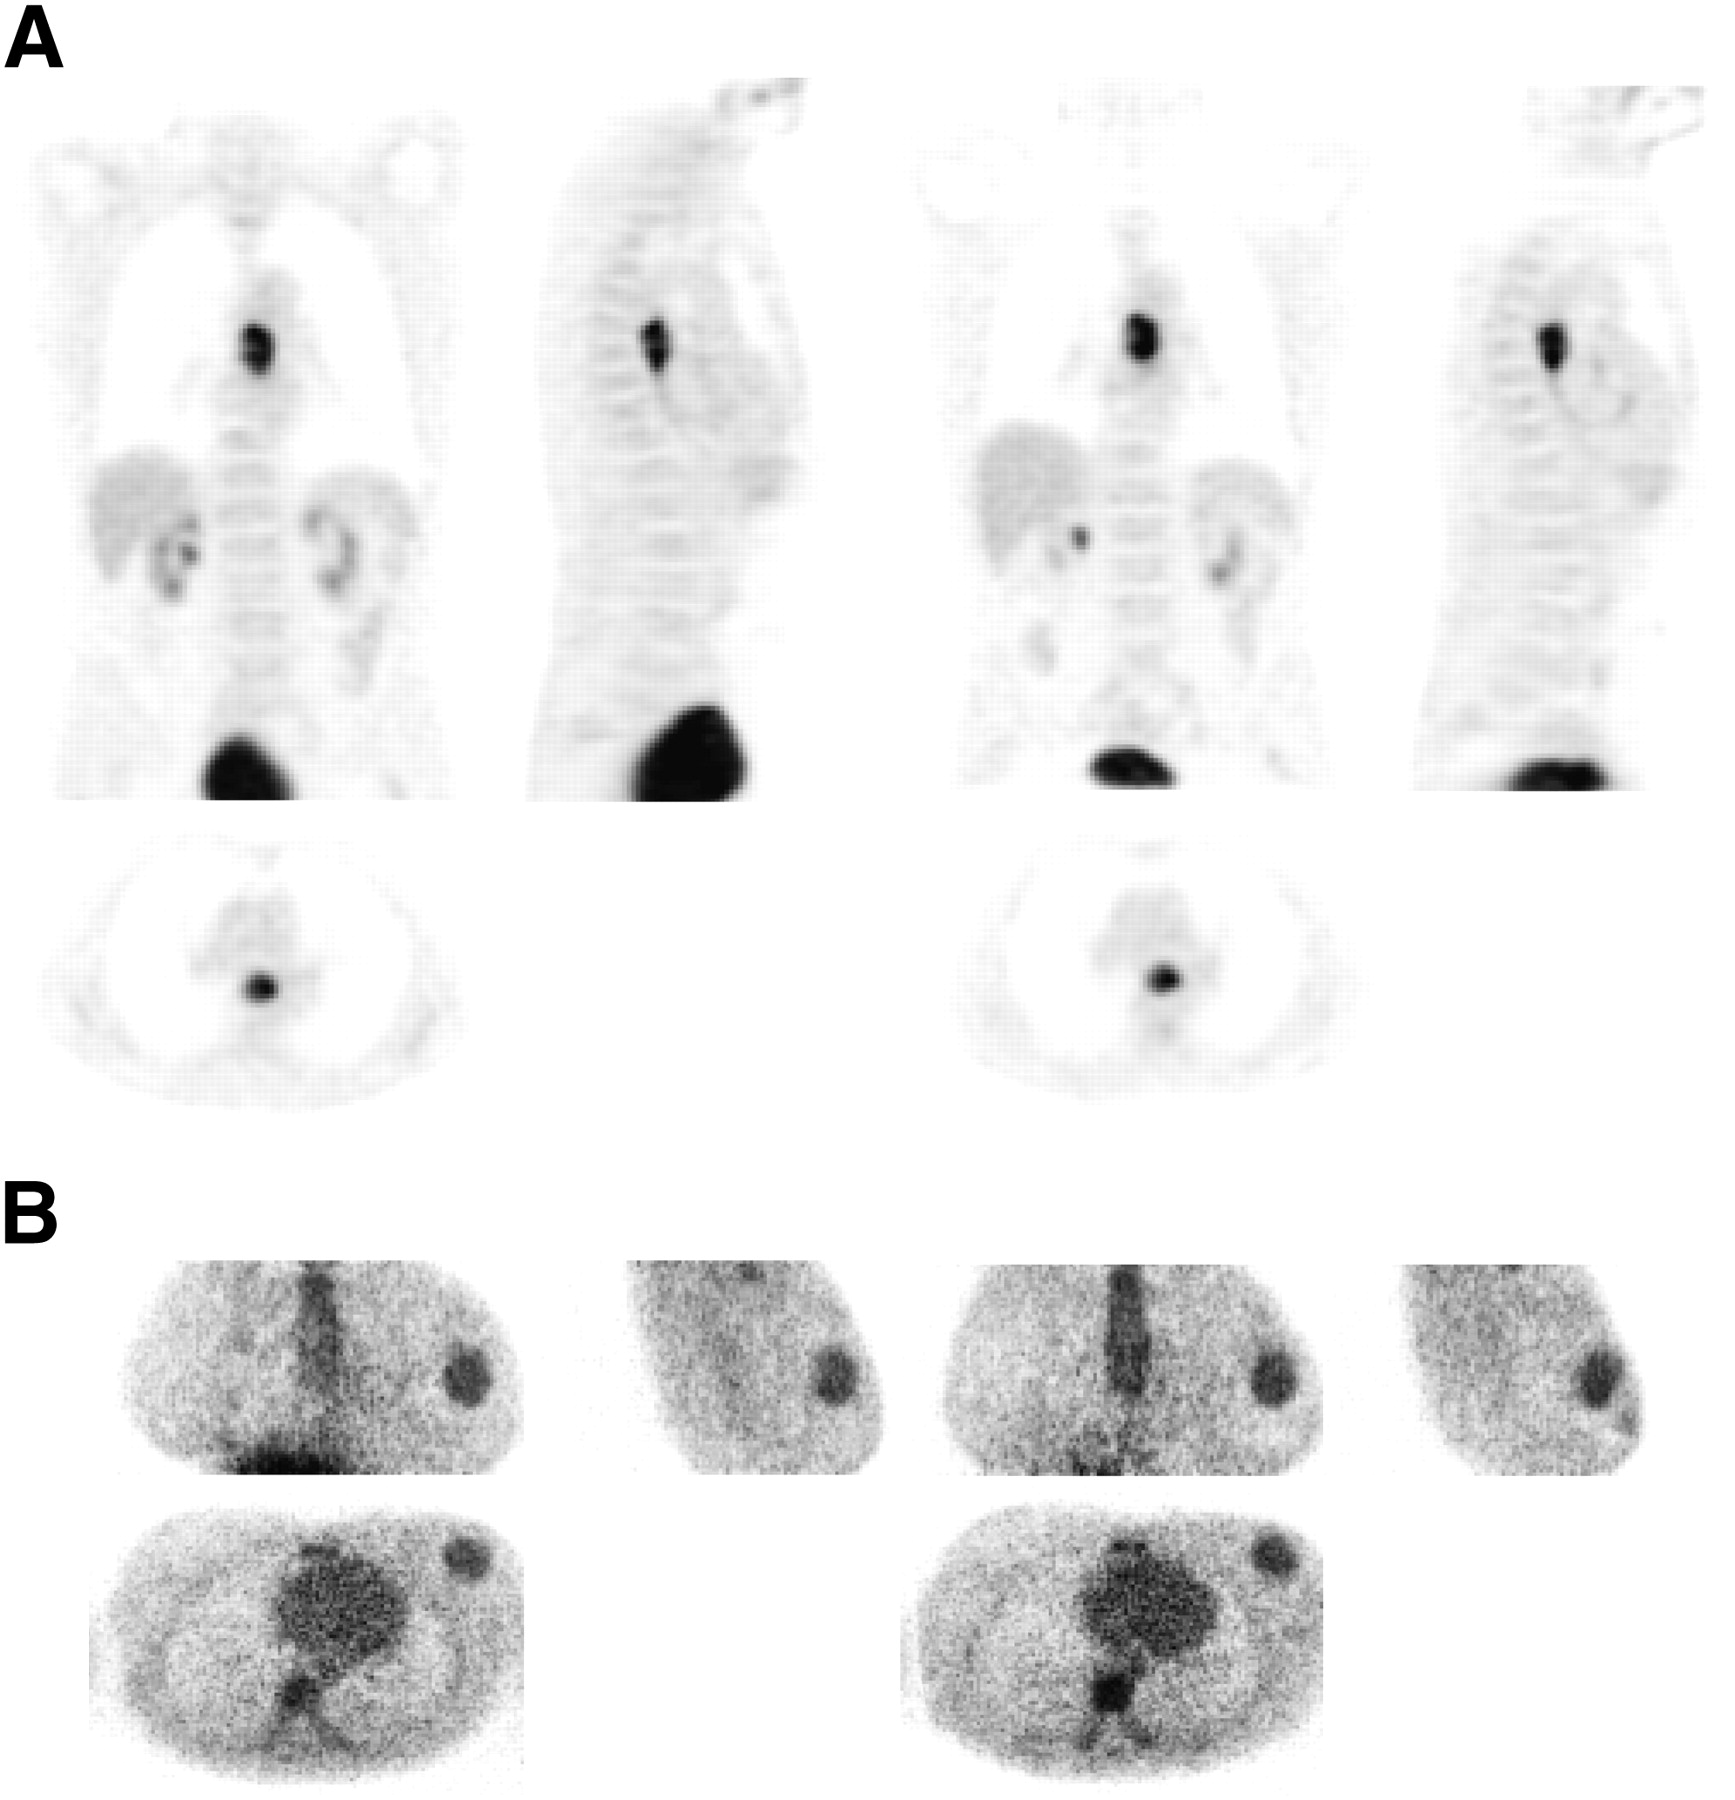
In both cases, 2 baseline scans were acquired within an average of 3–4 d of each other. Because no treatment was administered between the 2 baseline scans, and considering the short time between the 2 acquisitions, the assumption was that no significant physiologic changes occurred in between the time the scans were obtained. A similar assumption had been previously used in all other studies evaluating the reproducibility and repeatability of different SUV measurements in PET, with double-baseline scans obtained within 5–10 d (21–25). Figure 1 shows the 2 baseline scans—1 for an esophageal cancer (Fig. 1A) and 1 for a breast cancer (Fig. 1B) patient.

Baseline images: 18F-FDG (esophagus) (A) and 18F-FLT (breast) (B).
Analysis
For the repeatability evaluation, the tumors in the first image for each patient were segmented 10 times each with FCM, FLAB, and TSBR. In addition, manual delineation was performed by 2 nuclear medicine experts. More specifically, the 2 experts performed 10 different slice-by-slice manual delineations for the different lesions considered in a randomized fashion, ensuring a minimum of a week between 2 consecutive delineations of the same lesion. All these manual segmentations were performed under the same conditions as those of full-range contrast display. The mean percentage variability and associated SD with respect to the mean segmented volume was computed for each of the lesions and segmentation approaches across the 10 executions and across the 10 manual delineations, to assess the repeatability of the approaches. The repeatability of the manual delineations of the 2 experts were compared separately (intraobserver variability) and with each other (interobserver variability) using intraclass coefficients.
To study the relative impact of the different segmentation algorithms on the reproducibility of deriving different PET image indices, TVs were segmented independently on both baseline scan images for each lesion, using the different automatic-segmentation approaches. Subsequently, TV (in cm3), SUVmean, TGV or TPV, and SUVmax quantitative values (M) were computed for each delineated lesion and compared between the 2 scans using the mean percentage difference relative to the mean of both baseline scans:
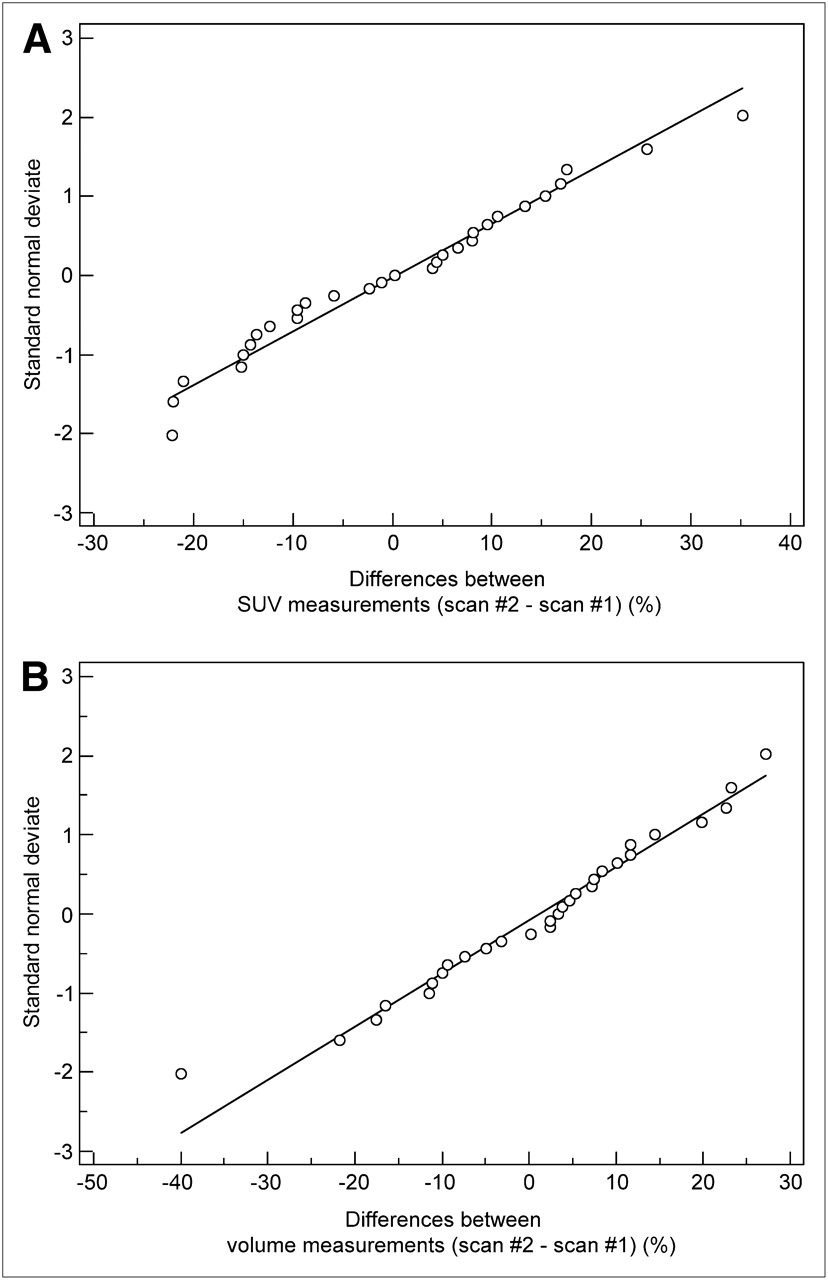
The distribution of the differences between each pair of measurements was assessed for each index using the Kolmogorov–Smirnov test, showing no significant differences from a normal distribution (Fig. 2). Bland–Altman analysis (32) was subsequently used to highlight differences between segmentation methodologies. Mean and SD of differences and the respective 95% confidence intervals (CIs) were obtained. To define the reproducibility limits (reference range of spontaneous changes), the 95% CIs for the difference between 2 measurements were computed as the mean difference ± 1.96 times the SD of the difference. To investigate any potential correlations in the measured reproducibility, the magnitude of the percentage difference for the TV, SUVmax, and SUVmean measurements was compared with the average of the TVs using the Pearson correlation coefficient r. This analysis was repeated to investigate the correlation of the reproducibility of the different parameters with the SUVmean.

Plots showing that distributions of differences for SUVmean (FLAB) (A) and TV (FLAB) (B) between 2 scans were not significantly different from normal.
RESULTS
Table 1 contains the mean variability and SD around the mean segmented volume across the 10 manual delineations performed by each of the 2 nuclear medicine experts and 10 repeated executions of the FLAB, FCM, and TSBR algorithms. Results for both clinical datasets are presented separately. FLAB demonstrated highly repeatable results in all of the studied cases, with negligible variability (1%) around the mean segmented 3D volumes across the different repeated executions. FCM also led to satisfactory repeatability results (1.4% ± 1.6% for the 18F-FDG cases and 2.3% ± 1.9% for the 18F-FLT cases). In comparison, the use of the TSBR led to more than twice as high variability (2.9% ± 2.7% and 4.7% ± 3.6% for the 18F-FDG and 18F-FLT cases, respectively). By contrast, manual segmentation by the 2 experts showed high intraobserver variability for 18F-FDG esophageal lesions (14.1% ± 12.1% and 16.4% ± 11.3% for experts 1 and 2, respectively). Interobserver variability was 17.1% ± 14.3%, with an intraclass coefficient of 0.67 (95% CI, 0.39–0.89). In the case of 18F-FLT, this variability was even higher, with an intraobserver variability of 22.1% ± 18.7% and 23.8% ± 17.8% for experts 1 and 2, respectively, and an interobserver variability of 27.4% ± 21.9%, with an intraclass coefficient of 0.59 (95% CI, 0.31–0.84).
Repeatability Evaluation
Tables 2 and 3 contain a summary of the reproducibility results for the different parameters computed from Bland–Altman plots on the 2 consecutive baseline scans for 18F-FDG esophageal and 18F-FLT breast lesions, respectively. The observed reproducibility of SUVmax and SUVmean measurements for the volumes obtained using TSBR and FLAB is illustrated in Figure 3. The corresponding plots for TV are shown in Figures 4A and 4B using TSBR and FLAB, respectively.
Reproducibility Results Using 18F-FDG for Esophageal Lesions
Reproducibility Results Using 18F-FLT for Breast Lesions
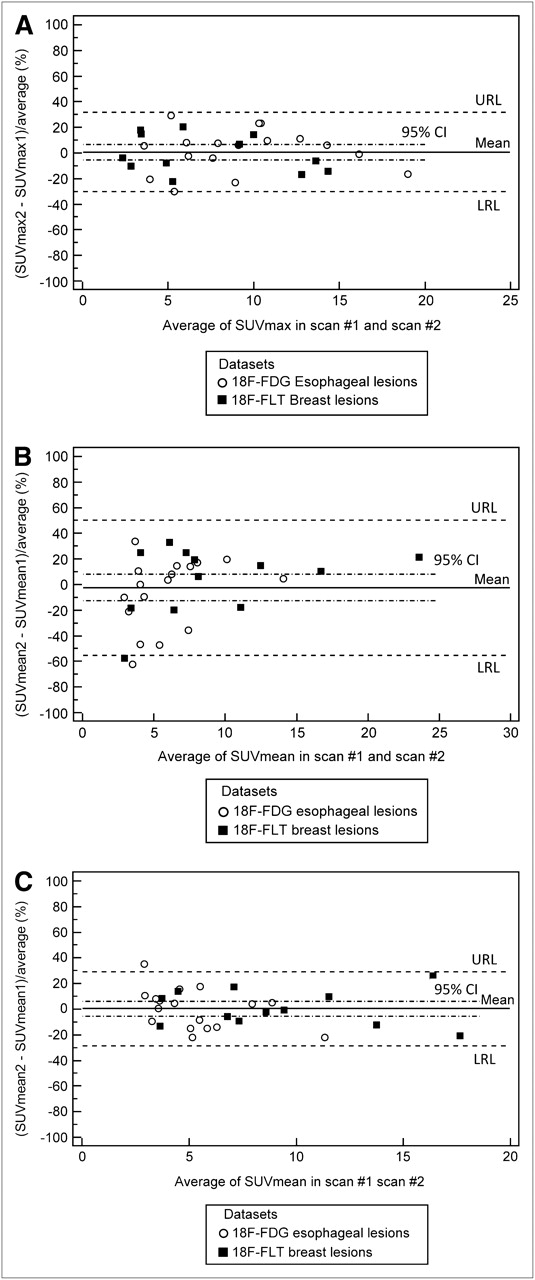
Bland–Altman plots of SUVmax (A), SUVmean using adaptive thresholding (B), and SUVmean using FLAB (C) for both 18F-FDG and 18F-FLT lesions. Lines show combined mean, 95% CI, and upper and lower reproducibility limits. Individual values for 18F-FDG and 18F-FLT lesions are shown in Tables 2 and 3, respectively. LRL = lower reproducibility limit; URL = upper reproducibility limit.

Bland–Altman plots of TV using adaptive thresholding (A) and TV using FLAB (B) for both 18F-FDG and 18F-FLT lesions. Lines show combined mean, 95% CI, and upper and lower reproducibility limits. Individual values for 18F-FDG and 18F-FLT lesions are shown in Tables 2 and 3, respectively. LRL = lower reproducibility limit; URL = upper reproducibility limit.
Concerning the reproducibility of SUVmax, similar percentage differences were measured for the 18F-FDG and 18F-FLT datasets, with an SD of the mean percentage difference of 16.7% and 14.9%, respectively. The upper and lower percentage reproducibility limits for the SUVmax were −31% to 35% and −30% to 28% for the 18F-FDG and 18F-FLT datasets, respectively. On the other hand, the automatic approaches led to 18F-FDG TV measurement reproducibility limits of −21% to 31% and −51% to 52% for the FLAB and the FCM algorithms, respectively. A poorer reproducibility of the 18F-FDG TV measurements was observed for the threshold-based approaches, with upper and lower reproducibility limits of −90% to 51% and −69% to 73% for the adaptive and T42, respectively. In the case of 18F-FLT TV measurements, the reproducibility was similar to that of 18F-FDG for the threshold-based approaches, whereas a deterioration in the reproducibility obtained with the automatic approaches was observed, particularly for the FCM algorithm (with reproducibility limits of −66% to 74%).
SUVmean measurements using FLAB exhibited reproducibility levels similar in magnitude to that for the TV definition, with an SD of the mean percentage difference of 15.6% and 14.1% for the 18F-FDG and 18F-FLT datasets, respectively. This was, however, not the case for the other tumor-delineation algorithms considered, with the larger SUVmean reproducibility limits using the FCM tumor definition (−77% to 62% and −59% to 59% for the 18F-FDG and 18F-FLT datasets, respectively). Finally, the smaller SUVmean reproducibility for the threshold-based approaches was obtained using T50 for both the 18F-FDG and the 18F-FLT datasets, with a mean percentage difference of −10.5% ± 23% and −13.3% ± 16.8%, respectively.
The reproducibility of TGV and TPV, being the product of TV and SUVmean, was dependent on the direction of changes for both TV and SUVmean. As an increase of TV was correlated with a decrease of SUVmean and vice versa (P < 0.002; r = 0.54, 0.67, and 0.72 for FLAB, TSBR, and T42, respectively), TGV and TPV reproducibility levels were generally similar in magnitude to the TV and SUVmean considered separately. However, in certain cases there were more increases or decreases of both TV and SUVmean for a given patient, resulting in larger variability of the TGV and TPV measurements (e.g., the TSBR measurements of the 18F-FLT breast lesions, with 22.1% ± 48.9% for the TPV, whereas TV and SUVmean were 11.3% ± 31.4% and −3.2% ± 26.5%, respectively).
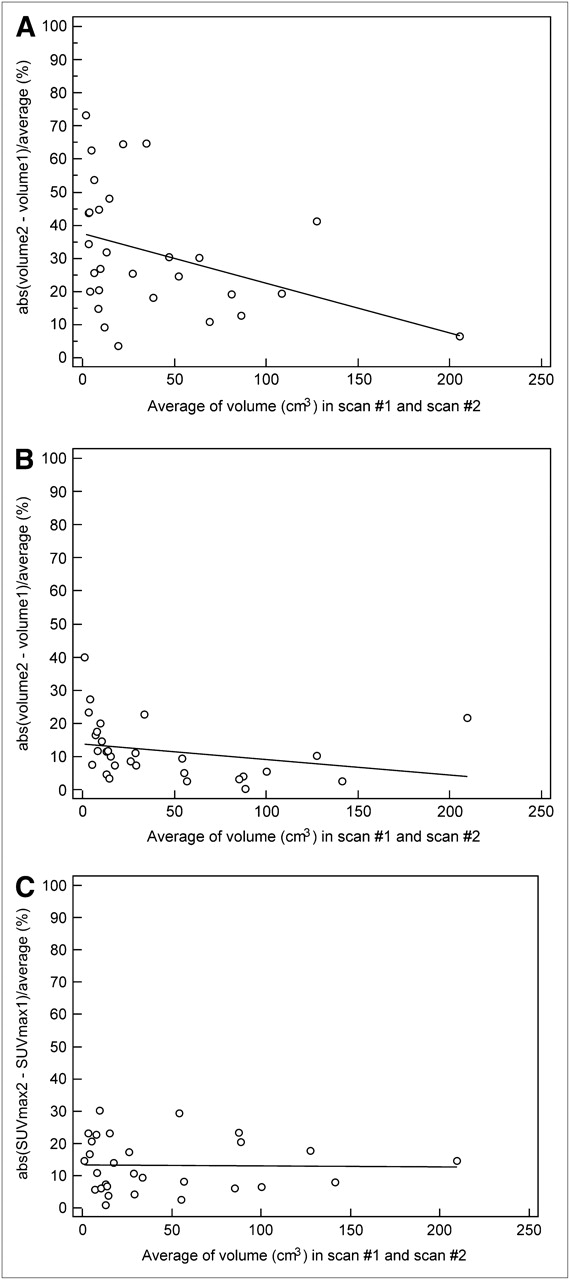
The TV reproducibility results were dependent on the measured TV, with a larger variability seen for smaller tumors. This dependence was statistically significant for the adaptive thresholding (r = 0.37, P = 0.046; Fig. 5A), with differences higher than 30% on average (≤75%) in several of the tumors below 50 cm3. On the other hand, this dependence was not significant for FLAB (r = 0.27, P = 0.16; Fig. 5B), with most differences less than 30%—irrespective of TV—further demonstrating improved robustness, as previously shown (19,20). In terms of the SUVmax reproducibility results, no statistically significant trend with either the lesion size (r = 0.016, P = 0.93; Fig. 5C) or the mean of the 2 SUVmean measurements (r = 0.14, P = 0.49) was observed. Finally, no statistically significant trends were found for the SUVmean reproducibility depending on the lesion size, irrespective of the segmentation algorithm used (r = 0.2, P = 0.3, and r = 0.23, P = 0.23, for TSBR and FLAB, respectively).

Differences between TVs (A and B) and SUVmax (C) measured in 2 baseline scans in relation to average TV obtained using adaptive thresholding (A) and FLAB (B and C). abs = absolute.
DISCUSSION
Functional-volume delineation today represents an area of interest for multiple clinical (routine and research) applications of PET (prognosis, response prediction, therapy assessment, radiotherapy treatment planning). In all of these applications, the repeatability and reproducibility with which functional volumes can be determined under different imaging conditions play a predominant role, allowing a level of confidence to be established in the use of such TV measurements. Volume-definition methodologies currently used in clinical practice are based on the use of manual delineation or fixed and adaptive thresholding (12–14), whereas several promising automatic algorithms have been proposed (16–19). The major drawback of manual delineation is high inter- and intraobserver variability; in addition, the approach is time-consuming. On the other hand, currently considered state-of-the art adaptive threshold–based algorithms have been shown to accurately define functional volumes under certain imaging conditions of spheric and homogeneous-activity-distribution lesions. However, adaptive-threshold approaches usually involve some user interaction to select background ROIs, which can potentially lead to user-introduced variability. Although signal intensity reproducibility, predominantly considering the use of SUVmax, has been previously assessed, the potential of new indices such as TV or TGV and TPV can be considered only after the assessment of their reproducibility, which has not been previously widely assessed. Therefore, in this study the reproducibility limits of these indices, in comparison to other indices considered as the current gold standard, have been assessed using different tumor-delineation methodologies on double-baseline 18F-FDG and 18F-FLT datasets.
In terms of repeatability, all algorithms exhibited mean differences of less than 5%, with automatic approaches coming closer to the perfect repeatability that can be achieved by deterministic approaches such as a fixed threshold. The repeatability of both threshold and automatic-segmentation approaches was superior to that of manual delineation. This should, of course, be considered within the context of the limited absolute accuracy of thresholding, particularly for lesions not homogeneous in form and activity distribution (31).
The variability in the SUVmax observed in this work is similar to that measured in previous reproducibility studies, with comparable percentage differences for 18F-FDG and 18F-FLT datasets. These percentage differences suggest that differences larger than −30% can be considered as significant in treatment response, whereas changes above 35% (30% for 18F-FLT) may be indicative of no response. Depending on the delineation algorithm used, the mean percentage difference and corresponding SD for TV measured on the 2 baseline scans varied from 5% ± 13% to −19% ± 36% for the 18F-FDG and from 4% ± 16% to 10% ± 35% for the 18F-FLT datasets. The smallest TV reproducibility limits obtained were similar to those for SUVmax. These limits ranged from −21% to 31% and −27% to 35% for 18F-FDG and 18F-FLT, respectively, suggesting in turn that, depending on the segmentation algorithm used and similar to SUVmax, CIs may be considered for monitoring therapy response based on functional TV. Similarly, in the case of TGV and TPV the smallest reproducibility limits measured were between −16% to 26% and −30% to 37% for 18F-FDG and 18F-FLT, respectively. On the other hand, the largest reproducibility limits for the 18F-FDG TV and TGV ranged from −90% to 73% and from −68% to 52%, respectively.
Reproducibility ranges obtained for the 18F-FDG esophageal lesions were almost systematically smaller than the ones obtained on the 18F-FLT breast lesions—which can be attributed to the higher level of noise and overall lower contrast observed in the 18F-FLT cases, resulting in less robust delineations. In addition, 18F-FDG esophageal lesions tended to appear more homogeneous than breast lesions. For instance, FCM—which incorporates neither noise nor spatial modeling—is associated with a larger mean TV variability of the 18F-FLT dataset relative to 18F-FDG, whereas FLAB exhibited similar reproducibility levels for both. The variability in reproducibility highlights the need for a robust delineation tool ensuring high reproducibility in an environment of substantial image-quality variability—likely, for example, to be encountered in multicenter trials in which the use of functional TV as a measure of response to therapy may be considered.
T50 uses a more restrictive threshold than 42% and is therefore less prone to large overevaluation of low contrast (<4:1) or small-size (<2 cm in diameter) TVs. T50 led to systematically lower variability than T42. Finally, the adaptive-threshold methodology did not demonstrate better reproducibility than did fixed thresholding, which can be attributed to the use of the background ROI placed manually on both scans, combined with the fact that background activity may also vary between the 2 scans.
Although a potential criticism for the current study can be the lack of ground-truth for the functional volumes, the aim of this work was not to assess the absolute accuracy of algorithms, which has been assessed previously for the approaches used in this work (19,31). The objective was to assess the reproducibility limits of functional-volume–related indices that can be attained depending on the algorithm. Within this context, the repeated studies of the double-baseline acquisitions have been performed within an average of 3–4 d, without any treatment between them, matching the method used by all other reproducibility studies to date (21–25). Finally, the reproducibility of SUVmax was included in this work as the current gold standard, facilitating at the same time the comparison of our reproducibility study to those performed previously. The SUVmax reproducibility limits obtained in this work for both 18F-FDG and 18F-FLT agree closely with those of previous studies.
CONCLUSION
The smaller reproducibility ranges obtained for the different image indices considered in this study, similar to those of SUVmax, suggest that new automatic-segmentation approaches may facilitate the introduction of TVs or a combination of TVs and signal intensity in the form of TGVs and TPVs derived from PET images for therapy-response studies. However, our results also demonstrate that the reproducibility of different quantitative parameters associated with functional volumes depends significantly on the delineation approach.
Acknowledgments
We gratefully acknowledge funding by the Ligue Contre le Cancer (Finistère Committee), French National Research Agency (ANR-08-ETEC-005-01), Cancéropôle Grand Ouest (R05014NG), CR-UK & EPSRC Cancer Imaging Centre (Imperial College, London), U.K. Medical Research Council, and Department of Health (C2536/A10337, U.1200.02.005.00001.01).
- © 2010 by Society of Nuclear Medicine
REFERENCES
- Received for publication April 28, 2010.
- Accepted for publication June 10, 2010.


Jump to section
Related Articles
Cited By...
- Quantitative Test-Retest Measurement of 68Ga-PSMA-HBED-CC in Tumor and Normal Tissue
- Evaluation of the Usefulness of FDG-PET/CT for Nodal Staging of Breast Cancer
- Reproducibility and Repeatability of Semiquantitative 18F-Fluorodihydrotestosterone Uptake Metrics in Castration-Resistant Prostate Cancer Metastases: A Prospective Multicenter Study
- Repeatability of SUV in Oncologic 18F-FDG PET
- Reliability of PET/CT Shape and Heterogeneity Features in Functional and Morphologic Components of Non-Small Cell Lung Cancer Tumors: A Repeatability Analysis in a Prospective Multicenter Cohort
- Repeatability of 18F-FLT PET in a Multicenter Study of Patients with High-Grade Glioma
- Comparison of Tumor Uptake Heterogeneity Characterization Between Static and Parametric 18F-FDG PET Images in Non-Small Cell Lung Cancer
- Repeatability of Quantitative 18F-Fluoromethylcholine PET/CT Studies in Prostate Cancer
- Repeatability of 18F-FDG PET/CT in Advanced Non-Small Cell Lung Cancer: Prospective Assessment in 2 Multicenter Trials
- 18F-FDG or 3'-Deoxy-3'-18F-Fluorothymidine to Detect Transformation of Follicular Lymphoma
- Visual Versus Quantitative Assessment of Intratumor 18F-FDG PET Uptake Heterogeneity: Prognostic Value in Non-Small Cell Lung Cancer
- Variability of Total Lesion Glycolysis by 18F-FDG-Positive Tissue Thresholding in Lung Cancer
- Comparison Between 18F-FDG PET Image-Derived Indices for Early Prediction of Response to Neoadjuvant Chemotherapy in Breast Cancer
- 3'-Deoxy-3'-18F-Fluorothymidine PET-Derived Proliferative Volume Predicts Overall Survival in High-Grade Glioma Patients
- Noise Considerations for PET Quantification Using Maximum and Peak Standardized Uptake Value
- Reproducibility of Tumor Uptake Heterogeneity Characterization Through Textural Feature Analysis in 18F-FDG PET
- Impact of Partial-Volume Effect Correction on the Predictive and Prognostic Value of Baseline 18F-FDG PET Images in Esophageal Cancer
- Impact of Tumor Size and Tracer Uptake Heterogeneity in 18F-FDG PET and CT Non-Small Cell Lung Cancer Tumor Delineation
- Effects of Image Characteristics on Performance of Tumor Delineation Methods: A Test-Retest Assessment
- Autocontouring Versus Manual Contouring
- Reply: Autocontouring Versus Manual Contouring