


Abstract
The purpose of this study was to investigate the clinical usefulness of PET/CT or CT-attenuated PET in the evaluation of patients with oral cavity cancer (OCC) in whom dental artifacts distorted the conventional CT or MR images of the oral cavity. Methods: A PET/CT scan, in addition to a CT or MRI scan, was performed in 69 patients with OCC who had dentures or dental implants. A total of 64 PET/CT, 64 CT, and 27 MR images were analyzed including images from scans performed on 40 patients with OCC without dental artifacts on the conventional images; these were used for comparison. The CT-attenuated PET scan for the detection of primary tumors was compared with the CT or MRI scan. We also evaluated the correlation between the PET/CT volume and the pathologic volume using a regression analysis. In addition, subgroup analysis was performed to determine what proportion of subjects benefited most from the PET/CT. Results: CT-attenuated PET detected more primary tumors than did CT in patients with OCC with dental artifacts (95.3% vs. 75.0%, respectively; P = 0.0016). PET/CT volume with a standardized uptake value (SUV) cutoff point of 3.5 predicted the pathologic volume more accurately than did the other cutoff points in patients with OCC with or without artifacts. After comparing pathologic volume and PET/CTSUV 3.5 volume, the following regression equation was developed: log (pathologic volume) = 0.6 × log (PET/CTSUV 3.5 volume) + 1.3 (R2 = 0.42, P < 0.0001). Subgroup analysis showed that the prediction of the pathologic volume from the PET/CT images was more reliable for tumors that were more than 2 cm in depth (R2 = 0.72). Conclusion: For patients with OCC with dental artifacts on the conventional imaging, PET/CT could provide useful clinical information about the primary tumors, particularly in cases with advanced tumors.
Accurate assessment of oral cavity cancers (OCCs) is critical for appropriate planning of treatment. The information about the depth and extent of invasion, the presence of mandible involvement, and the status of regional lymph nodes and distant sites depends mainly on the results of the pretreatment imaging studies. In addition to palpation and inspection, the imaging modalities used to evaluate the oral cavity include panoramic radiography, ultrasound, CT, MRI, and PET (1).
CT and MRI remain the primary methods for evaluation of OCCs. However, CT and MRI often do not accurately evaluate the primary tumors in patients with OCC with dental metallic implants or dentures. Metallic implants can cause artifacts on the CT or MRI scans and render the images nondiagnostic. Particularly for the CT images, the high density of the metallic foreign bodies distorts the attenuation data from the CT scan; this distortion leads to inconsistencies that hamper accurate calculation of the projection data. Because a CT scan uses filtered backprojection for image reconstruction, a starburst artifact is commonly created, which consists of radiating lines originating from the dental alloy (2,3). An MRI also has technical problems in evaluating oral cancers, although MR images, compared with CT images, provide superior information about the soft-tissue differences. Ferromagnetic dental fillings as well as swallowing or other movements may cause inaccuracies in the images obtained (4,5).
The 18F-FDG PET scan can be used as a functional tumor-detection modality in conjunction with or separate from anatomic imaging. PET has been particularly helpful in the evaluation of patients with nodal disease and with a clinically unknown primary for directing biopsies of clinically occult primary lesions, determining N stage, differentiating recurrent tumor from posttherapy changes, monitoring or predicting treatment response, and detecting second primary lesions as well as distant metastases (1,6–12). The PET/CT scan offers advantages over a PET scan alone, which is limited by poor anatomic localization, and a CT scan alone, which provides morphologic data only. PET/CT has been gaining acceptance for the evaluation of head and neck cancers, because it appears to have a higher accuracy than either modality alone (8,10,11,13).
Previous studies on PET or PET/CT for dental artifacts showed that the images from PET are also affected by a dental prosthesis (7,14). It was suggested that the dental work, which is visible as white spots in non–attenuation-corrected images, could induce artifacts in attenuation-corrected PET images, which mimic images with low 18F-FDG uptake (7). Although such artifacts can be distinguished from malignant lesions with high 18F-FDG uptake in patients with carcinoma of the head and neck, they could cause difficulty with the interpretation of small and superficial lesions adjacent to dental implants or dentures. For patients with nonremovable dental work, the usefulness of both the attenuation-corrected and the non–attenuation-corrected PET images requires further evaluation (7,14).
However, to date the clinical role of PET/CT or CT-attenuated PET, compared with CT or MRI alone, in patients with OCC with dental metallic implants or dentures has not been evaluated. PET/CT may provide anatomic and functional information that improves the imaging accuracy in such patients. Here, we investigated the clinical efficacy of PET/CT or CT-attenuated PET images for primary tumor detection and volume estimation in patients with oral cancer who had dental artifacts on the conventional CT or MR images.
MATERIALS AND METHODS
Patients
From 1995 to 2006, 261 patients with OCC were initially treated by surgery at Samsung Medical Center; 155 of these 261 patients (59.4%) had nonremovable dental metallic implants or dentures at diagnosis. Among these cases, we retrospectively reviewed 64 patients who had nonremovable dental metallic implants or dentures at the time of the pretreatment imaging work-up and on whom CT or MRI plus PET/CT were performed for the initial staging. We excluded patients in whom the pathologic serial sectioning had not been performed and in whom the imaging modalities had been performed using different scanning systems and different protocols; we also excluded those who were initially treated with modalities other than surgery. The Institutional Review Board of our hospital approved this study. A total of 64 PET/CT, 64 CT, and 27 MRI scans were analyzed for this study. Twenty-seven patients had all 3 diagnostic modalities (i.e., CT, MRI, and PET/CT) preoperatively. In addition, images from scans performed on 40 patients with OCC, who did not have dental artifacts on the conventional CT and MR images, were also analyzed for comparison. The characteristics of the subjects are summarized in Table 1.
Characteristics of OCC Patients With and Without Dental Artifacts
Diagnostic Imaging Modalities
CT and MRI Scans.
A CT scan (LightSpeed Ultra; GE Healthcare) of the head and neck, focusing on the oral cavity, was performed using the following parameters: 160 mAs, 120 keV, a section width of 3 mm, and a table feed of 8.75 mm per rotation. For contrast enhancement, 90 mL of an iodinated contrast agent (Ultravist 300; Schering) was injected intravenously at 3 mL/s using an automated injector. The scan delay time was 30 s. All MRI examinations were performed on a 1.5-T (Signa Advantage Horizon; GE Healthcare) or a 3-T (Interal Achieva; Philips) scanner. In all patients, precontrast T1-weighted spin-echo images and fat-suppressed, T2-weighted fast spin-echo images were obtained, followed by fat-suppressed, contrast-enhanced T1-weighted spin-echo images after the intravenous injection of 0.1 mmol of gadopentetate dimeglumine (Magnevist; Schering) per kilogram. Images were obtained in at least 2 planes with a 3- to 4-mm section thickness and a 0- to 1-mm intersection gap.
PET/CT Scans.
All patients fasted for at least 6 h before the PET/CT scans, which were performed using a Discovery LS PET/CT scanner (GE Healthcare). A whole-body CT scan was performed by a continuous spiral technique using 8-slice helical CT with a gantry rotation speed of 0.8 s. The CT scan data were collected using the following parameters: 80 mAs, 140 keV, a section width of 5 mm, and a table feed of 5 mm per rotation. No intravenous or oral contrast agents were used. After the CT scans and after the intravenous injection of 370 MBq of 18F-FDG, an emission scan was performed from the thigh to the head for 5 min per frame, for a total of 45 min. The duration of the uptake phase was 45 min. The attenuation-corrected 18F-FDG PET images using the CT data were reconstructed with an ordered-subset expectation maximization algorithm (28 subsets, 2 iterations). The images were displayed in a 128 × 128 matrix (pixel size, 4.29 × 4.29 mm, with a slice thickness of 4.25 mm). The separate CT and PET scan data were accurately coregistered using commercial software (eNTEGRA; GE Healthcare). The standardized uptake values (SUVs) were acquired using the attenuation-corrected images, amount of injected 18F-FDG, body weight of each patient, and cross-calibration factors between the 18F-FDG PET scanner and the dose calibrator.
Tumor Identification and Volume Measurement
All the images were displayed on an LCD monitor, using the picture-archiving communication systems (Centricity Radiology RA1000; GE Healthcare).
Tumor Identification Rate.
A radiologist specializing in head and neck imaging reviewed the CT and MRI scans, and a nuclear medicine physician, with more than 5 y of experience in interpreting head and neck imaging, reviewed the PET/CT scans. They were unaware of the patients' clinical and pathologic information. After retrospective analysis, they determined the primary tumor area in the oral cavity of each subject. If the primary tumors were not delineated, because of the metallic artifacts caused by the dental prosthesis or dentures, the cases were recorded as “tumor not identified” for each diagnostic modality (Fig. 1).
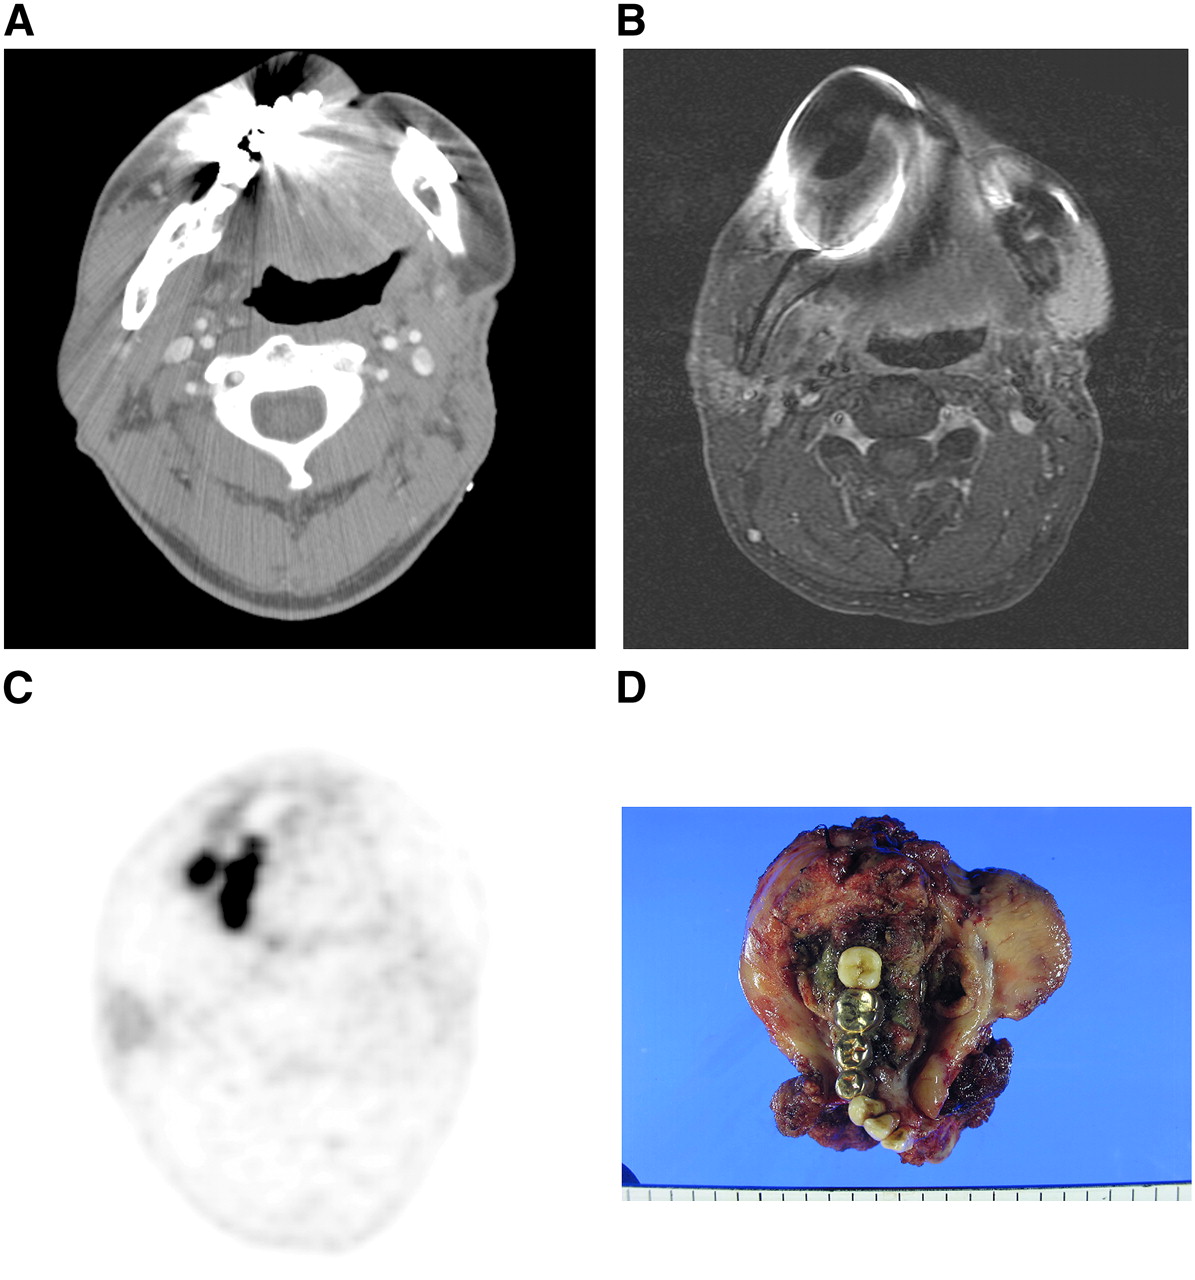
54-y-old male patient with squamous cell carcinomas of right retromolar area who underwent CT, MRI, and PET/CT scans during initial evaluation of tumor. In contrast-enhanced CT images (A) and in gadolinium-enhanced, fat-suppressed T1-weighted MR images (B), primary tumor was not identified because of metallic artifacts caused by nonremovable dentures. However, in CT-attenuated PET images (C), lesion showed asymmetric glucose uptake at peak SUV of 4.2 in right retromolar trigone and adjacent mandible and then finally was diagnosed as T4 oral cancer. (D) Pathologic examination revealed 5.5-cm-sized squamous cell carcinomas of retromolar trigone that invaded mandible.
Tumor Volume Measurement.
For calculating the tumor volume on CT and MRI scans, we used the axial contrast-enhanced CT scans and fat-suppressed, contrast-enhanced T1-weighted MR images. We viewed the CT scans with a window level of 50 and a window width of 150. By consensus, 1 radiologist and 1 surgical oncologist defined the tumor areas by manually drawing on each slice of stacked CT and MR images. The tumor volume was then calculated from the sum of the areas on the images multiplied by the slice thickness.
For the tumor volume calculation with the PET/CT, CT-attenuated PET images were used. Tumor tissue was identified on the PET images as any voxel in the 3-dimensional dataset with counts greater than a fixed threshold fraction of the peak activity in the tumor (15,16). The threshold level was selected from different cutoff values for the SUV (i.e., 2.5, 3.0, and 3.5). In each of the CT-attenuated PET images, the volumes of the abnormal uptake areas over the cutoff points (PET/CTSUV 2.5, PET/CTSUV 3.0, and PET/CTSUV 3.5) were calculated automatically by using software-based algorithms (Advantage Workstation, Volume Share version 2.0; GE Healthcare).
The surgical specimens from the oral cavity tumors were serially sectioned, with a thickness of 1 mm after fixation. In each slice, a pathologist defined the boundary of the tumors and then calculated the area by using the long and short diameters. Then the pathologic volume was calculated for each of the serially sectioned tumor specimens by adding all of the areas of the tumor and multiplying them by the slice profile.
Statistical Analysis
Statistical differences for the tumor identification rates among the imaging modalities were analyzed by the McNemar test with the Bonferroni adjustment. To evaluate the association between the pathologic volume and the PET/CT volume, a linear regression analysis after log transformation was performed for the normal distribution. In addition, a subgroup analysis based on the pathologic T stage and the depth of the tumors was performed to determine in which subjects a better correlation between the PET/CT volume and pathologic volume existed. SAS software (version 9.13; SAS Institute Inc.) was used for the statistical analyses. A 2-tailed P value of less than 0.05 was considered significant. For bone invasion (mandible and hard palate), we were unable to analyze the differences between diagnostic modalities because of only a few patients (only 4 in the group with artifacts and 5 in the group without artifacts) with pathologically proven bone invasion.
RESULTS
Among the subjects whose CT and PET/CT images were available for analysis (n = 64), the PET/CT (CT-attenuated PET images) scans showed a higher tumor detection rate than did the CT scans (95.3% vs. 75.0%, P = 0.0016) (Table 2). Among the subjects who had all 3 diagnostic modalities—PET/CT, CT, and MRI (n = 27)—the diagnostic performance for the detection of the primary tumors in the oral cavity was 96.3%, 77.8%, and 85.2%, respectively. Although PET/CT showed the highest scores among the 3, the differences did not reach statistical significance.
Overall Performance of Diagnostic Imaging Modalities for Detection of Primary Tumors in Oral Cavity in Patients with Dental Artifacts
For the CT scans, the 3-dimensional delineation of the tumor was not possible for all subjects, though some slices of the CT scan not affected by the dental artifacts provided diagnostic clues for tumor detection in the oral cavity. When we calculated the tumor volume by multiplying only the tumor areas that were visible in the CT images, the prediction of the pathologic volume from the CT tumor volume was not accurate (difference between CT volume and pathologic volume, P = 0.0063) (Table 3).
Tumor Volume Assessment from Each Imaging Modality
When we estimated the tumor volume in the MR images, similarly to the volume estimation in the CT scans, the prediction of the pathologic volume from the MRI tumor volume was also poor (difference between MRI volume and pathologic volume, P = 0.049).
However, the estimated tumor volume from the CT-attenuated PET images, compared with the CT or MR images, showed a better correlation with the pathologic volume. To determine the optimal cutoff points in the volume estimation from PET/CT, we calculated the PET/CT volume according to the SUV from 2.5 to 3.5, respectively. Among them, the PET/CT volume with an SUV cutoff point of 3.5 could predict the pathologic volume best (Table 3). In the group without artifacts, the results were similar. The estimated volume from CT or MRI scans was approximately half that of the final pathologic volume, in which the differences were significant. Meanwhile, the PET/CT volume (SUV = 3.5) could predict the pathologic volume better than other PET/CT, CT, or MRI volumes.
Subsequently, the regression analysis was performed to find out an equation that could predict the pathologic volume from PET/CT volume preoperatively. The regression equation for the results was log (pathologic volume) = 0.6041 × log (PET/CTSUV 3.5 volume) + 1.3046 (Fig. 2). The coefficient of determination (R2) was 0.416, suggesting that the presurgical prediction of the final pathologic tumor volume was acceptable from the calculated tumor volume determined by the PET/CTSUV 3.5 images in patients with OCC and dental artifacts.
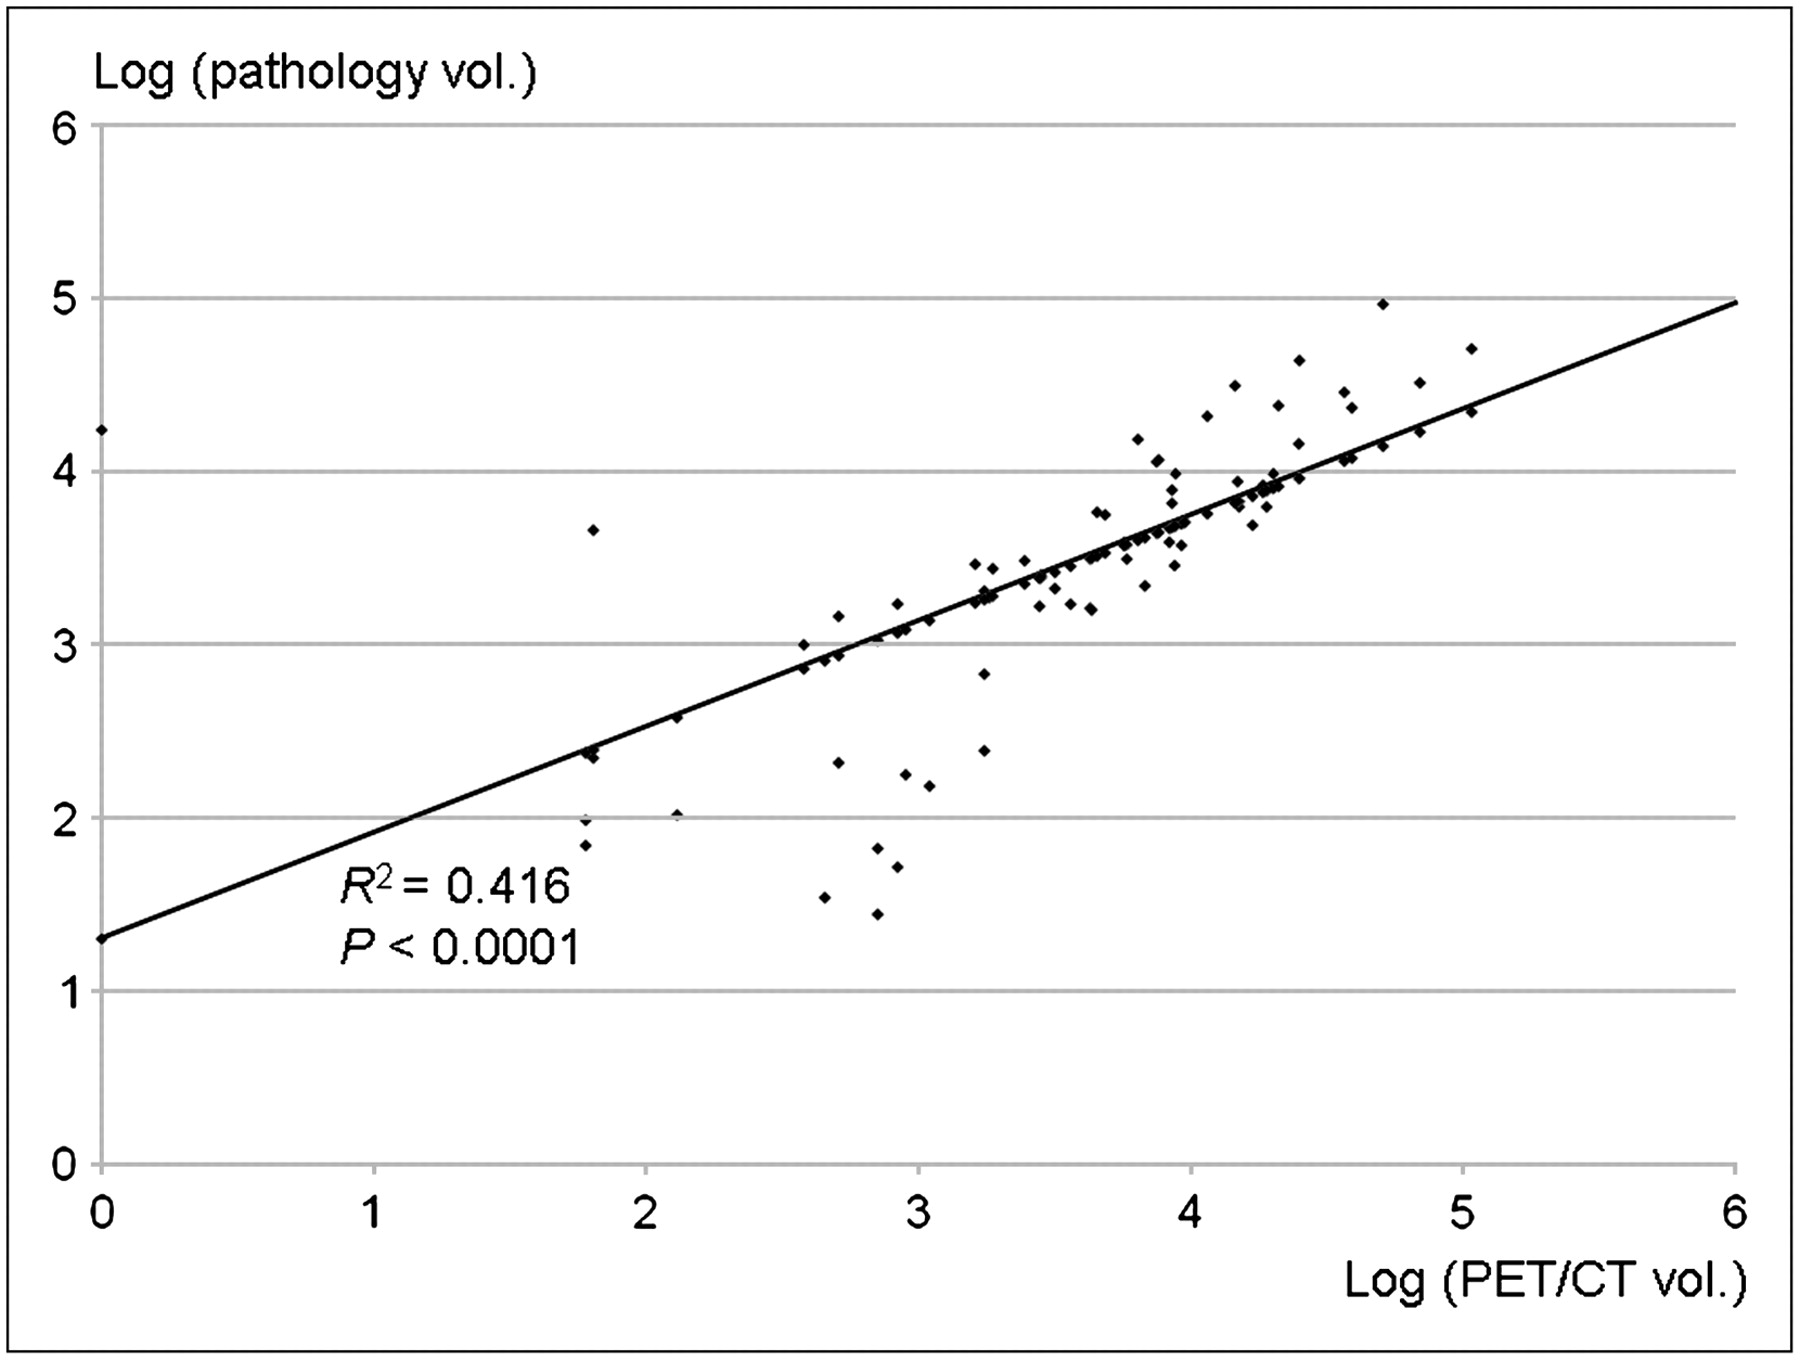
Regression equation between log (PET/CTSUV 3.5 volume) and log (pathologic volume) was log (pathologic volume) = 0.6041 × log (PET/CTSUV 3.5 volume) + 1.3046. Correlation coefficient (R) and coefficient of determination (R2) were 0.645 and 0.416, suggesting acceptable correlation between 2 variables. vol. = volume.
To clarify further the actual benefit from the tumor volume estimation based on the PET/CT scans, we performed a subgroup analysis according to the tumor stage and the depth of tumors, which is one of the most important prognostic indicators for OCCs (1). As a result, in tumors with more than 2 cm in depth the prediction of the pathologic tumor volume was more reliable than in others (R2 = 0.72), although all subgroups showed a correlation (P < 0.05) between the PET/CTSUV 3.5 volume and the pathologic volume (Table 4).
Subgroup Analysis
DISCUSSION
Precise information about the extent of tumors is critical for decisions of appropriate treatments in patients with OCCs. The CT and MRI scans are useful methods for the evaluation of tumor extent involving the surrounding tissues such as the base of the tongue, mandible, and pharyngeal walls. However, streak artifacts from dental fillings, x-ray beam hardening, and movement artifacts limit the accuracy of CT scans for the evaluation of primary tumors of the oral cavity. Therefore, important slices may not be interpretable (17,18). Difficulties with the use of MRI scans for the evaluation of oral cancers also exist; however, MR images, compared with CT images, provide superior information about the soft-tissue differences. Ferromagnetic dental fillings and swallowing or other movements may cause difficulty with the interpretation of images (4,5).
As for the relatively small lesions in the oral cavity, manual palpation can be used to delineate the gross margins and thickness of the tumors (19). However, this approach has limited accuracy. Even under general anesthesia, intraoperative palpation and visualization of tumor margins is sometimes uncertain because of a tendency toward submucosal spreading of the tumor (19).
Intraoral sonography has been used with high accuracy to predict the pathologic tumor thickness in patients with oral tongue cancer (17,19–21), and there may be a role for the use of this procedure in patients with OCC and dental artifacts on the conventional images. However, the following are some limitations with intraoral sonography. This method provides reliable information about tumor thickness and deep margins only in early-stage tongue cancers without posterior extension to the base of tongue or inferior extension to the floor of mouth, in which the application of sonography is difficult or impossible because of the shape and size of the transducer probe or shadowing from the mandible. Therefore, other noninvasive and accurate methods are needed to detect the lesions and determine the tumor extent before treatment planning.
Recently, functional imaging modalities such as 18F-FDG PET or PET/CT have been gaining popularity for the evaluation of various cancers including head and neck cancers (9,22). The glucose metabolic rate or 18F-FDG uptake values on tumor tissues are considered useful prognostic indicators (23). Therefore, treatment planning by PET volume is attempting to delineate functionally active tumors more accurately (24,25). Thus, in OCCs there appear to be significant benefits from the PET volume calculation. In previous studies on dental artifacts with PET (7,14), the artifacts were reported to increase the uptake values of the adjacent tumor tissues in attenuation-corrected PET images. Nevertheless the malignant tissues could be distinguished from the artifacts in the PET scans. Thus, we evaluated whether the metabolic volume of OCCs in the CT-attenuated PET images with dental artifacts could predict the final pathologic tumor volume. This is the first study, to our knowledge, to report on the efficacy of PET/CT in patients with OCC and dental artifacts on the conventional CT or MRI scans.
As expected, the CT-attenuated PET images showed better tumor detection rates than did the CT images alone. In this study, the CT scans were performed using a 3-mm slice thickness, compared with the PET/CT scans, which used a 5-mm slice thickness. Nevertheless, in patients with OCC with dental artifacts, PET/CT gave more information about the primary tumor detection and volume estimation. Comparisons among the CT, MRI, and PET/CT scans showed that PET/CT had the best performance for the identification of primary tumors in the oral cavity. However, because the number of subjects was small, a statistically significant difference was not achieved. Further study with a larger number of patients with OCC and dental artifacts is needed to confirm these findings. Some maneuvers and techniques to improve the visualization of tumor margins in the oral cavity on the CT or MR images have been reported. These include a technique obtaining additional scans through the open mouth and allowing angulation of the CT gantry to change the location of the metallic streak artifact in single-slice CT scanners (26–28). In addition, the use of the puffed-cheek technique (distension technique) and cannula placement in the mouth allows for delineation of OCCs within the buccal vestibule along the buccal or gingival surfaces (28–31). At our institute, these techniques were not used routinely for these patients; however, if we were to use them on CT or MRI scans, the ability of the scans to detect the primary tumors in the oral cavity could certainly improve.
In this study, we determined the tumor areas to be areas with uptake greater than or equal to 2.5, 3.0, and 3.5 SUV on the CT-attenuated PET images (7,14). The tumor margins were delineated automatically according to the thresholds on the Advantage Workstation. Among them, the PET/CT volume (SUV = 3.5) could predict the pathologic volume better than other PET/CT, CT, or MRI volumes. This was the same as in the group without artifacts.
However, our methods did not reflect an accurate tumor margin and volume, and some degree of error in the tumor volume estimation was present, because the abnormal uptake areas included the elevated uptake areas due to the artifact signals in these patients. That is, the materials of the dental prosthesis or dentures may have changed the uptake values of the adjacent tumor tissues. In addition, the proximity of the dental prosthesis or dentures to the tumors may also influence the uptake values of the tumors. Thus, the crude estimation of the tumor volume on the CT-attenuated PET images could be more practical in these subjects. As a result, our estimation of the tumor volume on the CT-attenuated PET images (PET/CTSUV 3.5 volume) correlated with the final pathologic volume. These results suggest that in cases of patients with OCC, where conventional imaging does not provide useful information about the tumor, the tumor volume from PET/CT could preoperatively predict the pathologic tumor volume using our regression equation.
Subsequent analysis according to the subgrouping demonstrated that the PET/CTSUV 3.5 volume and the pathologic volume showed better correlation with larger tumors. Considering that intraoral sonography can provide accurate information about the extent of primary tumors in OCCs, the clinical role of the PET/CT scan in patients with OCC and dental artifacts should be considered for the evaluation of advanced T-stage tumors, where intraoral sonography has limited application.
CONCLUSION
In patients with OCC and dental artifacts on the conventional CT or MRI scans, PET/CT or CT-attenuated PET images can provide useful clinical information about the primary tumors, particularly for the advanced T-stage tumors.
Acknowledgments
This work was supported by the Samsung Medical Center Clinical Research Development Program, grant CRS 107-54-2.
Footnotes
-
COPYRIGHT © 2008 by the Society of Nuclear Medicine, Inc.
References
- Received for publication February 19, 2008.
- Accepted for publication May 9, 2008.


