


Abstract
18F-FDG PET has reached widespread application in the assessment of pulmonary nodules. This study compares the diagnostic accuracy of standard 18F-FDG PET scanning with those of dual time point 18F-FDG PET scanning. Methods: Thirty-six patients (21 women, 15 men; mean age, 67 y; range, 36–88 y) with 38 known or suspected malignant pulmonary nodules underwent PET of the thorax at 2 time points: scan 1 at 70 min (range, 56–110 min) and scan 2 at 123 min (range, 100–163 min) after the intravenous injection of 2.5 MBq 18F-FDG per kilogram of body weight. All scanning was performed on a dedicated C-PET scanner. The mean interval between the scans was 56 min (range, 49–64 min). Regions of interest were overlaid onto each fully corrected image in the areas of the radiographically known lung densities. The standardized uptake values (SUVs) were calculated for both time points. Results: Surgical pathology and follow-up revealed 19 patients with 20 malignant tumors, whereas 16 patients had benign lesions. The tumor SUVs (mean ± SD) were 3.66 ± 1.95 (scan 1) and 4.43 ± 2.43 (scan 2) (20.5% ± 8.1% increase; P < 0.01). Four of 20 malignant tumors had SUVs of <2.5 on scan 1 (range, 1.12–1.69). Benign lesions had SUVs of 1.14 ± 0.64 (scan 1) and 1.11 ± 0.70 (scan 2) (P = not significant). Standard PET scanning (single time point) with a threshold SUV of 2.5 (at time point 1) reached a sensitivity of 80% and a specificity of 94%; dual time point scanning with a threshold value of 10% increase between scan 1 and scan 2 reached a sensitivity of 100% with a specificity of 89%. Conclusion: Dual time point 18F-FDG PET results in a very high sensitivity and specificity for detection of malignant lung tumors.
For the evaluation of pulmonary nodules, 18F-FDG PET has reached widespread application. Kubota et al. (1) first described the value of this modality for the differentiation between benign and malignant solitary lung lesions. Subsequently, several other investigators (2–8) have confirmed the value of 18F-FDG PET for patients with solitary pulmonary nodules, reporting sensitivity values between 83% and 97% with specificity ranging from 69% to 100%.
In general, standardized uptake values (SUVs) of >2.5 appear to be suggestive of malignancy (3,7–9). However, several reports and observations on the day-to-day clinical practice indicate that a significant degree of overlap exists between the uptake values of benign and malignant lesions (4,5,7,8). Whereas some malignant lesions such as bronchioalveolar carcinoma can exhibit low uptake values (9), certain inflammatory lesions, including granulomatous processes, fungal infections, or bacterial infections, can be noted with SUVs of >2.5 (5,10), thereby limiting specificity of this method.
The variation in body habitus, duration of uptake period, plasma glucose levels, and partial-volume effects are important factors that influence the SUV level and have not been considered in a standard manner in the reported literature (11). Changes in these parameters—especially, elevated plasma glucose levels, short uptake periods, and small lesion sizes—will lead to low SUVs in malignant lesions, which lead to assumed low sensitivity for this powerful methodology.
Recently, investigators from the University of Pennsylvania reported the initial results of dual time point imaging in animal models (12) and in patient studies (12,13). Hustinx et al. (13) performed dual time point scanning on 21 patients with 18 head and neck malignant tumors and 9 inflammatory or infectious lesions. The authors noted that tumors had an average SUV increase of 12% between the first and second scan, whereas inflammatory lesions and structures with physiologic uptake of 18F-FDG (tongue, larynx) showed essentially stable uptake over time or a slight decline. Another important finding was that the SUV changes in tumors were larger when >30 min had elapsed between the first and second emission scans.
The purpose of this study was to determine whether obtaining 2 sequential emission scans on patients with pulmonary nodules, to measure the uptake values (SUVs) in the lesions, can result in accuracy of the test in separating benign from malignant lesions.
MATERIALS AND METHODS
Thirty-six patients (21 women, 15 men; mean age, 67 y; range, 36–88 y) with known or suspected malignant lung densities, who were referred for routine 18F-FDG PET scanning, were examined twice: initial whole-body imaging followed by a second scan of the chest. All scans were obtained on a dedicated whole-body C-PET scanner (ADAC Laboratories, Milpitas, CA). Informed consent was obtained from all patients. At the time of 18F-FDG injection all patients had fasted for at least 6 h and had blood sugar levels of <140 mg/dL.
18F-FDG was synthesized using the method described by Hamacher et al. (14). Image acquisition for the whole-body scan started at a mean time point of 69 min (range, 55–110 min) after injection of 2.52 MBq/kg of body weight. This first scan (scan 1) started on all patients at the shoulders and included thorax, abdomen, and pelvis. It consisted of 4 or 5 emission frames of 25.6-cm length with an overlap of 12.8 cm covering an axial length of 64–76.8 cm. After an interval of 56 min (range, 49–64 min), a second emission scan of the thorax only (scan 2) was acquired on all patients at a mean time of 122 min after tracer injection (range, 100–163 min). Starting at the same position as scan 1, it covered an axial length of 25.6–38.4 cm (1 or 2 frames). A transmission scan was obtained with both sets of images for attenuation correction. Image reconstruction was performed with an iterative ordered-subsets expectation maximization algorithm with 4 iterations and 8 subsets (15). Attenuation-corrected images were obtained by applying transmission maps, which were acquired after 18F-FDG injection with a 137Cs source interleaved with the emissions scans (16,17).
Regions of interest (ROIs) were overlaid onto the fully corrected PET images of scans 1 and 2 in the area of the known radiographic lung density. This was achieved by direct visual assessment of the lesion position on the CT scan and subsequent identification of the corresponding area on PET scans 1 and 2.
The margins of these ROIs were placed at approximately 50% of the maximal counts of the highest lesion counting density. The ROI was then transferred to the other scan of the same patient. In tumor lesions that extended over several slices in the craniocaudal direction, the ROI was placed in the midportion of the lesion where the maximal counts were measured. If no discernible uptake was present on either PET scan, ROIs were drawn in the presumed location that corresponded best with that of the radiographic density. Because the patients did not have to leave the scanning table between the end of the first and the beginning of the second emission scan, only minimal correction was required in a few cases because of patient motion.
The SUV was calculated according to the following standard formula (3):
 .
.
The presence of malignancy was proven by obtaining a biopsy or by resecting the lesion in 19 patients. In 1 patient with clinical and radiographic findings highly suggestive of a malignancy, no tissue diagnosis was established. In addition, this patient responded favorably to radiation therapy, which further enhanced the presumed diagnosis. The lack of a malignant process was established in 2 of 18 patients by resecting the lesion. In the remaining 16 patients, stability (or resolution in 1 patient) of the lesion on radiographic examination over an extended period of time (18–26 mo) was considered as evidence for a benign process.
RESULTS
The patient characteristics and scan results for malignant lesions are shown in Table 1, whereas the data for patients with biopsy-proven benign or highly likely benign lesions are summarized in Table 2. Thirty-eight lesions were evaluated because 2 patients had 2 lesions each with focal 18F-FDG uptake (lesions 5 and 6 and lesions 37 and 38).
Patients with Malignant Lesions
Patients with Benign Lesions
The average SUV in malignant tumors (mean ± SD) was 3.66 ± 1.95 on scan 1 and 4.43 ± 2.43 on scan 2. The change in SUV for this group of patients was 20.5% ± 8.1% (P < 0.01), indicating a significant increase in SUV between the 2 time points for the entire study population. In contrast, the uptake values for the benign lesions were 1.14 ± 0.64 on scan 1 and 1.11 ± 0.70 on scan 2 (P = not significant), suggesting that SUVs for benign lesions between the first and second emission scans predominantly remained constant or declined. Four of 20 malignant lesions had uptake values of <2.5 (range, 1.12–1.69), whereas 2 of 18 nodules categorized as benign revealed SUVs of ≥2.5.
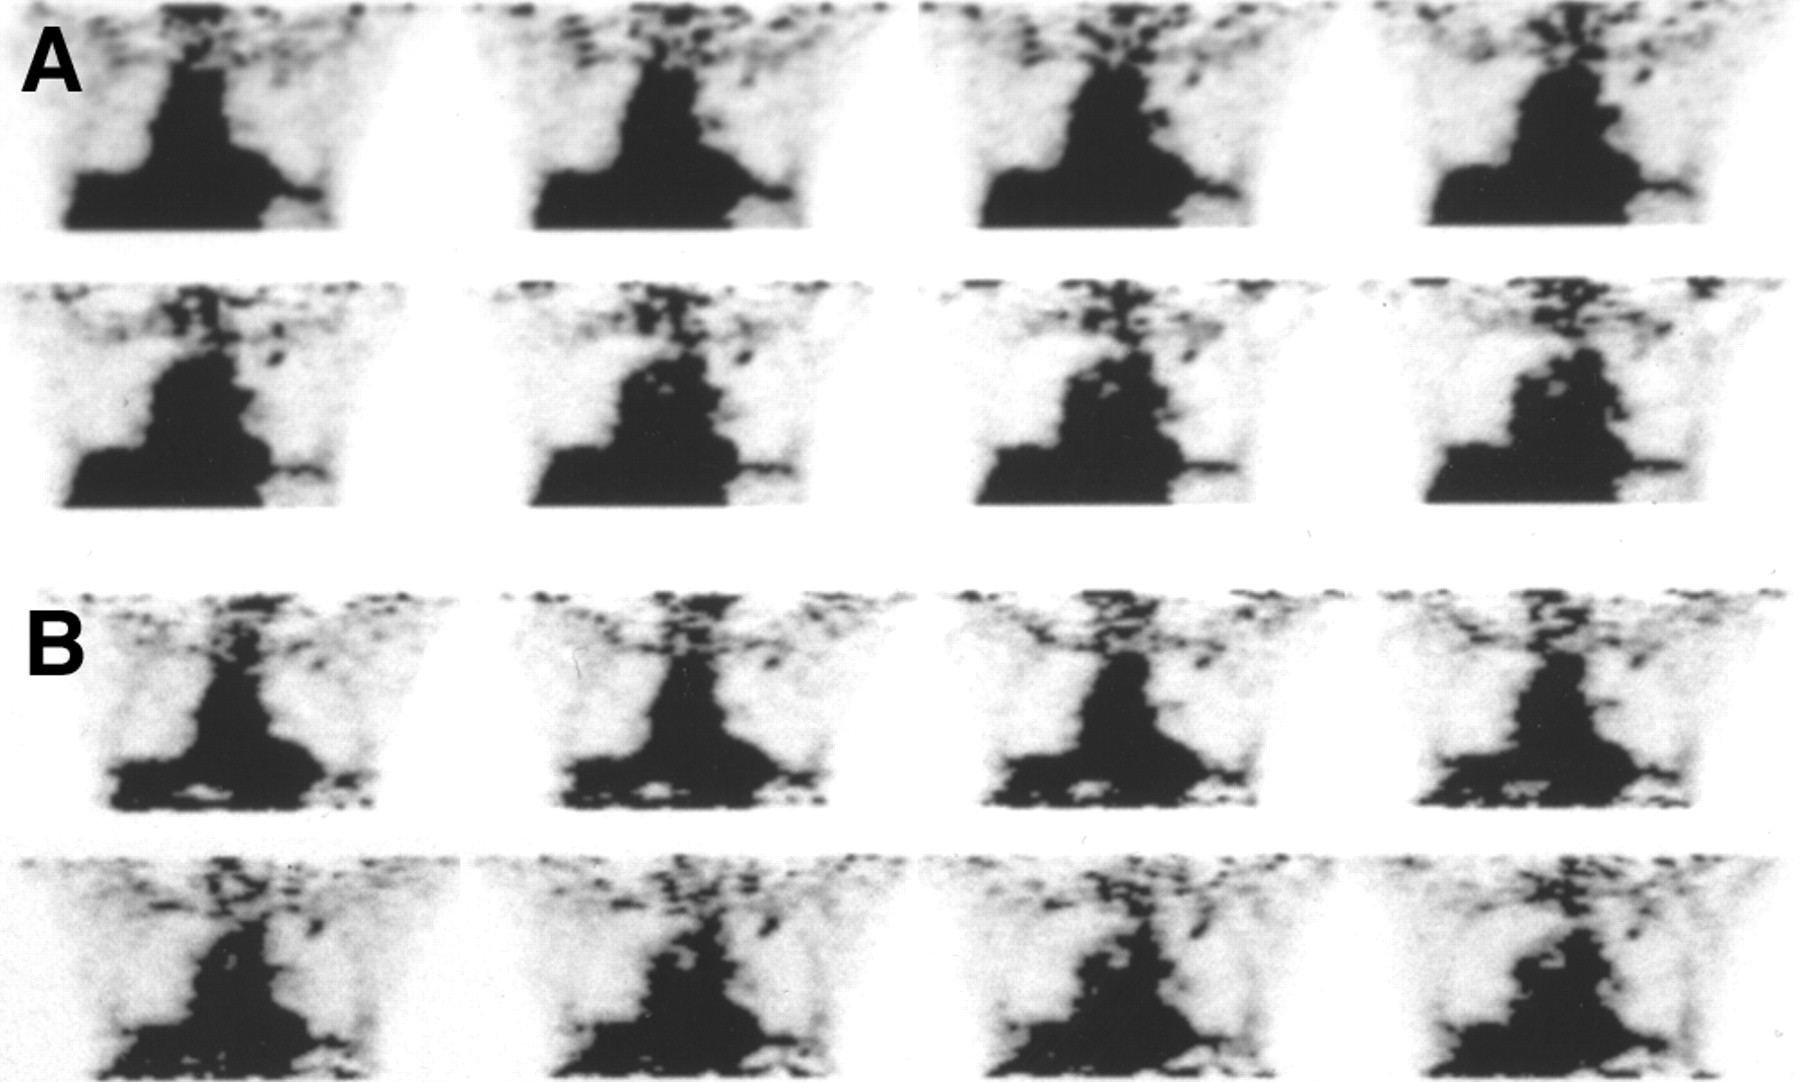
Figure 1 shows a 1.8 × 1.0 cm lesion in the right lower lobe (lesion 9). The SUV was 1.45 on scan 1 and 1.72 on scan 2. The uptake increased by 18.6% between the scans. Biopsy of this lesion revealed a moderately differentiated adenocarcinoma. Figure 2 shows the images of lesion 29. This patient had a 0.8-cm density in the left upper lobe. SUV measurements were 1.54 (scan 1) and 1.50 (scan 2), a minor decrease of 2.6%. The thoracic surgeon elected to resect the nodule, which revealed a benign granuloma.
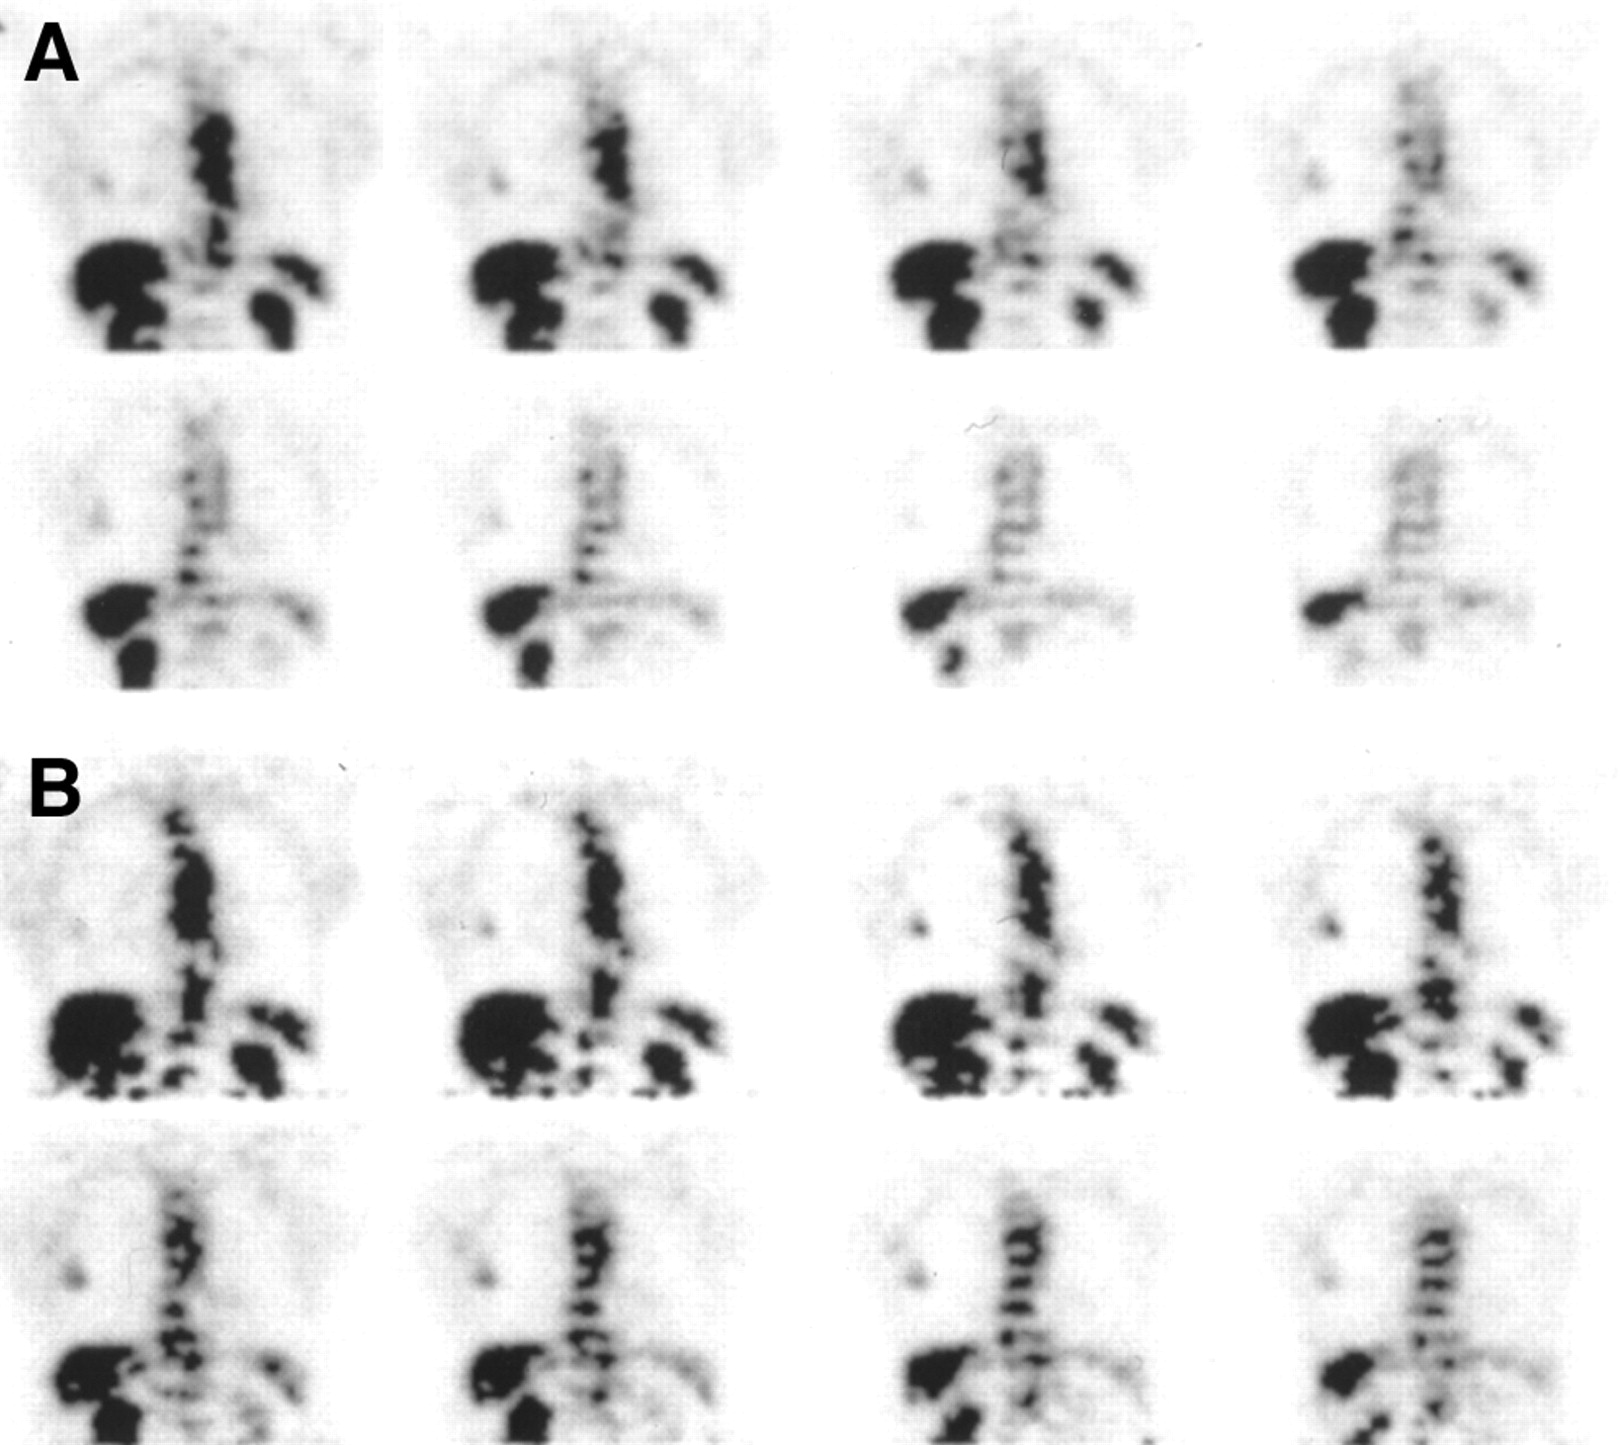
A 72-y-old woman presented with right lower lobe nodule measuring 1.8 × 1.0 cm. SUV increased from 1.45 on scan 1 at 65 min after injection (A) to 1.72 on scan 2 at 123 min after injection (B). Biopsy of lesion revealed moderately differentiated adenocarcinoma.

A 69-y-old woman presented with 0.8-cm density in left upper lobe. SUV was not significantly different between scan 1 at 54 min after injection (A), where SUV was 1.54, and scan 2 at 100 min after injection (B), where SUV was 1.50. Excised lesion was granuloma.
When assessing the diagnostic value of the first emission scan by applying an SUV threshold of 2.5 for separating benign from malignant lesions, the sensitivity was 80% and the specificity was 94%. When the same SUV threshold was applied to the data from the second set of scans, the sensitivity remained unchanged, whereas the specificity decreased to 89%.
The SUV increase methods yielded a most accurate result when an SUV threshold of 10% was used. By adopting an SUV increase of >10% between the first and second scans as a criterion for malignancy, all 20 neoplastic lesions were identified correctly and 16 of 18 lesions were diagnosed correctly as being benign. When an SUV increase of >5% was used as the threshold, the sensitivity, specificity, and accuracy were 100%, 61%, and 82%, respectively. When a threshold of 15% was used, the sensitivity, specificity, and accuracy were 60%, 94%, and 76%, respectively. Therefore, the sensitivity for this method was 100% while the specificity and accuracy remained quite high, equaling 89% and 95%, respectively, when a threshold of 10% was used to diagnose a malignant lung nodule.
DISCUSSION
In the last decade 18F-FDG PET scanning has proven to be a valuable tool for the assessment of undetermined pulmonary nodules. In addition to visual assessment of the metabolic activity of the nodules, measurement of the SUV for the semiquantitative assessment of 18F-FDG uptake in pulmonary lesions has proven to assist in differentiating between malignant and benign nodules. Several reports consider it to be a simple and useful tool for this purpose, and most publications conclude that a threshold value of 2.5 is optimal for obtaining a high sensitivity while maintaining a good specificity (1–4,7,8,9).
However, other investigators have found that determination of the SUV suffers from significant limitations. Hamberg et al. (18) showed that the usual scan start times of 45–60 min lead to significant underestimation of the true SUV because, in most tumors, 18F-FDG uptake continues to rise beyond this period and typically does not reach a plateau for several hours. In untreated tumors, 95% of the plateau value was reached at 298 ± 42 min, with a range of 130–500 min. Although the authors found a positive correlation between the glucose metabolic rate and the SUV, the value was only R2 = 0.65, indicating a considerable margin of error.
Lodge et al. (19) came to a similar conclusion in a study of 29 patients with various benign and malignant soft-tissue masses. High-grade sarcomas reached the maximal 18F-FDG uptake at 4 h, whereas uptake in benign lesions reached its maximal value within 30 min. In this study, the diagnostic value of Patlak or nonlinear regression analysis was not superior to SUV measurements at 4 h. The authors believed that 1 possible explanation might be the poor counting statistics and increased noise several hours after 18F-FDG injection.
These results are in contrast to a study by Lowe et al. (20), who assessed the change in SUV over time in a cohort of 14 patients with pulmonary abnormalities (10 malignant, 4 benign). On the basis of measurement of the signal-to-noise ratio, the best separation between benign and malignant lesions occurred at 50 min after injection and no improvement was seen at later time points.
In view of the encouraging results by Hustinx et al. (13), who acquired scans at 2 time points for head and neck tumors, we adopted this study approach for the evaluation of pulmonary nodules. The percentage SUV change between the first and second scans with a threshold of 10% increase in measured values provided a higher sensitivity (100% vs. 80%), while maintaining an excellent specificity (89% vs. 94%), than that obtained from a single image acquisition using the usual SUV threshold method.
The results of this study for the sensitivity and specificity measures by adopting the SUV threshold of 2.5 are similar to those published in the literature (1–8). However, there was a clear benefit of calculating the percentage SUV change between the 2 scans compared with the SUV threshold alone. Four neoplastic lesions of 1.5- to 2.0-cm maximal diameter showed relatively low uptake values on scans 1 and 2 but showed a considerable increase in the SUV between these 2 scans. None of these lesions was of a histologic type that is known to frequently exhibit low-uptake values, such as bronchioalveolar carcinoma. The SUV measurements of these 4 relatively small lesions could be underestimated because of volume averaging (10). There was a marked percentage increase in SUV in these 4 lesions (mean, 19.5%), which was not significantly different from that of the entire group of malignant lesions. One explanation for this phenomenon is that, at the time of the second emission scan (approximately 2 h), the peak 18F-FDG concentration is not reached in most malignant lesions. On the basis of the results of Hamberg et al. (18) and Lodge et al. (19), the likely mechanism appears to be that most neoplasms continue to accumulate 18F-FDG for several hours after injection.
The results of this study and those of other reports (18,19) provide an argument for adopting an extended scanning protocol, which involves imaging the pulmonary nodules at 2 time points. In particular, small- and medium-sized lesions, which may not be detected because of the limited resolution of the technique or relatively low glucose utilization (secondary to a low rate of cell division), could be identified as malignant on the basis of an increased SUV over time.
Although there was no difference between the standard SUV threshold and the percentage SUV change method for identifying benign lesions in this study, the latter method may prove advantageous when uptake values are close to the threshold of 2.5. Acquiring a second scan that reveals stable or declining uptake values suggests a benign lesion and reduces the need for surgical exploration in such indeterminate cases.
Two lesions (lesions 28 and 35) with a high likelihood of benign etiology showed increases of >10% of their SUVs (12.7% and 29.3%) over time. The patient with significant increase continues to show no evidence of malignant features in her lung lesion. Because of the patient’s general medical condition and the stability of the lesion, no biopsy has been obtained so far to clarify the etiology of the lesion. Given the generally very low uptake values of either of these 2 lesions, we conclude that the application of the threshold technique probably has no value in lesions with SUV of <1.0.
The limitation of our study is the small number of patients. This study did not include any bronchioalveolar carcinoma, which sometimes does not show any increased 18F-FDG activity. This study included only 18 benign lung nodules with 2 false-positive results. Some benign granulomatous lesions, such as sarcoidosis, aspergillosis, and coccidiomycosis, have been reported to be 18F-FDG avid and to show increasing uptake over time (20,21), resulting in false-positive studies. Thus, patients with granulomatous disease or bronchioalveolar carcinoma are the main causes of false-positive and false-negative studies.
Finally, if one should make a final interpretation of the study solely on the basis of the change in the SUV, rigorous attention to technique is paramount for the evaluation of pulmonary nodules. A change of 10% between the early and late images is very small when the SUV is small, and any patient’s motion between the 2 scans can significantly affect and falsify the result. The change in the SUV is also dependent of the reproducibility of the ROI between both scans.
On the basis of the data reported in this article, the dual time point scan protocol is relatively simple and is practical in the setting of a clinical PET center.
CONCLUSION
Our results indicate that dual time point 18F-FDG PET scanning can improve the sensitivity and possibly also the specificity in the evaluation of pulmonary nodules, especially in small- to medium-sized lesions. Further studies are needed to confirm these preliminary results and improve the statistical accuracy.
Acknowledgments
The authors acknowledge the late Robin Smith, PhD, for his significant scientific contributions and for generation and analysis of the data from this study.
Footnotes
Received Sep. 14, 2001; revision accepted Mar. 12, 2002.
For correspondence or reprints contact: Abass Alavi, MD, Division of Nuclear Medicine, Hospital of the University of Pennsylvania, 110 Donner Building, 3400 Spruce St., Philadelphia, PA 19104.
E-mail: alavi{at}oasis.rad.upenn.edu
REFERENCES
In this issue


Jump to section
Related Articles
Cited By...
- PET/CT in nononcological lung diseases: current applications and future perspectives
- British Thoracic Society guidelines for the investigation and management of pulmonary nodules: accredited by NICE
- Qualitative and Quantitative Comparison of PET/CT and PET/MR Imaging in Clinical Practice
- The value of dual-time-point 18F-FDG PET/CT for identifying axillary lymph node metastasis in breast cancer patients
- Voxel-Based Analysis of Dual-Time-Point 18F-FDG PET Images for Brain Tumor Identification and Delineation
- Evaluation of Dual-Time-Point 18F-FDG PET for Staging in Patients with Lung Cancer
- Time and Again, Children Resemble Their Parents
- Dual Time Point 18F-FDG PET Imaging Detects Breast Cancer with High Sensitivity and Correlates Well with Histologic Subtypes
- 18F-FDG PET After Radiofrequency Ablation: Is Timing Everything?
- Dual-Time-Point 18F-FDG PET for the Evaluation of Gallbladder Carcinoma
- PET Evaluation of Lung Cancer
- Potential of Dual-Time-Point Imaging to Improve Breast Cancer Diagnosis with 18F-FDG PET
- Comparison of Different Methods for Delineation of 18F-FDG PET-Positive Tissue for Target Volume Definition in Radiotherapy of Patients with Non-Small Cell Lung Cancer
- Detection of Klatskin's Tumor in Extrahepatic Bile Duct Strictures Using Delayed 18F-FDG PET/CT: Preliminary Results for 22 Patient Studies
- 18F-FDG PET of Gliomas at Delayed Intervals: Improved Distinction Between Tumor and Normal Gray Matter
- Shortened PET Data Acquisition Protocol for the Quantification of 18F-FDG Kinetics
- Metabolic significance of the pattern, intensity and kinetics of 18F-FDG uptake in malignant pleural mesothelioma
- Delayed 18F-FDG PET for Detection of Paraaortic Lymph Node Metastases in Cervical Cancer Patients
- Value of Dual-Phase 2-Fluoro-2-Deoxy-D-Glucose Positron Emission Tomography in Cervical Cancer
- SUV Varies with Time After Injection in 18F-FDG PET of Breast Cancer: Characterization and Method to Adjust for Time Differences
- 18F-FDG Accumulation with PET for Differentiation Between Benign and Malignant Lesions in the Thorax