


Abstract
We have investigated dual-time-point 18F-FDG PET for the detection and delineation of high-grade brain tumors using quantitative criteria applied on a voxel basis. Methods: Twenty-five patients with suspected high-grade brain tumors and inconclusive MRI findings underwent 11C-methionine PET and dual-time-point 18F-FDG PET. Images from each subject were registered and spatially normalized. Parametric maps of standardized uptake value (SUV) and tumor–to–normal gray matter (TN) ratio for each PET image were obtained. Tumor diagnosis was evaluated according to 4 criteria comparing standard and delayed 18F-FDG PET images: any SUV increase, SUV increase greater than 10%, any TN increase, and TN increase greater than 10%. Voxel-based analysis sensitivity was assessed using 11C-methionine as a reference and compared with visual and volume-of-interest analysis for dual-time-point PET images. Additionally, volumetric assessment of the tumor extent that fulfills each criterion was compared with the volume defined for 11C-methionine PET. Results: The greatest sensitivity for tumor identification was obtained with any increase of TN ratio (100%), followed by a TN increase greater than 10% (96%), any SUV increase (80%), and an SUV increase greater than 10% (60%). These values were superior to visual analysis of standard 18F-FDG (sensitivity, 40%) and delayed 18F-FDG PET (sensitivity, 52%). Volume-of-interest analysis of dual-time-point PET reached a sensitivity of only 64% using the TN increase criterion. Regarding volumetry, voxel-based analysis with the TN ratio increase as a criterion, compared with 11C-methionine PET, detected 55.4% of the tumor volume, with the other criteria detecting volumes lower than 20%. Nevertheless, volume detection presented great variability, being better for metastasis (78%) and glioblastomas (56%) than for anaplastic tumors (12%). A positive correlation was observed between the volume detected and the time of acquisition of the delayed PET image (r = 0.66, P < 0.001), showing volumes greater than 75% when the delayed image was obtained at least 6 h after 18F-FDG injection. Conclusion: Compared with standard 18F-FDG PET studies, quantitative dual-time-point 18F-FDG PET can improve sensitivity for the identification and volume delineation of high-grade brain tumors.
PET with 18F-FDG has become an essential imaging modality in oncology for diagnosing, staging, and predicting prognosis (1). However, the utility of 18F-FDG in neurooncology is limited because of the high rate of physiologic glucose metabolism in normal brain tissue. Besides, low-grade tumors present lower uptake than normal gray matter (2). For this reason, tracers such as 11C-methionine (3), which present a high tumor–to–normal brain contrast, play an important role in improving diagnostic procedures.
Furthermore, PET has been introduced as an important tool in the definition of the tumor extent for therapy planning (4). In this field, amino acid tracers are also more appropriate than 18F-FDG because they show a selective uptake in brain tumor (1), being even more precise than other conventional image modalities such as MRI. Nonetheless, the use of amino acid tracers is not comprehensive and remains restricted to centers with an on-site cyclotron or with a high-level production laboratory.
Dual-time-point 18F-FDG PET has significantly improved the diagnostic sensitivity and specificity for head and neck cancers, breast cancer, malignant lung lesions, and some others (5). Spence et al. (6) have introduced this methodology in neurooncology and have studied delayed images visually and quantitatively using volumes of interest (VOIs). They investigated the behavior of model-derived kinetic rate constants over time and concluded that 18F-FDG is dephosphorylated faster from normal tissue than from tumor, improving image contrast.
The aim of this study was to evaluate the utility of dual-time-point 18F-FDG PET studies for the identification and delineation of brain tumors using several quantitative criteria applied on a voxel basis.
MATERIALS AND METHODS
Patients
Twenty-five patients (17 men and 8 women), with a median age of 48.5 y (range, 10–73 y) and with suspected high-grade brain tumors, were included consecutively in this study (Table 1). They were referred to our PET facility after inconclusive MRI findings either for initial diagnosis (n = 7), evaluation of residual tumor (n = 2), or recurrence (n = 16) after treatment (0.5–34 mo since the last treatment). This population was investigated with 11C-methionine and 18F-FDG PET. A positive 11C-methionine PET finding was considered an inclusion criterion for proceeding with the acquisition of the delayed 18F-FDG PET image. This protocol was approved by the Research Ethics Committee of Clínica Universidad de Navarra, and informed consent was obtained from each patient.
Demographic and Clinical Data of All Patients
Histologic diagnosis was obtained by open surgery (n = 20) or biopsy (n = 1). In 4 patients with pretreatment histologic characterization, biopsy of the recurrence was not collected for pathologic analysis, but diagnosis was confirmed by clinical and radiologic follow-up. Of the 25 tumors included (Table 1), 13 were glioblastoma, 9 anaplastic glioma (2 oligodendroglioma, 2 oligoastrocytoma, and 5 astrocytoma), and 3 metastatic cancer (1 breast, 1 gastric, and 1 lung).
Imaging Procedure
All patients underwent 11C-methionine PET and 18F-FDG PET scans, usually acquired on the same day (n = 24). Patients were injected intravenously with 18F-FDG (381 ± 69 MBq) and 11C-methionine (605 ± 205 MBq). During the uptake phase of 11C-methionine and the time between 18F-FDG injection and standard PET, patients rested calmly and lay supine, with their eyes closed and with minimum ambient noise. Patients’ activity was not controlled between standard and delayed PET studies, although it was recommended that patients be as relaxed and quiet as possible. Static emission images of the brain were obtained for 20 min, beginning 40 min after 18F-FDG injection and 10 min after 11C-methionine administration. The delayed 18F-FDG scan was obtained at a median time of 5.4 h after tracer injection (range, 2.9–9.4 h). A 5-min transmission scan was acquired after each emission study. PET studies were performed using an ECAT EXACT HR+ tomograph (CTI/Siemens), acquired in 3-dimensional mode and reconstructed by filtered backprojection using a Hanning filter (cutoff frequency, 4.9 mm), with corrections for attenuation, radioactive decay, scatter, and random coincidences. Images were reconstructed on a 128 × 128 × 63 matrix with a voxel size of 2.06 × 2.06 × 2.43 mm.
PET Processing
Delayed 18F-FDG PET and 11C-methionine images were first registered to their corresponding standard 18F-FDG PET image using SPM2 (www.fil.ion.ucl.ac.uk/spm). Then, a standard 18F-FDG PET image of each subject was normalized to our 18F-FDG PET template (SPM2), and the resulting transformation matrix was applied to the previously registered delayed 18F-FDG and 11C-methionine scans.
Each image was transformed in a standardized uptake value (SUV) parametric image, normalizing by injected activity and patient weight. Additionally, the tumor–to–normal gray matter (TN) parametric images were generated by normalizing to mean uptake in the contralateral cortex (lateral temporal and occipital cortex) (7). To standardize normalization, the reference region was obtained from the Automatic Anatomic Labeling map (8). Therefore, 2 parametric maps were created from each PET image, an SUV map and a TN map. Then, for each patient the variation between standard and delayed 18F-FDG PET images was reflected in 2 subtraction maps: subtraction-of-SUV maps (delayed SUV minus standard SUV) and subtraction-of-TN maps (delayed TN minus standard TN) (Supplemental Fig. 1; supplemental materials are available online only at http://jnm.snmjournals.org).
To define the tumor volume for the 11C-methionine PET study, the TN value that better adjusted to tumor contour was visually estimated in each 11C-methionine PET image by a nuclear medicine physician. An automatic algorithm was developed to apply thresholds for the 11C-methionine image and to look for the connected area inside the brain with the highest 11C-methionine uptake, to exclude extracerebral areas such as lachrymal or pituitary glands (Fig. 1).

Tumor delineation for 11C-methionine PET images. (A) Original image. (B) Area selected by thresholding. (C) 11C-methionine tumor area after selection of cluster with highest uptake.
VOI Analysis for Tumor Identification
First, tumors were visually identified on standard and delayed 18F-FDG PET images by an experienced nuclear medicine physician. A PET image was defined as positive for tumor when there was a well-contrasted and clearly hypermetabolic area with respect to normal gray matter.
Afterward, classic characterization using VOIs was performed. For this purpose, VOIs outlined on 11C-methionine PET images, as previously described, were applied to both standard and delayed 18F-FDG images. Tumors were characterized in terms of maximum SUV (SUVmax) and maximum TN index (TNmax). Mean SUV (SUVmean) in contralateral gray matter was evaluated in dual-time-point 18F-FDG PET images.
Four different diagnostic criteria were defined using the variation of SUVmax and TNmax ratio between PET at the first and second time points. These quantitative criteria were defined as follows: any SUV increase, SUV increase greater than 10%, any TN increase, and TN increase greater than 10%. The sensitivity of these criteria applied for VOI data was evaluated.
Voxel-Based Analysis for Tumor Identification
The 4 diagnostic criteria previously described were also evaluated on a voxel basis. To this aim, maps representing voxels that fulfilled each criterion were created by thresholding subtraction of SUV and TN maps. Inside the area that fulfilled the criterion, each subtraction map represented the amount of SUV or TN increase (Supplemental Fig. 1). Each criterion was considered positive for tumor if at least 1 voxel fulfilled the defined condition, and voxel-based sensitivity was evaluated.
Voxel-Based Analysis for Tumor Delineation
The criteria for tumor identification for dual-time-point 18F-FDG images were applied on a voxel basis to create parametric maps of voxels that fulfilled each criterion (Supplemental Fig. 1). Detected tumor extent within 11C-methionine volume was quantified for each criterion. When the tumor was not detected with a specific criterion, delineation was not feasible. Then, detected tumor volume was considered zero but included in the statistics anyway. Results were expressed in terms of percentage with respect to 11C-methionine volume.
Implementation and Statistical Analysis
The analysis steps were integrated in a Matlab algorithm (MathWorks Inc.).
Statistical analyses were performed using SPSS software (SPSS Inc.). All quantitative data (SUV and TN) and the numeric results of the delineation procedure (volumes) were reported as median and range. Normality of the variables was tested by the Shapiro–Wilk method. Student t tests were used to compare normal variables; otherwise, nonparametric tests (Friedman and Mann–Whitney U) were performed. Correlation was calculated using the Pearson correlation test. Statistical significance was assumed at a P value less than 0.05 for all the analyses.
RESULTS
VOI Analysis for Tumor Identification
Visual analysis of standard 18F-FDG PET images showed a sensitivity of 40%; that is, only 10 (3 primary and 7 recurrent tumors) of 25 tumors were clearly contrasted in standard 18F-FDG PET. In delayed 18F-FDG images, tumor contrast was qualitatively enhanced, and the tumor was visually detected in 13 cases (4 primary and 9 recurrent tumors), reaching a sensitivity of 52%.
Regarding VOI analysis, tumor 18F-FDG uptake showed a median SUVmax of 6.2 (range, 4.3–12.1) in standard 18F-FDG PET images and a median of 6.7 (range, 3.9–11.6) in delayed 18F-FDG images (Table 2). Tumor SUVmax increased in 9 of 25 patients, and the increase was greater than 10% in 4 patients. However, variation in SUVmax was nonsignificant (P = 0.21, paired t test) and not related to histologic type of tumor (P = 0.24, Kruskal–Wallis test). TNmax presented a significant increase between standard 18F-FDG PET (median, 1.3; range, 0.9–2.2) and delayed studies (median, 31%; range, 9.9%–128.7%; P < 0.05, paired t test). The increase in tumor TNmax was observed in 16 patients; TNmax increase was greater than 10% in 10 of them (Supplemental Table 1).
VOI Analysis for Dual-Time-Point 18F-FDG PET Images
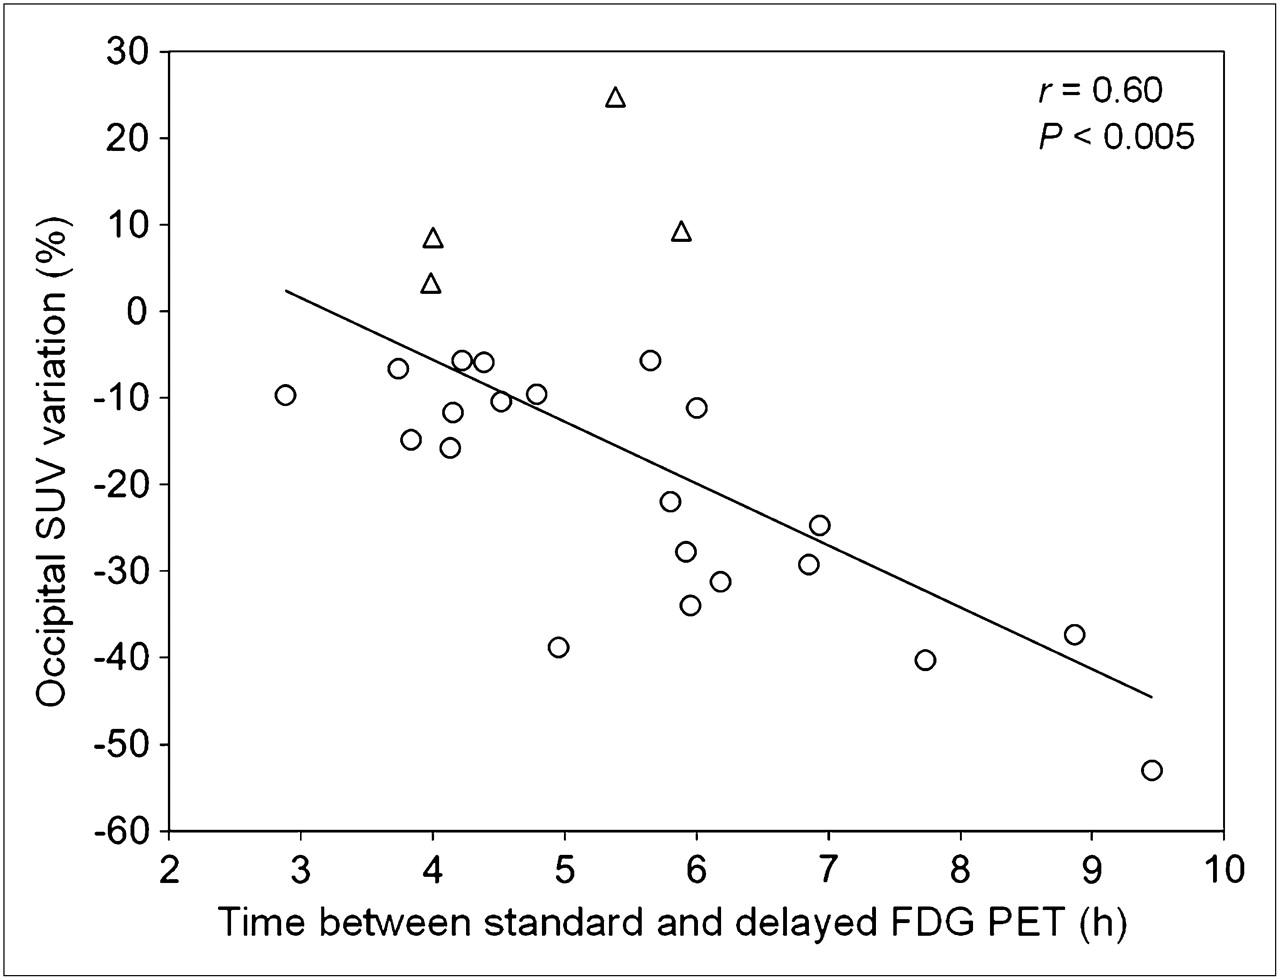
In contrast, median SUVmean in contralateral gray matter in standard 18F-FDG images was 5.3 (range, 3.0–8.3) and presented a significant decrease in delayed 18F-FDG uptake (median change, −11.6%; range, −53.0% to +24.8%; P < 0.05, paired t test). There was a statistically significant correlation among SUVmean decrease in normal cortex and the time elapsed between the two 18F-FDG studies (r = 0.60, P < 0.005, Fig. 2). Data for all patients are detailed in Table 2.

Correlation between normal cortex SUV variation (%) on dual-time-point 18F-FDG PET and time acquisition of delayed images. ○ = patients with SUV decrease; △ = patients with SUV increase.
Voxel-Based Analysis for Tumor Identification
Quantitative criteria were also applied on a voxel basis for dual-time-point images (Table 3). SUV increased in 20 lesions, with a median increase of 23.3% (range, 4.7%–103.2%). Therefore, 20 of 25 lesions were detected (sensitivity, 80%) when an SUV increase was used as a criterion for tumor presence; this criterion was superior to visual inspection of both standard and delayed images for determination of tumor presence. Only 15 tumors were detected when an SUV increase greater than 10% was the criterion. On the other hand, the TN index increased in all tumors (sensitivity, 100%), with a median increase of 31.0% (range, 9.9%–128.7%), making an increase in the TN index the most sensitive criterion for dual-time-point 18F-FDG images. Only 1 tumor (with 9.9% TN increase) was missed using the criterion of a TN increase greater than 10% (Supplemental Table 1).
Voxel-Based Analysis for Dual-Time-Point 18F-FDG PET Images
In this series of tumors, 3 different patterns were found (Fig. 3). A hypermetabolic tumor in standard 18F-FDG PET, with similar or better contrast in delayed images (Fig. 3A), was seen in 10 of 25 patients. A nonhypermetabolic tumor in standard 18F-FDG PET, visually detectable in delayed images (Fig. 3B), was present in 3 patients. In the rest of the patients, the tumor was not visually detected either in standard 18F-FDG or in delayed images (n = 12, Fig. 3C). Nevertheless, quantification with the TN increase criterion revealed the presence of tumor in all cases.
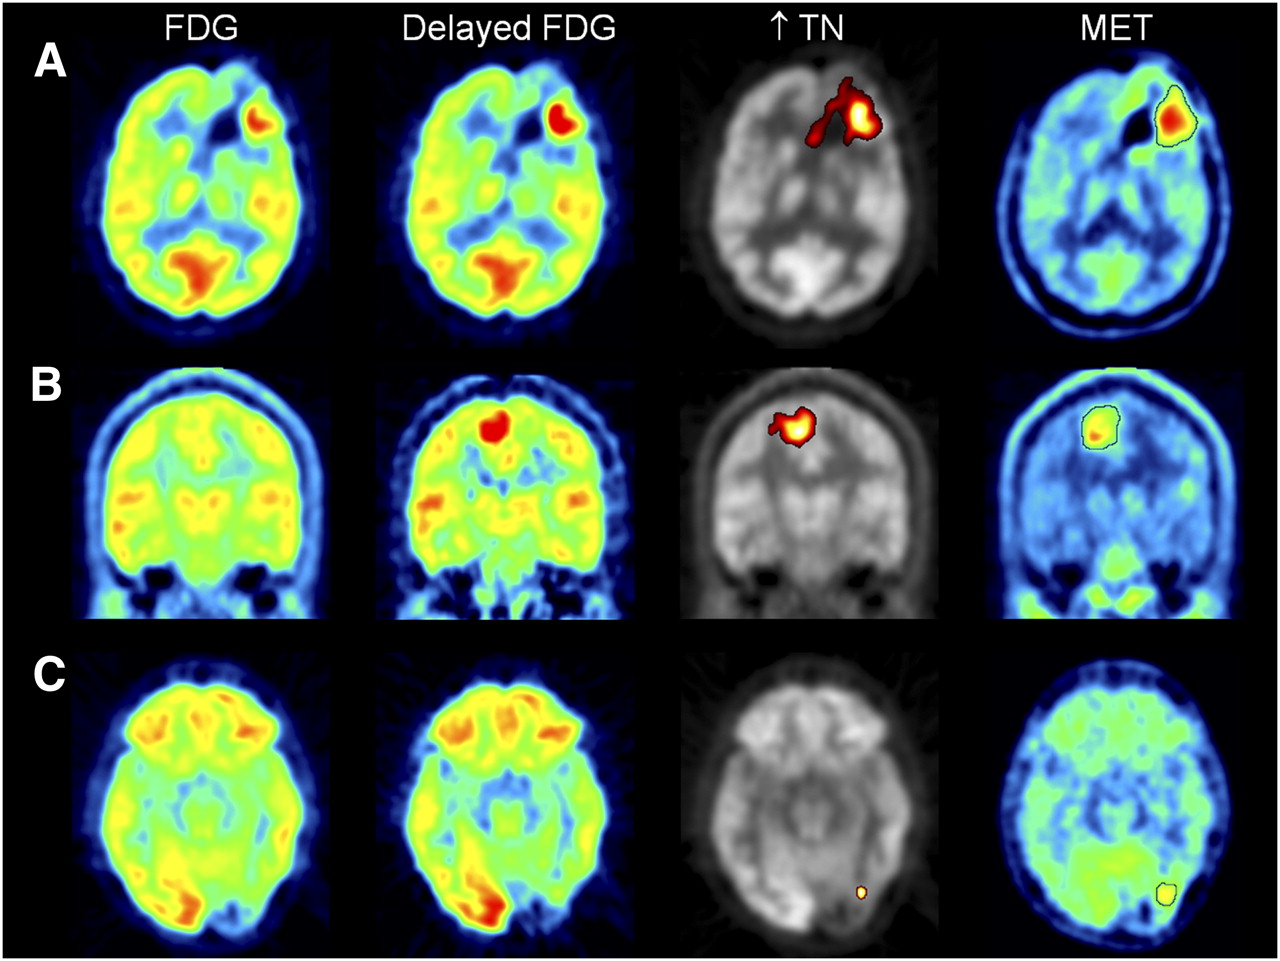
Tumor identification for dual-time-point PET images. (A) Patient with 18F-FDG scan visually positive for tumor. (B) Patient with 18F-FDG scan doubtful for tumor and with improved contrast on delayed 18F-FDG scan. (C) Patient with standard and delayed 18F-FDG images visually negative or doubtful for tumor. Tumor was detected with voxel-based quantification in all 3 cases. MET = 11C-methionine.
Voxel-Based Analysis for Tumor Delineation
The median threshold for tumor delineation for 11C-methionine PET was 1.50 (range, 1.35–2.10), yielding a median tumor volume of 34.9 cm3 (range, 0.4–121.9 cm3).
The median volume detected with the 4 quantitative criteria (SUV increase, SUV increase > 10%, TN increase, and TN increase > 10%) was 10.1%, 0.6%, 55.4%, and 19.4%, respectively, of the total volume defined for 11C-methionine. Tumor volume detected with TN increase was greater than with any other criterion (P < 0.05, Friedman test).
Individual analysis showed that in 84% of patients (21/25 tumors) the increase in TN ratio was the most sensitive criterion for tumor volume delineation (Supplemental Table 2). However, in the other 4 patients (outliers in Fig. 4) SUV criteria detected a greater volume than did TN criteria. In these patients, SUV increased in normal tissue (Fig. 2), and SUV criteria were fulfilled in both tumor and normal brain tissue; these criteria were not useful for tumor delineation.
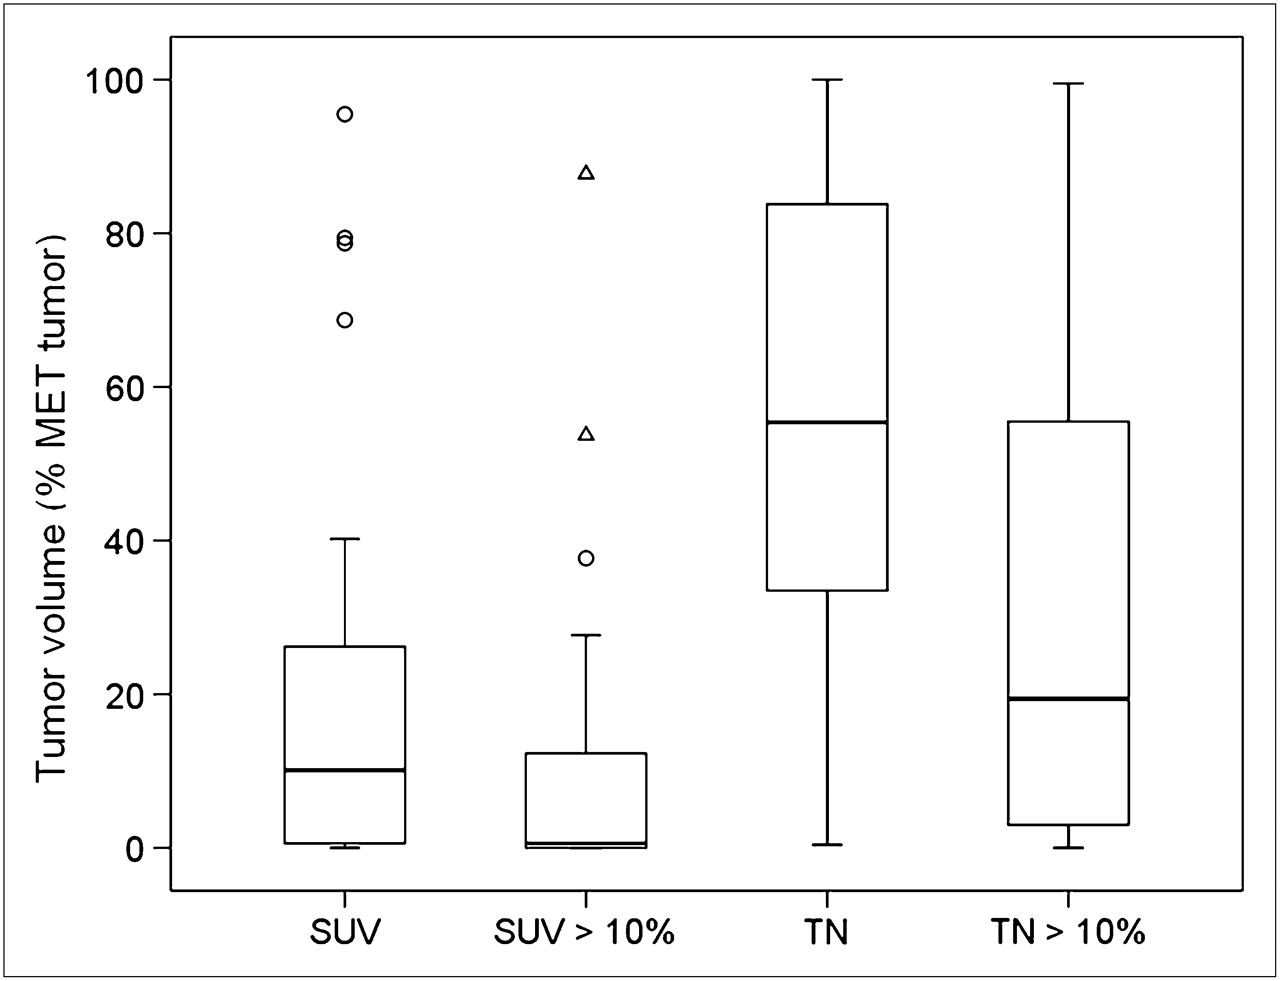
Box plot of volume detected with each delineation criterion, expressed as percentage of tumor volume according to 11C-methionine PET.
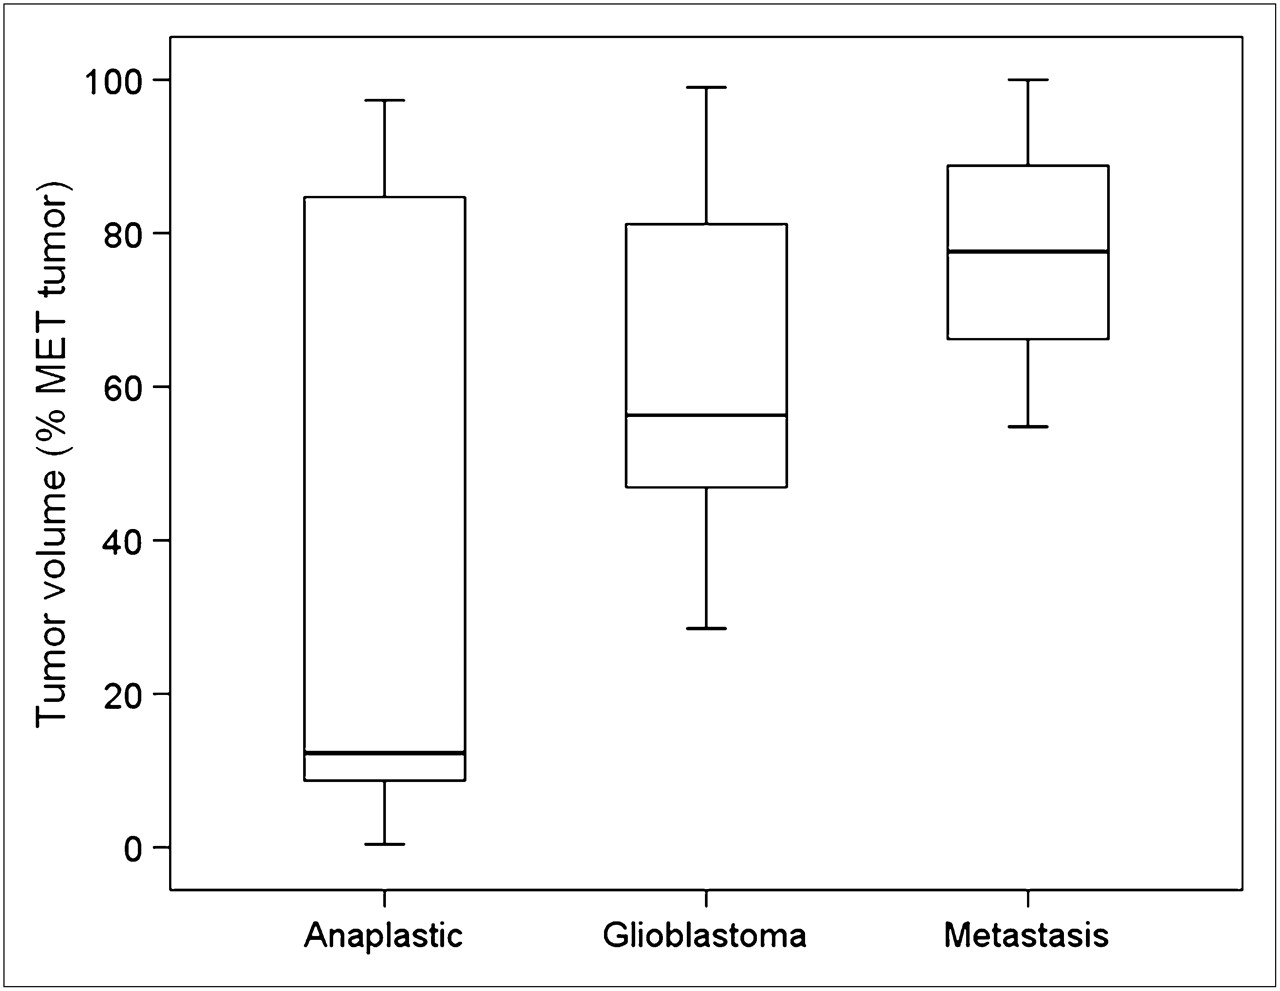
The volume detected using a TN increase as a criterion (median, 55.4%) presented great variability (range, 0.4%–100%). Two factors were analyzed to justify this variability: histologic type of tumor and time of acquisition of the delayed image. According to their histologic classification (Fig. 5), volume detected using the TN ratio criterion was greater for metastasis (median, 77.6%; range, 54.8%–100.0%) than for glioblastomas (median, 56.3%; range, 28.5%–99.0%) and anaplastic tumors (median, 12.3%; range, 0.4%–97.3%). Nevertheless, differences were not statistically significant (P = 0.17, Mann–Whitney U test). On the other hand, a positive correlation was observed between percentage of volume detected with a TN increase criterion and acquisition time of delayed 18F-FDG images (r = 0.66, P < 0.001). In Figure 6, some points that deviated from the straight line were associated with anaplastic tumors. When a delayed 18F-FDG image was obtained 6 or more hours after 18F-FDG injection (28% of patients), the volume detected was greater than 75% of 11C-methionine volume (Fig. 6).

Box plot of tumor volume (expressed as percentage of 11C-methionine volume) detected with TN increase criterion according to type of tumor.

Correlation between tumor volumes detected (expressed as percentage of 11C-methionine volume) and time elapsed between standard and delayed 18F-FDG PET. ○ = nonanaplastic tumor; X = anaplastic tumor.
DISCUSSION
Dual-time-point 18F-FDG images have already been introduced in the study of several types of tumors (9). Delayed PET images are usually analyzed with VOIs, and any increase in SUVmax (10,11) or an increase in SUVmax greater than 10% are considered as criteria for malignancy (12,13). However, diagnostic criteria for dual-time-point 18F-FDG PET images for the evaluation of brain tumors are not standardized.
The aim of our study was to investigate several quantitative criteria based on the variation of SUV and TN ratio between standard and delayed 18F-FDG scans. To the best of our knowledge, this is the first work to quantify dual-time-point images on a voxel basis instead of using VOIs. Voxel-based analysis measures real variations in 18F-FDG uptake between standard and delayed scans of the entire brain and characterizes the behavior of the entire extent of the tumor. Interestingly, the location of the voxel of maximum uptake in a standard 18F-FDG image (voxel 1) did not match the voxel of maximum uptake in the delayed study (voxel 2) in any patient of our series. When analysis is based exclusively on VOIs and SUVmax or TNmax, the variation is computed between 2 different voxels of the tumor (i.e., voxel 1 and voxel 2) and does not represent the real increase in any of these voxels. In our experience, differences based on maximum uptake in a VOI underestimate the actual change between standard and delayed images, and diagnostic sensitivity was proven to be inferior to voxel-based analysis sensitivity (64% vs. 100%; Supplemental Table 1).
Spence et al. (6) have already studied 18F-FDG delayed images for the evaluation of gliomas, using visual and VOI quantitative analysis. They reported a significant increase of tumor SUVmax and TNmax together with an SUV decrease in normal tissue with time. In accordance with these results, we have found a significant TNmax increase in tumor. SUVmax also increased between standard and delayed 18F-FDG PET, but differences did not reach statistical significance. Regarding normal tissue, we have also observed a significant decrease with time. Nevertheless, 4 of 25 patients presented an SUV increase in normal cortex between standard and delayed 18F-FDG PET.
The TN increase criterion was the best diagnostic tool, providing a sensitivity of 100%. The improvement in the sensitivity of voxel-based analysis of dual-time 18F-FDG PET images is clear when compared with visual analysis of standard 18F-FDG (40%) or delayed images (52%) and compared with VOI analysis for dual-time point PET images (64%). Sensitivity improvement with dual-time-point 18F-FDG protocols has already been reported for several types of tumors, such as breast (14) or lung cancer (15) among others, with a sensitivity between 90% and 100%.
Maps representing pixels that fulfill the criteria defined on dual-time-point 18F-FDG images were also evaluated as a tool for delineating brain tumor extent. In general, quantification of dual-time-point 18F-FDG PET improves the tumor delineation potential of standard 18F-FDG. Automatic delineation of the tumor volume for 18F-FDG PET images is feasible only when the tumor is clearly identified and contrasted. In our series of patients, dual-time-point 18F-FDG PET increased tumor detection sensitivity from 40% (visual analysis) to 100% (voxel-based quantification using TN increase) and therefore could allow automatic delineation in more patients than standard 18F-FDG.
Concerning the different criteria, in 84% of patients (21/25 tumors) the increase in TN ratio was the best criterion for tumor volume delineation too. However, the median volume detected was 55.4% of 11C-methionine volume, and the detected volume matched exactly the 11C-methionine volume in only 1 case. Although 11C-methionine PET was considered the gold standard in this work, 18F-FDG and 11C-methionine have different uptake mechanisms into brain tumors (expression of glucose transporters and energy consumption vs. expression or activation of amino acid transporters and protein synthesis (16)), yielding discrepancies between the 2 tracers. In fact, higher 11C-methionine uptake appears in nonanaplastic tumor zones and brain regions with infiltrating neoplastic cells, whereas higher 18F-FDG uptake is observed at tumor areas with necrotic components (17). Pirotte et al. (18) have demonstrated that 11C-methionine uptake is usually more extensive than 18F-FDG uptake. Nevertheless, 11C-methionine images were selected in this study as a reference because they provide more accurate information than 18F-FDG images for evaluating tumors (7,17,19,20) and have already gained a place in therapy planning for delineating tumor volume in combination with MRI (21,22).
Tumor extent identified by dual-time-point 18F-FDG presented great variability between subjects, depending on the type of tumor studied. This work has shown that the performance of delayed image quantification is better for metastases and glioblastomas than for anaplastic gliomas, in which variability reached the highest value. The better performance is because brain metastases are typically well defined solid or partially cystic nodules, whereas gliomas are heterogeneous, with areas of different histologic grades (16), especially anaplastic gliomas that arise from the transformation of low-grade tumors. Spence et al. (6) have already described the visual improvement of tumor delineation of high-grade or progressing low-grade gliomas, but not improvement of stable low-grade tumor definition, using dual-time-point images.
The variability observed in this study regarding the tumor extent identified by dual-time-point 18F-FDG could partially be explained by the time elapsed between standard and delayed images. Our results determined that delayed images have to be obtained at least 6 h after 18F-FDG injection. These results are consistent with those reported by Spence et al. (6).
Voxel-based quantitative analysis for the automatic delineation of tumor extent on dual-time-point 18F-FDG PET images could highlight areas other than the tumor in the subtraction map. Some of these areas seemed like noisy artifacts (Supplemental Fig. 1) that can be discarded by visual inspection. Moreover, in a few patients, some areas such as visual or motor cortex showed a consistent increase. However, the pattern and location of these areas with physiologic 18F-FDG increased uptake differ enough to be recognized and not mistaken for tumors.
A limitation of this study is that only patients with positive 11C-methionine PET findings were included. Therefore, a detailed analysis of sensitivity of each criterion was performed, but specificity could not be addressed. This is a preliminary study that provides encouraging results, and further study with a larger prospective series of patients should be conducted to validate the global diagnostic accuracy of the proposed methodology.
CONCLUSION
This is the first article, to our knowledge, to quantitatively analyze dual-time-point imaging voxelwise. Results demonstrated a significant improvement in sensitivity for brain tumor diagnosis using dual-time-point imaging, compared with standard 18F-FDG. Despite this finding, the methodology was limited for tumor volume delineation, with time interval and type of tumor being revealed as critical factors. This analysis provides encouraging results but requires further study with a larger prospective series of patients.
DISCLOSURE STATEMENT
The costs of publication of this article were defrayed in part by the payment of page charges. Therefore, and solely to indicate this fact, this article is hereby marked “advertisement” in accordance with 18 USC section 1734.
Acknowledgments
This work was supported by the Research Plan of the University of Navarra PIUNA (2010-04).
- © 2011 by Society of Nuclear Medicine
REFERENCES
- Received for publication December 14, 2010.
- Accepted for publication April 11, 2011.


