


Abstract
We hypothesized that delineation of gliomas from gray matter with 18F-FDG PET could be improved by extending the interval between 18F-FDG administration and PET data acquisition. The purposes of this study were, first, to analyze standard and delayed 18F-FDG PET images visually and quantitatively to determine whether definition of tumor improved at later imaging times and, second, to investigate the dynamics of model-derived kinetic rate constants, particularly k4. Methods: Nineteen adult patients with supratentorial gliomas were imaged from 0 to 90 min and once or twice later at 180–480 min after injection. In 15 patients, arterial sampling provided the early input function. Venous sampling provided the remaining curve to the end of the imaging sequence. Standardized uptake value (SUV) was calculated as tissue concentration of tracer per injected tracer dose per body weight. Ratios of tumor SUV relative to the SUV of gray matter, brain (including gray and white matter), or white matter were calculated at each imaging time point. Dynamic image data from tumor, gray matter, brain, or white matter were analyzed using a 2-compartment, 4-parameter model applied for the entire duration of imaging, in which delay, K1, distribution volume, k3, and k4 were optimized using a nonlinear optimization method. Parameter estimation for each region included both an early subset of data from a conventional dynamic imaging period (0–60 min) and the full, extended dataset for each region. Results: In 12 of the 19 patients, visual analysis showed that the delayed images better distinguished the high uptake in tumors relative to uptake in gray matter. SUV comparisons also showed greater uptake in the tumors than in gray matter, brain, or white matter at the delayed times. The estimated k4 values for tumors were not significantly different from those for gray matter in early imaging analysis but were lower (P < 0.01) using the extended-time data. Conclusion: The kinetic parameter results confirm the visual and SUV interpretation that tumor enhancement is greater than enhancement of surrounding brain regions at later imaging times, consistent with a greater effect of FDG-6-phosphate degradation on normal brain relative to glioma.
Both high-grade gliomas and gray-matter structures take up 18F-FDG avidly. Thus, when tumors are in or near gray matter, it may be difficult to distinguish between the two. Several studies have explored the usefulness of delayed or dual-time-point 18F-FDG PET in improving detection of brain metastases (1) and tumors outside the brain (2–6), distinguishing malignant from benign lesions (7–9), distinguishing malignant from inflammatory lesions (10,11), or defining the time for optimal imaging of tumors (12,13). Also, glucose-6-phosphatase activity has been reported to be low in some tumors of experimental animals (14–17). Based on these observations, we hypothesized that delineation of gliomas with 18F-FDG PET could be improved by extending the interval between 18F-FDG administration and PET data acquisition due to slower dephosphorylation of FDG-6-phosphate in tumor relative to gray matter.
MATERIALS AND METHODS
Patients
Nineteen adults were studied, 12 male and 7 female, all with supratentorial gliomas (Table 1). Most of the patients were recruited for metabolic studies at the time the tumors were suspected of progression by clinical or MRI criteria. Five patients had glioblastoma multiforme (4) or gliosarcoma (1), 3 had World Health Organization (WHO) grade III mixed astrocytoma/oligodendroglioma, 3 had WHO III oligodendroglioma, 1 had WHO II mixed glioma, 2 had WHO II astrocytoma, 4 had WHO II oligodendroglioma, and 1 had lesions that had not undergone biopsy but were diagnosed as gliomatosis cerebri from MRI and magnetic resonance spectroscopy results.
Patient Data
The tumors were further categorized as high grade (HG, n = 11), meaning that at the time of 18F-FDG PET they were showing progression by the MRI criterion of increasing volume of gadolinium contrast enhancement; progressing low grade (PLG, n = 5), meaning that at original tissue sampling they were low-grade gliomas histologically but at the time of 18F-FDG PET were showing increasing contrast enhancement on MRI consistent with progression and possible malignant degeneration; or stable low grade (SLG, n = 3), meaning they were suspected of showing progression by clinical or MRI criteria at the time of 18F-FDG PET but by subsequent clinical and imaging follow-up were proven not to be progressing.
This study was approved by the University of Washington Human Subjects Committee for human research. All patients signed informed consent.
Radiopharmaceutical Synthesis
18F-FDG was synthesized by the method of Hamacher et al. (18). The radiochemical and chemical purity of the product was assayed by analytic high-performance liquid chromatography and thin-layer chromatography and was consistently >99% by both assays. The measured specific activity of the 18F-FDG was >740 GBq/mmol at the end of synthesis.
PET Devices and Procedures
The camera was a General Electric Advance whole-body positron emission tomograph providing 35 image planes of data over a 15-cm axial field of view (19–21). The tomograph includes 18 rings of bismuth germanate detectors with 672 crystals per ring. The system sensitivity in 2-dimensional mode (axial septa in place) is 3.65 kcps/MBq/mL. The limiting transaxial resolution is 4.1 mm, with a slice thickness of 4 mm. The maximum counting rate obtainable with a head-sized phantom is more than 2 million coincidence events per second.
Imaging Procedure
Patients fasted for at least 9 h before 18F-FDG PET. Before undergoing PET, all patients underwent MRI without and with gadolinium contrast injections. After head immobilization was secured, patients were positioned in the tomograph. A system of laser beams then allowed advancing the patient into the tomograph to maintain the exact positioning of the head in relation to the rings.
An attenuation scan was obtained with a rotating sector source of 68Ge through the brain and tumor-containing region. While this was under way, an intravenous line was established for isotope injection and a wrist radial artery line was inserted for plasma sampling for the isotope time–activity curve. The arterial line was connected to an automated blood sampler that could be preprogrammed for the desired sampling sequence (22). Before scanning and isotope injection, a blood sample was drawn and the glucose level analyzed by a Beckman Glucose Analyzer II (Table 1). This was repeated multiple times after isotope injection in 16 of the 19 patients.
After completion of the transmission/attenuation scans and placement of the vascular access, acquisition of emission tomograms started 1 min before injection of radioactive tracers. The tomograph was calibrated for MBq/mL by imaging a 10-cm-diameter cylinder of known activity, as determined by a dose calibrator (Capintec), under conditions similar to those of the patient imaging protocol (30-cm field of view, 4-mm Hann filter, and Fourier rebinning, followed by 3-dimensional filtered backprojection reconstruction).
The 18F-FDG (typically 370 MBq) was injected intravenously over 1 min in 10 mL of sterile normal saline. Imaging data were collected and reconstructed in four 20-s, four 40-s, four 60-s, four 180-s, and fourteen 5-min time bins. Three consecutive 5-min bins were collected at each later time point investigated.
Arterial blood was sampled at a frequency similar to that of the dynamic image acquisition until 90 min. The 1-mL blood samples were centrifuged, and then 0.5 mL of plasma was pipetted and counted for total plasma radioactivity using a multichannel γ-counter (Cobra; Packard Corp.). Three 1-mL samples from the calibration cylinder were also obtained for well counting, which allowed us to express sample cpm/mL in terms of MBq/mL in the tomograph.
Image Analysis
Regions of interest (ROIs) in the gliomas were selected to include the contrast-enhancing volume and adjacent nonenhancing tumor defined on MR images. ROIs were drawn from the integrated 18F-FDG images while referencing MR images. Generally, ROIs were placed on the 18F-FDG uptake scans (30–60 min), and cysts and resection cavities were avoided. For tumors that did not show contrast enhancement on T1-weighted gadolinium-enhanced MR images, the region of T2 signal enhancement on MR images was selected conservatively. Contralateral brain regions included either gray or white matter or both, determined as follows. Before each image analysis sequence, T1-weighted axial MR image sets were coregistered to summed 18F-FDG (30–60 min) image sets using a rigid image registration algorithm based on mutual information criteria (23). Brain ROIs were generated on coregistered MR image slices superior to the ventricles and transferred to coordinate 18F-FDG dynamic and static image sets. Typically, a whole-brain ROI extended 4 slices (about 2 cm) and included both gray and white matter in a volume of about 100 mL. Additional ROIs approximately half the size of the whole brain regions over similar slices were constructed for gray and white matter on MR images and transferred to the PET images as described above. All tumor and brain reference region ROIs were greater than 3 times the reconstructed resolution (4 mm) in all dimensions. The model described below used the time–activity curves from these regions expressed as MBq/mL, scaled using the conversion factor obtained from the calibration cylinder described above, and the blood input function in the same units, MBq/mL.
The contralateral brain region or glioma ROI time–activity curves were analyzed by the 2-compartment model shown in Figure 1. The model is that described by Phelps et al. (24) as a modification of the model of Sokoloff et al. for 2-deoxyglucose (25) and further modified by O’Sullivan et al. (26,27). The program incorporating this model used the plasma time–activity curve as the input function. In 15 patients, arterial sampling provided the early input function. Venous sampling provided the remaining curve to the end of the imaging sequence. The tissue data were not decay corrected because the model was formulated to account for radioactive decay. Similarly, plasma data were corrected to the time of sampling, not the time of injection.
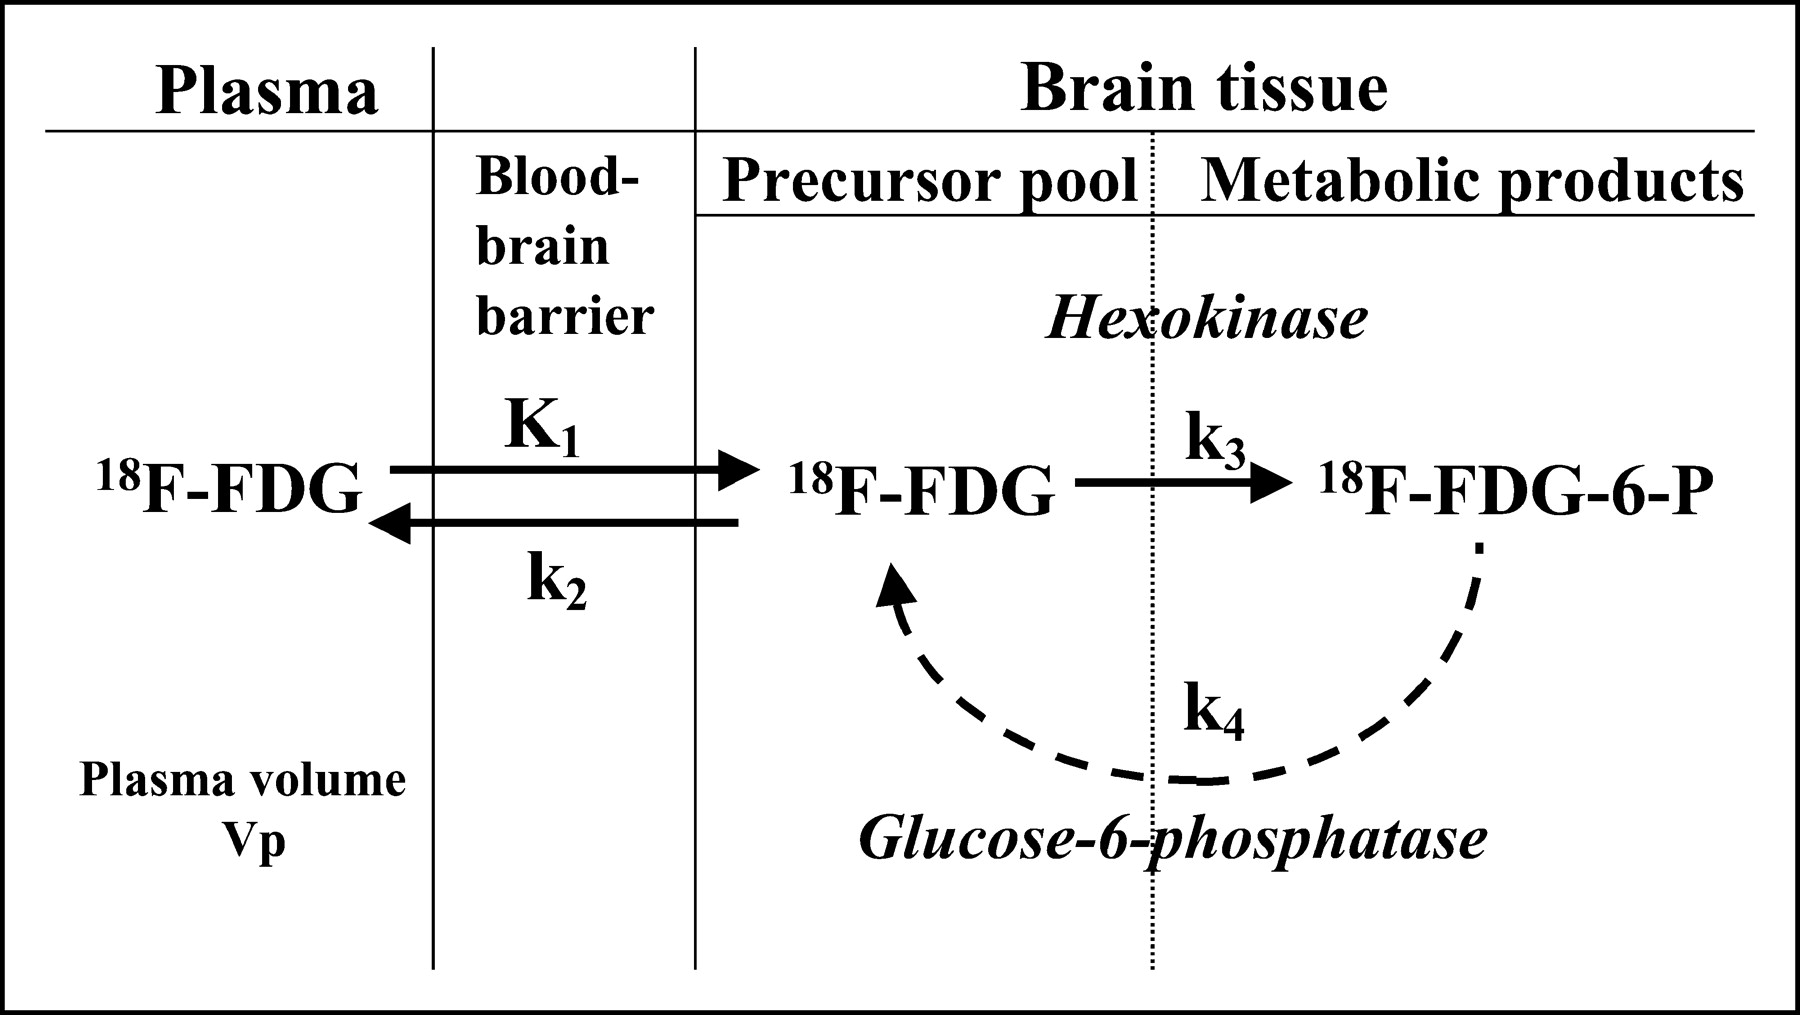
The 18F-FDG metabolism model, showing the compartments and parameters.
The predicted tissue time–activity curves were calculated using numeric integration of the differential equations for each model. There were a total of 6 variable parameters: K1, k2, k3, k4, a delay term to shift the tissue activity relative to the plasma curve for both tracers, and a blood volume term to account for activity in large blood vessels. The “best-fitting” model to a given dataset was achieved using an established nonlinear weighted least-squares algorithm (28). The algorithm minimized the sums of the squares of the differences between the model output and the tissue data, weighted proportionally to the inverse of the variance of the count data. With this optimization program, the rate constants were estimated using a standard imaging duration of 60 min for 18F-FDG for ROI time–activity curves obtained from glioma tissue, contralateral whole brain, gray matter, or white matter. The flux constant was calculated as (K1 × k3)/(k2 + k3).
To assess the difference in parameter estimation for standard imaging (0–60 min) and delayed imaging (up to 8 h after injection), the parameters characterizing the early transport and retention of the standard imaging time were fixed (K1, k2, k3, delay, blood volume) and only k4 was allowed to float during optimization of the entire time series.
Standardized uptake value (SUV) was determined as the ratio of tissue concentration of tracer divided by the injected tracer dose and body weight.
All data were analyzed by a linear mixed-effects model to determine whether there was a discrete time threshold after which further delaying imaging added no further clinically relevant information (29). The intent was to define an optimal delayed time point later than the standard that could be efficiently used clinically and still improve delineation of tumor from normal brain reference regions.
Statistical Analysis
The Student 2-tailed paired t test was used to compare standard versus delayed SUV and k4 values.
RESULTS
In 12 of the 19 patients, by visual analysis, the delayed images showed better delineation of the high uptake of tumors relative to gray matter than was achieved by imaging at standard times of 30–90 min (Figs. 2–5). SUV comparisons also showed greater uptake in the tumors relative to gray matter, whole brain, or white matter at the delayed times (Fig. 6).
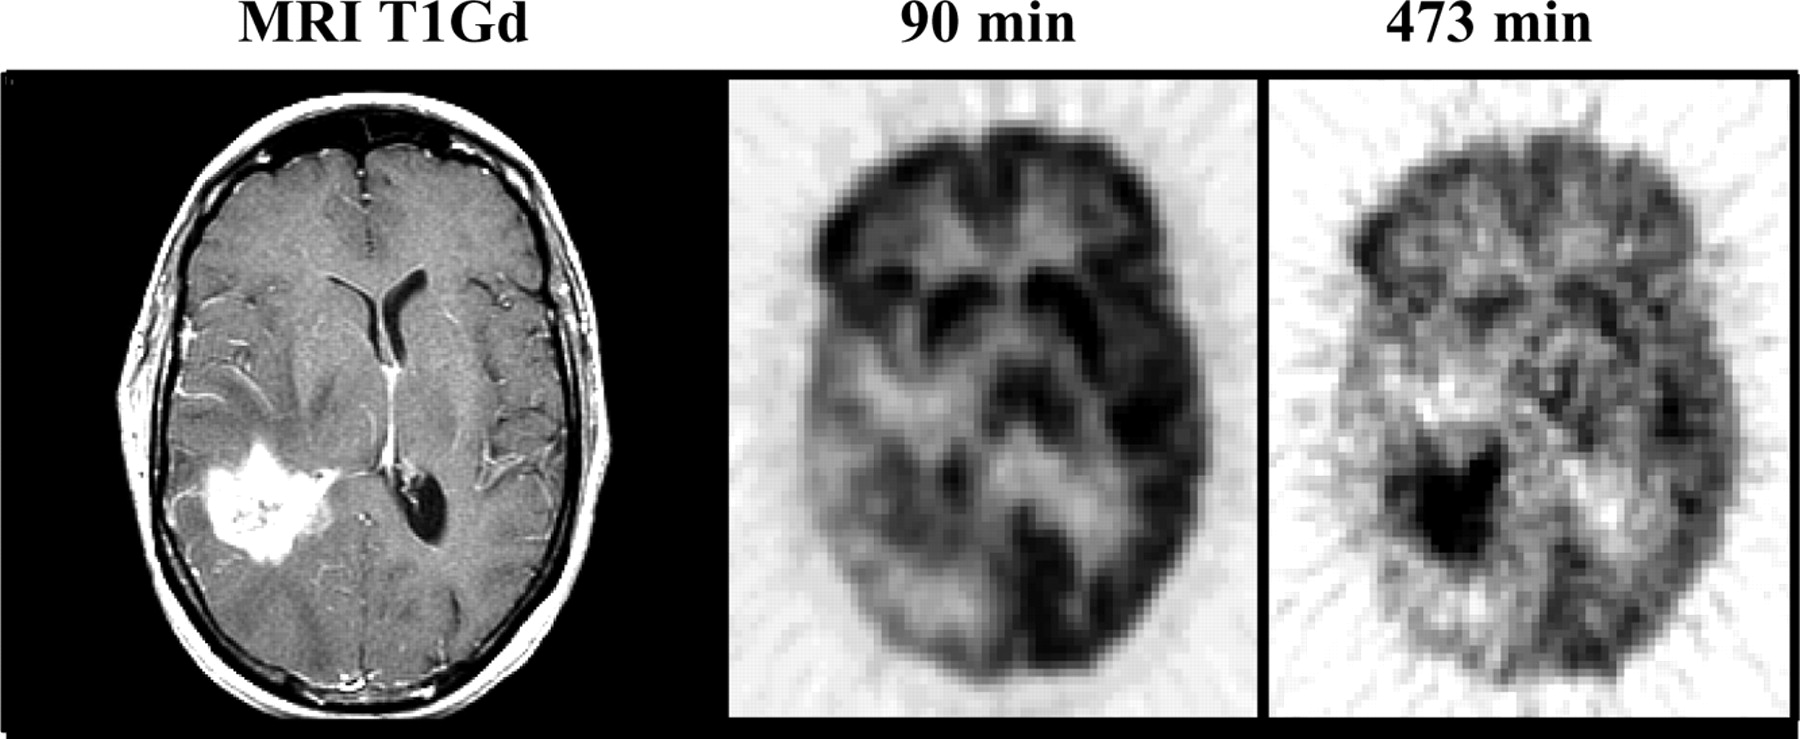
A 45-y-old woman (patient 1, Table 1) with a recurrent right temporal glioblastoma multiforme shown on T1-weighted gadolinium-enhanced (T1Gd) MRI. Note the much more prominent tumor to gray matter (T/G) delineation at the later time point, 473 min, compared to 90 min.

A 38-y-old man (patient 14, Table 1) with a recurrent left temporal astrocytoma. Coregistration of T1Gd MRI planes with the 18F-FDG PET planes and use of delayed imaging made evident that the small focus seen on MRI was tumor rather than radionecrosis, especially at 415 min. Subsequent MRI confirmed rapidly progressing disease.
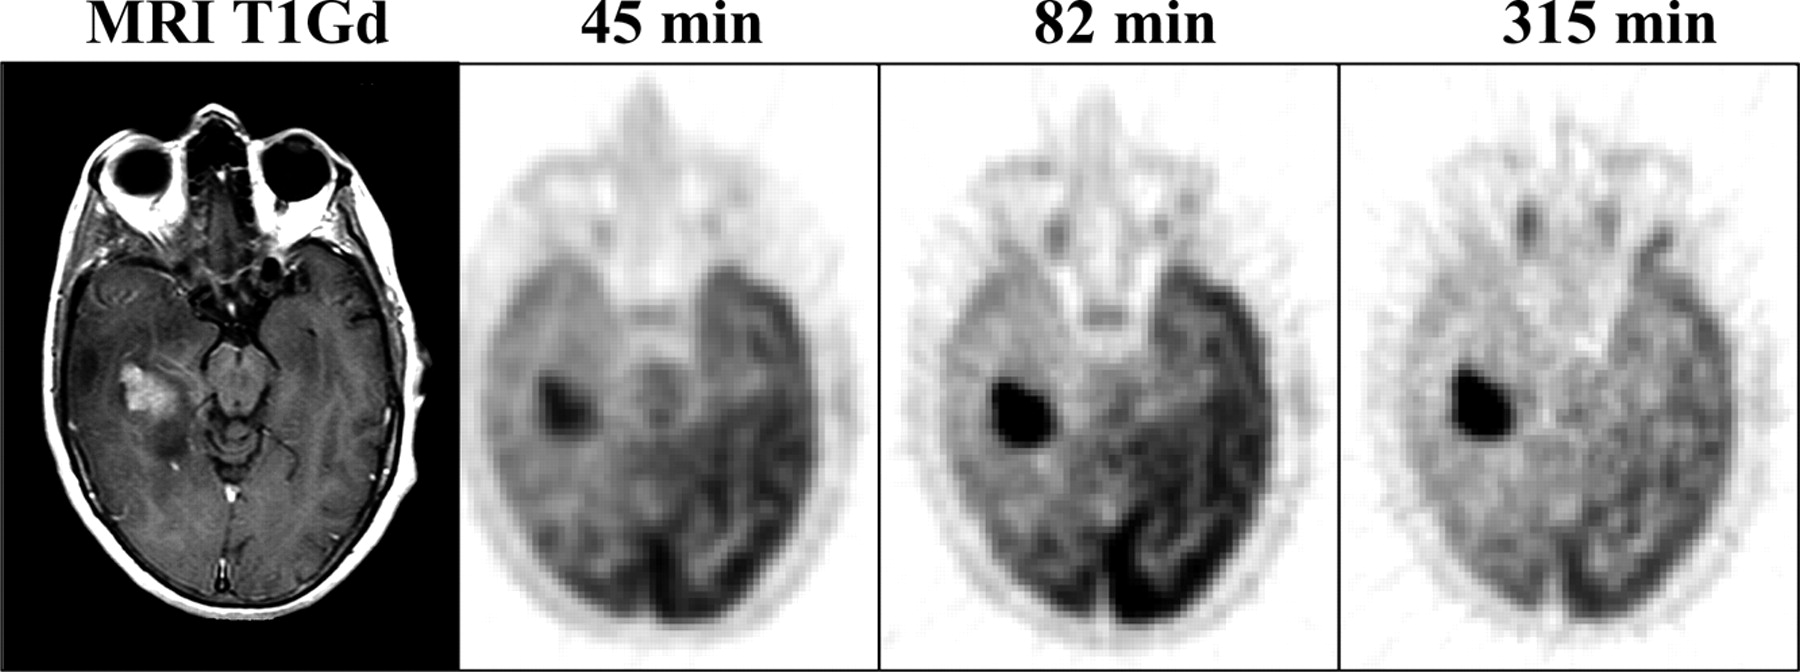
A 59-y-old woman (patient 6, Table 1) with a progressive memory disorder and seizures whose multiple MRI scans demonstrated an extensive intraaxial infiltrating mass predominantly in the right temporal lobe but also involving the splenium of the corpus callosum and contralateral temporal lobe. The initial clinical and radiographic diagnosis was low-grade glioma. She declined treatment. Gadolinium contrast enhancement appeared on T1-weighted MR images 2 y after presentation, at which time she underwent 18F-FDG PET. Autopsy 19 mo after PET showed a mixed glioma, WHO grade III. 18F-FDG uptake was decidedly more prominent at the later times, 82 and 315 min, than at 45 min.
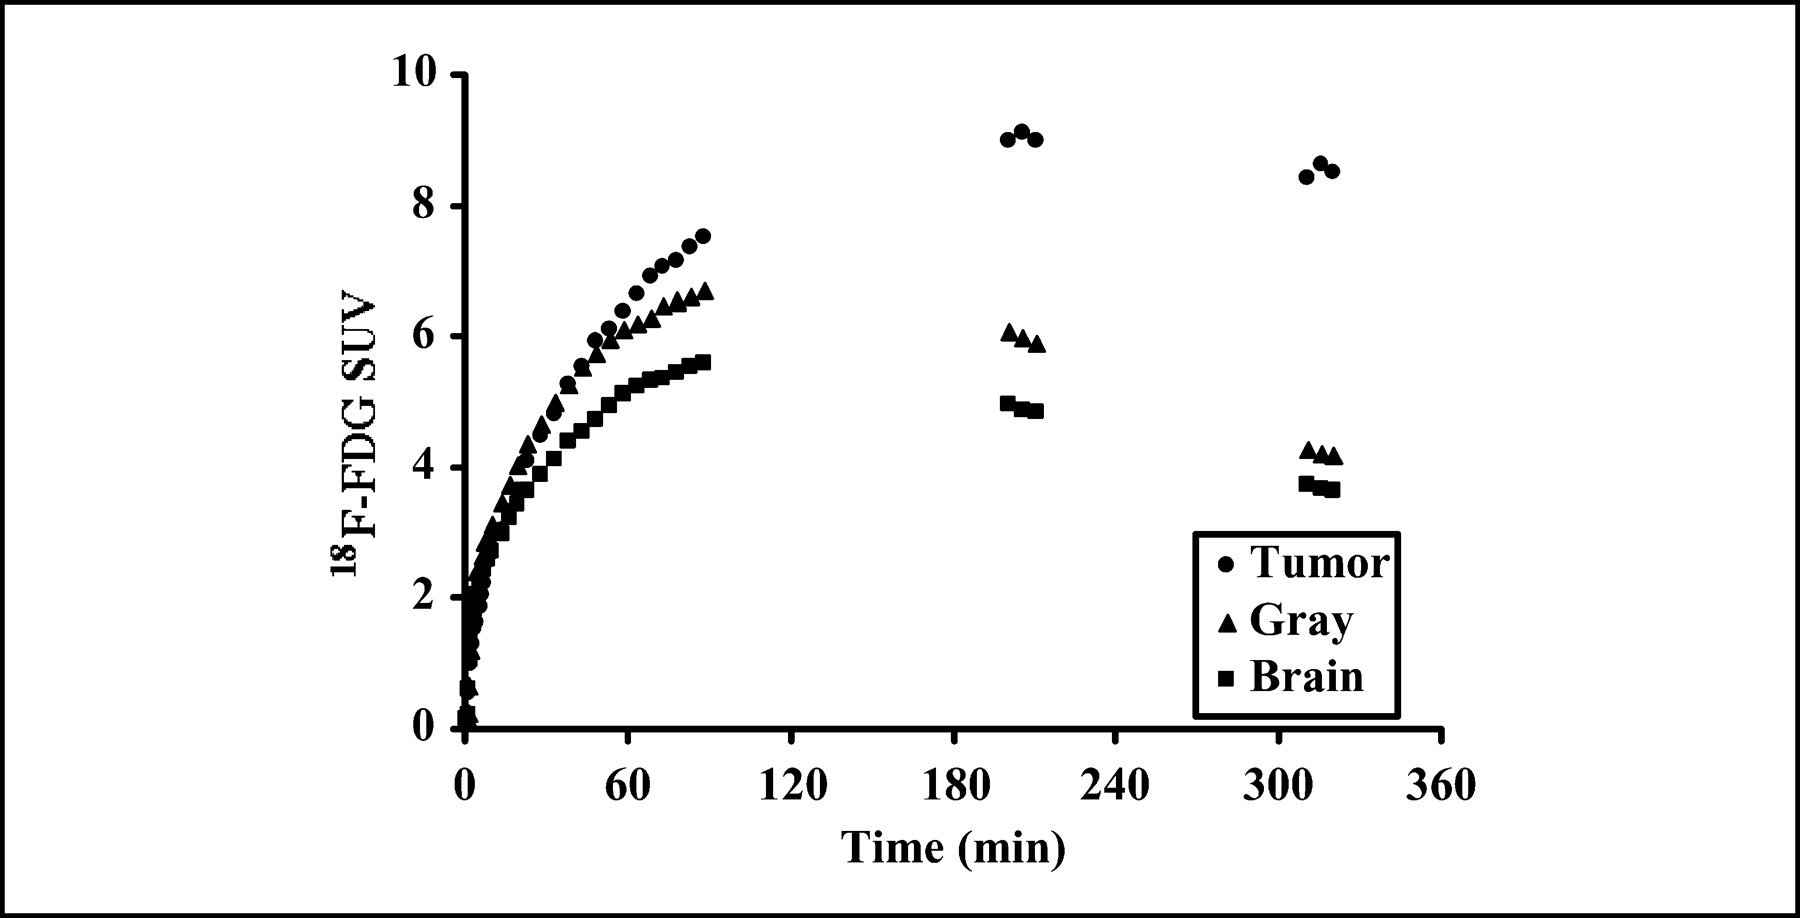
The plots for the images in Figure 4 show the time course of 18F-FDG SUV changes in tumor, brain, and gray matter. SUV is highest in tumor and remains so over the course of the study. Brain tissue and gray matter SUVs decline at later times.
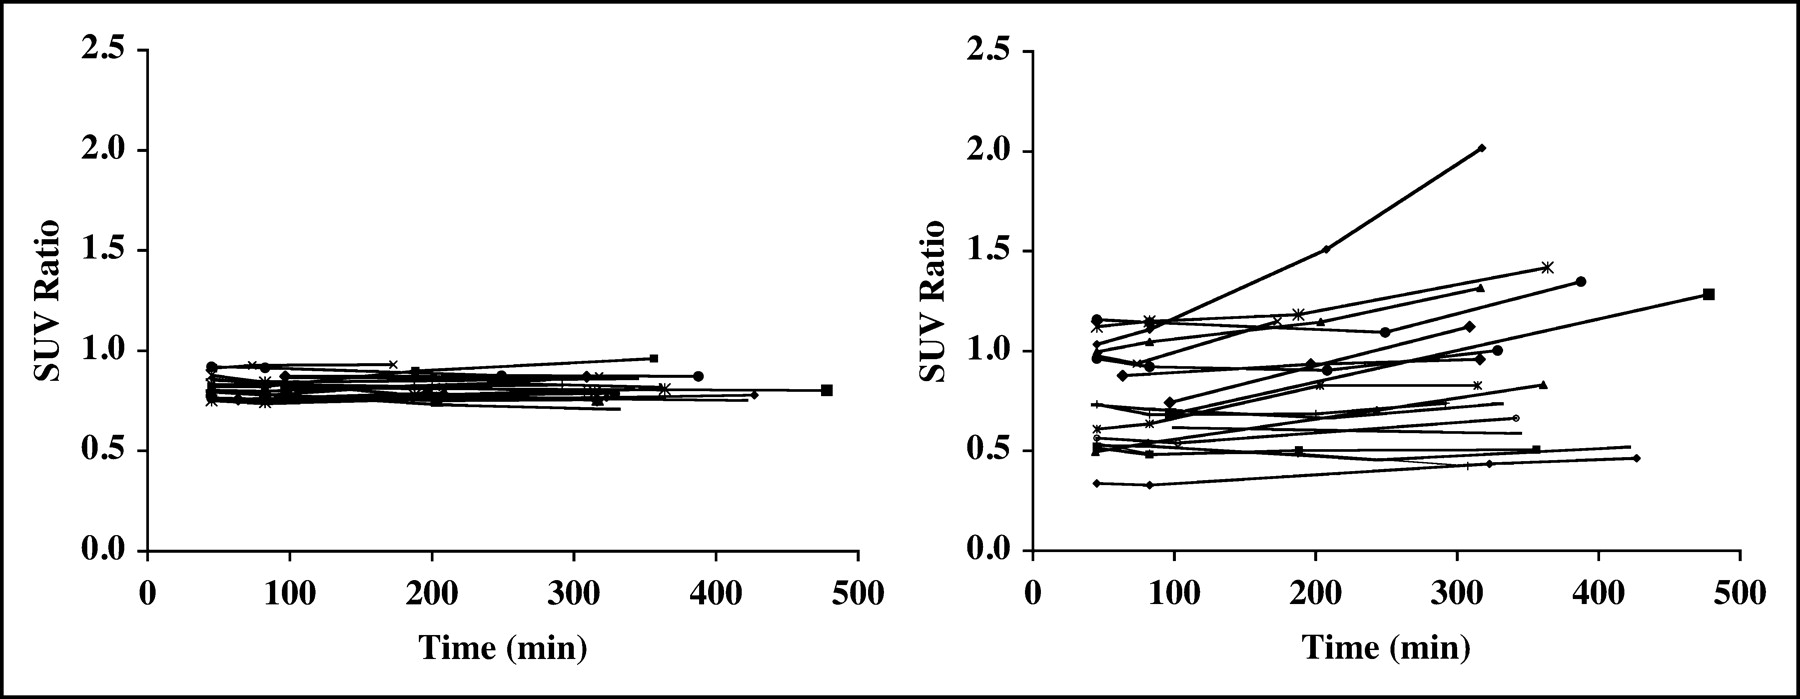
SUV data for all cases. On the left are plots of the SUV ratios of brain to gray matter, which do not change over time. On the right are similar plots of the T/G SUV ratios. These show enhancement of tumor uptake relative to gray matter over time.
In the patients with dynamic imaging, the k4 values for tumors were not different from those for gray matter when estimated at 60 min (both 0.015 ± 0.005 min−1, mean ± SD) but were lower when estimated at the later times (0.006 ± 0.002 min−1 vs. 0.008 ± 0.002 min−1, respectively, P < 0.001) (Table 2). The ratio of k4 for tumors to k4 for gray matter was thus higher at earlier times than at later times (Fig. 7).
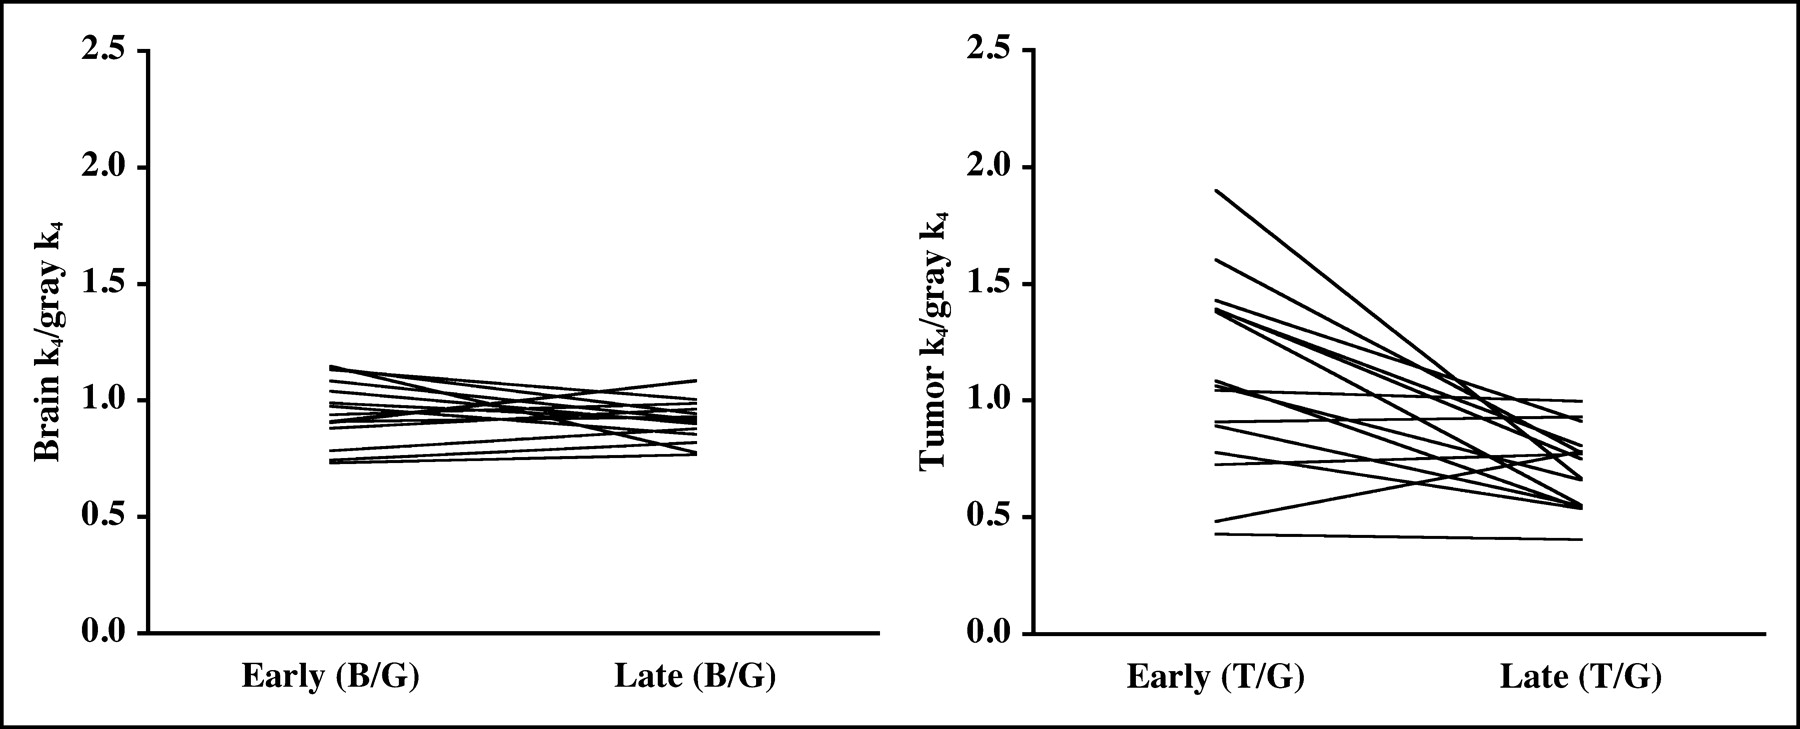
Kinetic modeling data. On the left are plots of the ratios of whole brain over gray matter (B/G) of k4 estimates, which over time remain flat. On the right are similar plots of T/G ratios, which decrease over time by −26% (n = 19, P < 0.002, paired t test).
Estimated Parameter Values from Gray Matter, Brain, and Tumor Regions
By segregating the tumors into HG, PLG, or SLG, there was better delineation at delayed imaging for 9 of 11 HG tumors, 3 of 5 PLG tumors, and 0 of 3 SLG tumors (Table 1). That is, better delineation at delayed imaging occurred in the majority of tumors showing progression by MRI criteria but did not occur in the SLG cases.
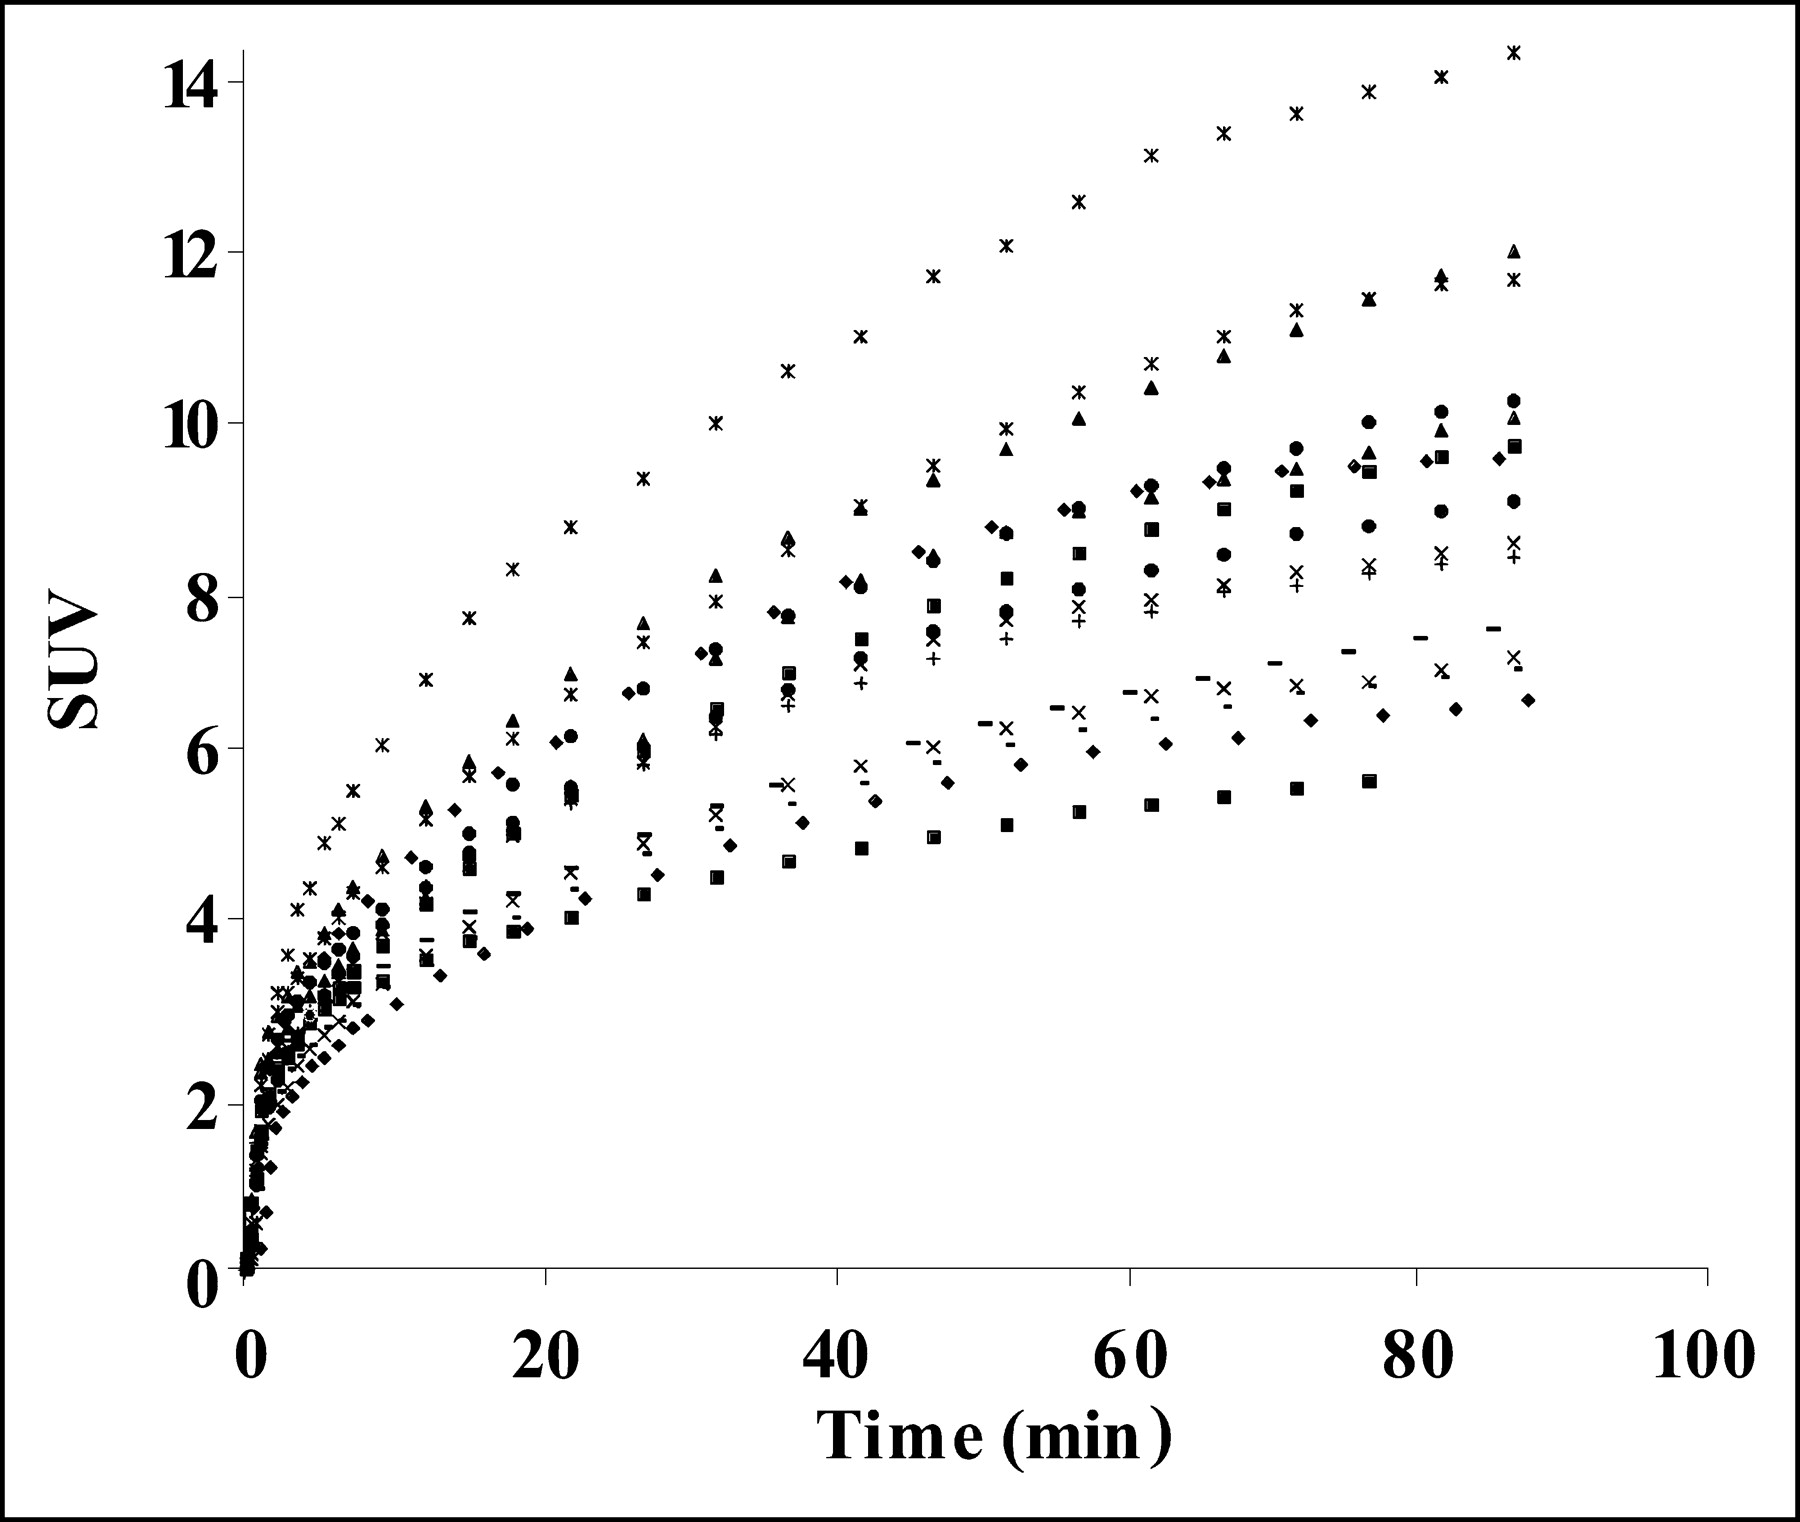
Table 3 shows the ratios of tumor SUV to reference region SUV for early and late times for tumor to gray matter (T/G), tumor to brain (T/B), and tumor to white matter (T/W). These are equal to tissue activity ratios since tumor and reference region SUVs had the same denominators. All ratios increased by roughly 20% between early and late times. These ratios were increased modestly by excluding the data for the 3 SLG cases. The percentage change in the tumor SUVs per se between the later times and the earlier times was +26% (n = 19; range, −11% to 93%; P < 0.001; paired t test). The percentage change in the SUVs for gray matter, brain, and white matter between the earlier times and the later times was not significant. However, in the 15 cases with dynamic imaging data, the SUV for gray matter continued to rise until 90 min after injection (Fig. 8).

Plots of the gray matter SUV results for the first 90 min after injection. These show a continuous rise out to the 90-min time point.
SUV Ratios Early and Late and Percentage Difference Between the Two
Blood glucose levels are shown in Table 1. No patient’s glucose level exceeded 142 mg% over the entire course of the studies.
Data analysis by the linear mixed-effects model to determine a time point after which further delayed imaging added no further clinically relevant information did not define a discreet time threshold. The longer the image was delayed within the time limits we studied, the better was the delineation, except for the 3 SLG cases (Table 4). As approximations, the delineation would increase relative to the 45-min time by 20% for T/G or T/B at 300 min after injection and for T/W at 180 min. Or, stated differently, at 300 min the increase would be 18% for T/G, 22% for T/B, and 44% for T/W. For HG plus PLG excluding SLG, the increase in delineation at 300 min relative to 45 min would be 22% for T/G, 27% for T/B, and 55% for T/W.
Relative Change in SUV Ratio as Estimated from Linear Mixed-Effects Model
DISCUSSION
This investigation aimed to show that delaying 18F-FDG PET of gliomas beyond the standard imaging time of approximately 60 min better distinguishes tumor from gray matter. In the majority of tumors, this improvement was shown by all the analysis approaches, namely visual, SUV, or dynamic quantitative methods. Delayed 18F-FDG PET is simple and technically feasible for visual and SUV analysis.
Other investigations of delayed or dual-time-point 18F-FDG PET of tumors have focused on measurements of SUVs or tumor-to-nontumor ratios and have shown that 18F-FDG uptake does not plateau until well after the duration of standard 18F-FDG PET studies (2,3,5,9–12). For example, Hamberg et al. examined stage III lung cancer before and after treatment and showed that the average time to reach 95% of the plateau level was 298 min before treatment and 154 min after treatment (13). The difference between the plateau of the SUV and the 60-min measurement was 46% before treatment and 17% afterward. These investigators also performed dynamic imaging and compartmental modeling to determine K1, k2, and k3, but not k4, which they considered to be negligible. In contrast, k4 was estimated in benign and malignant soft-tissue masses by Lodge et al. but not found to be different between these 2 comparison groups (4.81 ± 4.45 × 10⁻⁵ s−1 for benign and 4.76 ± 3.66 × 10⁻⁵ s−1 for malignant) (8). (These approximate 0.003 min−1, somewhat lower than our results.) The point to emphasize here is that these k4 values for neoplastic tissues were found to be very low.
The data in Table 3 allow a loose comparison of our results to those of Delbeke et al.—loose because these investigators used methods and times of imaging different from ours and imaged patients that had not had surgery, radiotherapy, or chemotherapy (30). The tumor–to–reference region SUV ratios in the present study are equivalent to activity ratios, since the denominators for the SUVs are the same for tumor and reference tissues. Our results suggest that tumor–to–reference region activity ratios steadily increase with time and that imagers who use the ratios of Delbeke et al. should adhere to the imaging times that were used in that report, namely 35–50 min after injection.
Glucose loading has additionally been investigated as a method to better distinguish between tumor and brain tissue (31). In patients imaged 40–60 min after tracer injection, fractional uptake of 18F-FDG after glucose loading was decreased in the cortex by 54% and in the tumors by 43%. The tumor-to-cortex ratio increased 26%. The baseline and glucose loading studies were performed a week apart. Although the imaging sessions could have been as close as 1 d apart, it would not be practical to do them on the same day as we did in our studies, and the glucose-loading approach essentially doubles radiation exposure to the patients from 18F-FDG.
Our data analysis to determine a time point after which longer delayed imaging added no further clinically relevant information did not define a discreet time threshold (Table 4). The longer the image was delayed within the time limits we studied, the better was the delineation, except for the 3 SLG cases.
Our modeling results showing that k4 estimated at delayed times was lower in tumor than in gray matter are consistent with slower dephosphorylation of FDG-6-phosphate in tumor. Because we have not measured and compared the glucose-6-phosphatase activity in gray matter or tumor, we can only speculate that our k4 results were due to a lower enzyme activity in the tumors. This is consistent with reports of low glucose-6-phosphatase activity in some experimental animal tumors (14–17) and, in our view, represents the most plausible explanation for our findings.
CONCLUSION
Delineation of gliomas from both gray matter and white matter improves both visually and by SUV analysis when the interval between 18F-FDG administration and PET data acquisition is extended.
Acknowledgments
This work was supported by grant CA 42045 from the National Institutes of Health.
Footnotes
Received Dec. 15, 2003; revision accepted Apr. 12, 2004.
For correspondence or reprints contact: Alexander M. Spence, MD, Neurology, Box 356465, University of Washington, Seattle, WA 98195.
E-mail: aspence{at}u.washington.edu
REFERENCES
In this issue


Jump to section
Related Articles
Cited By...
- Deep Learning-powered CT-less Multi-tracer Organ Segmentation from PET Images: A solution for unreliable CT segmentation in PET/CT Imaging
- PennPET Explorer: Human Imaging on a Whole-Body Imager
- Multimodality Brain Tumor Imaging: MR Imaging, PET, and PET/MR Imaging
- Estimation of Tumor Volumes by 11C-MeAIB and 18F-FDG PET in an Orthotopic Glioblastoma Rat Model
- 18F-FDOPA PET for Differentiating Recurrent or Progressive Brain Metastatic Tumors from Late or Delayed Radiation Injury After Radiation Treatment
- Multimodality Assessment of Brain Tumors and Tumor Recurrence
- Voxel-Based Analysis of Dual-Time-Point 18F-FDG PET Images for Brain Tumor Identification and Delineation
- 18F-FDG PET/CT for Image-Guided and Intensity-Modulated Radiotherapy
- NCCN Task Force: Clinical Utility of PET in a Variety of Tumor Types
- Clinical Applications of PET in Brain Tumors
- Kinetic Modeling of 3'-Deoxy-3'-Fluorothymidine in Somatic Tumors: Mathematical Studies