


Abstract
The multiple-drug resistance (MDR) transporter P-glycoprotein (P-gp) is highly expressed at the human blood–brain barrier (BBB). P-gp actively effluxes a wide variety of drugs from the central nervous system, including anticancer drugs. We have previously demonstrated P-gp activity at the human BBB using PET of 11C-verapamil distribution into the brain in the absence and presence of the P-gp inhibitor cyclosporine-A (CsA). Here we extend the initial noncompartmental analysis of these data and apply compartmental modeling to these human verapamil imaging studies. Methods: Healthy volunteers were injected with 15O-water to assess blood flow, followed by 11C-verapamil to assess BBB P-gp activity. Arterial blood samples and PET images were obtained at frequent intervals for 5 and 45 min, respectively, after injection. After a 60-min infusion of CsA (intravenously, 2.5 mg/kg/h) to inhibit P-gp, a second set of water and verapamil PET studies was conducted, followed by 11C-CO imaging to measure regional blood volume. Blood flow was estimated using dynamic 15O-water data and a flow-dispersion model. Dynamic 11C-verapamil data were assessed by a 2-tissue-compartment (2C) model of delivery and retention and a 1-tissue-compartment model using the first 10 min of data (1C10). Results: The 2C model was able to fit the full dataset both before and during P-pg inhibition. CsA modulation of P-gp increased blood–brain transfer (K1) of verapamil into the brain by 73% (range, 30%−118%; n = 12). This increase was significantly greater than changes in blood flow (13%; range, 12%−49%; n = 12, P < 0.001). Estimates of K1 from the 1C10 model correlated to estimates from the 2C model (r = 0.99, n = 12), indicating that a short study could effectively estimate P-gp activity. Conclusion: 11C-verapamil and compartmental analysis can estimate P-gp activity at the BBB by imaging before and during P-gp inhibition by CsA, indicated by a change in verapamil transport (K1). Inhibition of P-gp unmasks verapamil trapping in brain tissue that requires a 2C model for long imaging times; however, transport can be effectively measured using a short scan time with a 1C10 model, avoiding complications with labeled metabolites and tracer retention.
The blood–brain barrier (BBB) can significantly limit drug transport into the brain in, for example, chemotherapy of brain cancer (1,2). Drug efflux at the BBB is mediated by several transport proteins, of which P-glycoprotein (P-gp) is the most important (3–5). P-gp markedly restricts BBB transport of a broad range of drugs (6,7). Several strategies have been reported to improve delivery of therapeutics to the brain through circumvention of the BBB. One such strategy is the selective inhibition of P-gp, which has been shown in human studies to increase both drug delivery to the brain and therapeutic efficacy (8) of chemotherapeutic drugs. Methods to measure P-gp activity at the human BBB are required to assess this strategy.
We have recently developed a method to measure P-gp activity at the human BBB using PET (9). In that study, the distribution of 11C-verapamil, a well-established P-gp substrate, across the BBB was quantitatively monitored by the brain-to-blood ratio of the area under the radioactivity concentration curves (AUCbrain/AUCblood), or the AUCR. In healthy subjects before and after treatment with the P-gp inhibitor cyclosporine A (CsA), brain uptake of 11C-verapamil increased the AUCR by 88%. This analysis did not take into consideration either the presence of verapamil metabolites or the changes in cerebral blood flow produced by CsA.
To provide additional insight into the factors that govern the transfer of verapamil across the human BBB over a range of P-gp activity, we examined human 11C-verapamil PET data obtained before and during pharmacologic inhibition of BBB P-gp activity by CsA using compartmental modeling. Reports quantifying verapamil uptake using a variety of methods have recently appeared (10,11). However, these models were developed on the basis of data obtained from verapamil studies without P-gp inhibition, in which transport into brain tissue is quite limited. We and others (10,12–14) have explored both 1-tissue-compartment (1C) models, with exchangeable transfer only, and 2-tissue-compartment (2C) models, which include trapping, in application to human verapamil PET brain data. Here, we apply 1C and 2C models to human 11C-verapamil data and compare other nonmodeling methods of estimating P-gp activity.
MATERIALS AND METHODS
Subjects
Subject description and study design have been published previously (9) and are described here briefly. Twelve healthy volunteers (6 men, 6 women; mean age, 33 y; range, 20–50 y) were enrolled in the studies. These protocols were approved by the University of Washington Human Subjects, Radiation Safety and the Radioactive Drug Research Committees. All subjects provided signed informed consent.
Radiopharmaceuticals
Radiosynthesis methods have been previously reported (9). All tracers were greater than 99% radiochemically and were chemically pure.
PET
Patient imaging methods have been previously reported (9). Verapamil and CsA were infused through venous lines, and blood sampling was performed through an arterial catheter using an automated device and programmed sequence (15). Images were acquired as 3-dimensional dynamic emission scans on an Advance Tomograph (GE Healthcare) (16). PET images were reconstructed using a 3-dimensional reprojection algorithm, with correction for scattered and random coincidences. The tomograph, dose calibrator, and γ-counter were cross-calibrated to express all measurements in common units of radioactivity (Bq/cm3).
Experimental Design
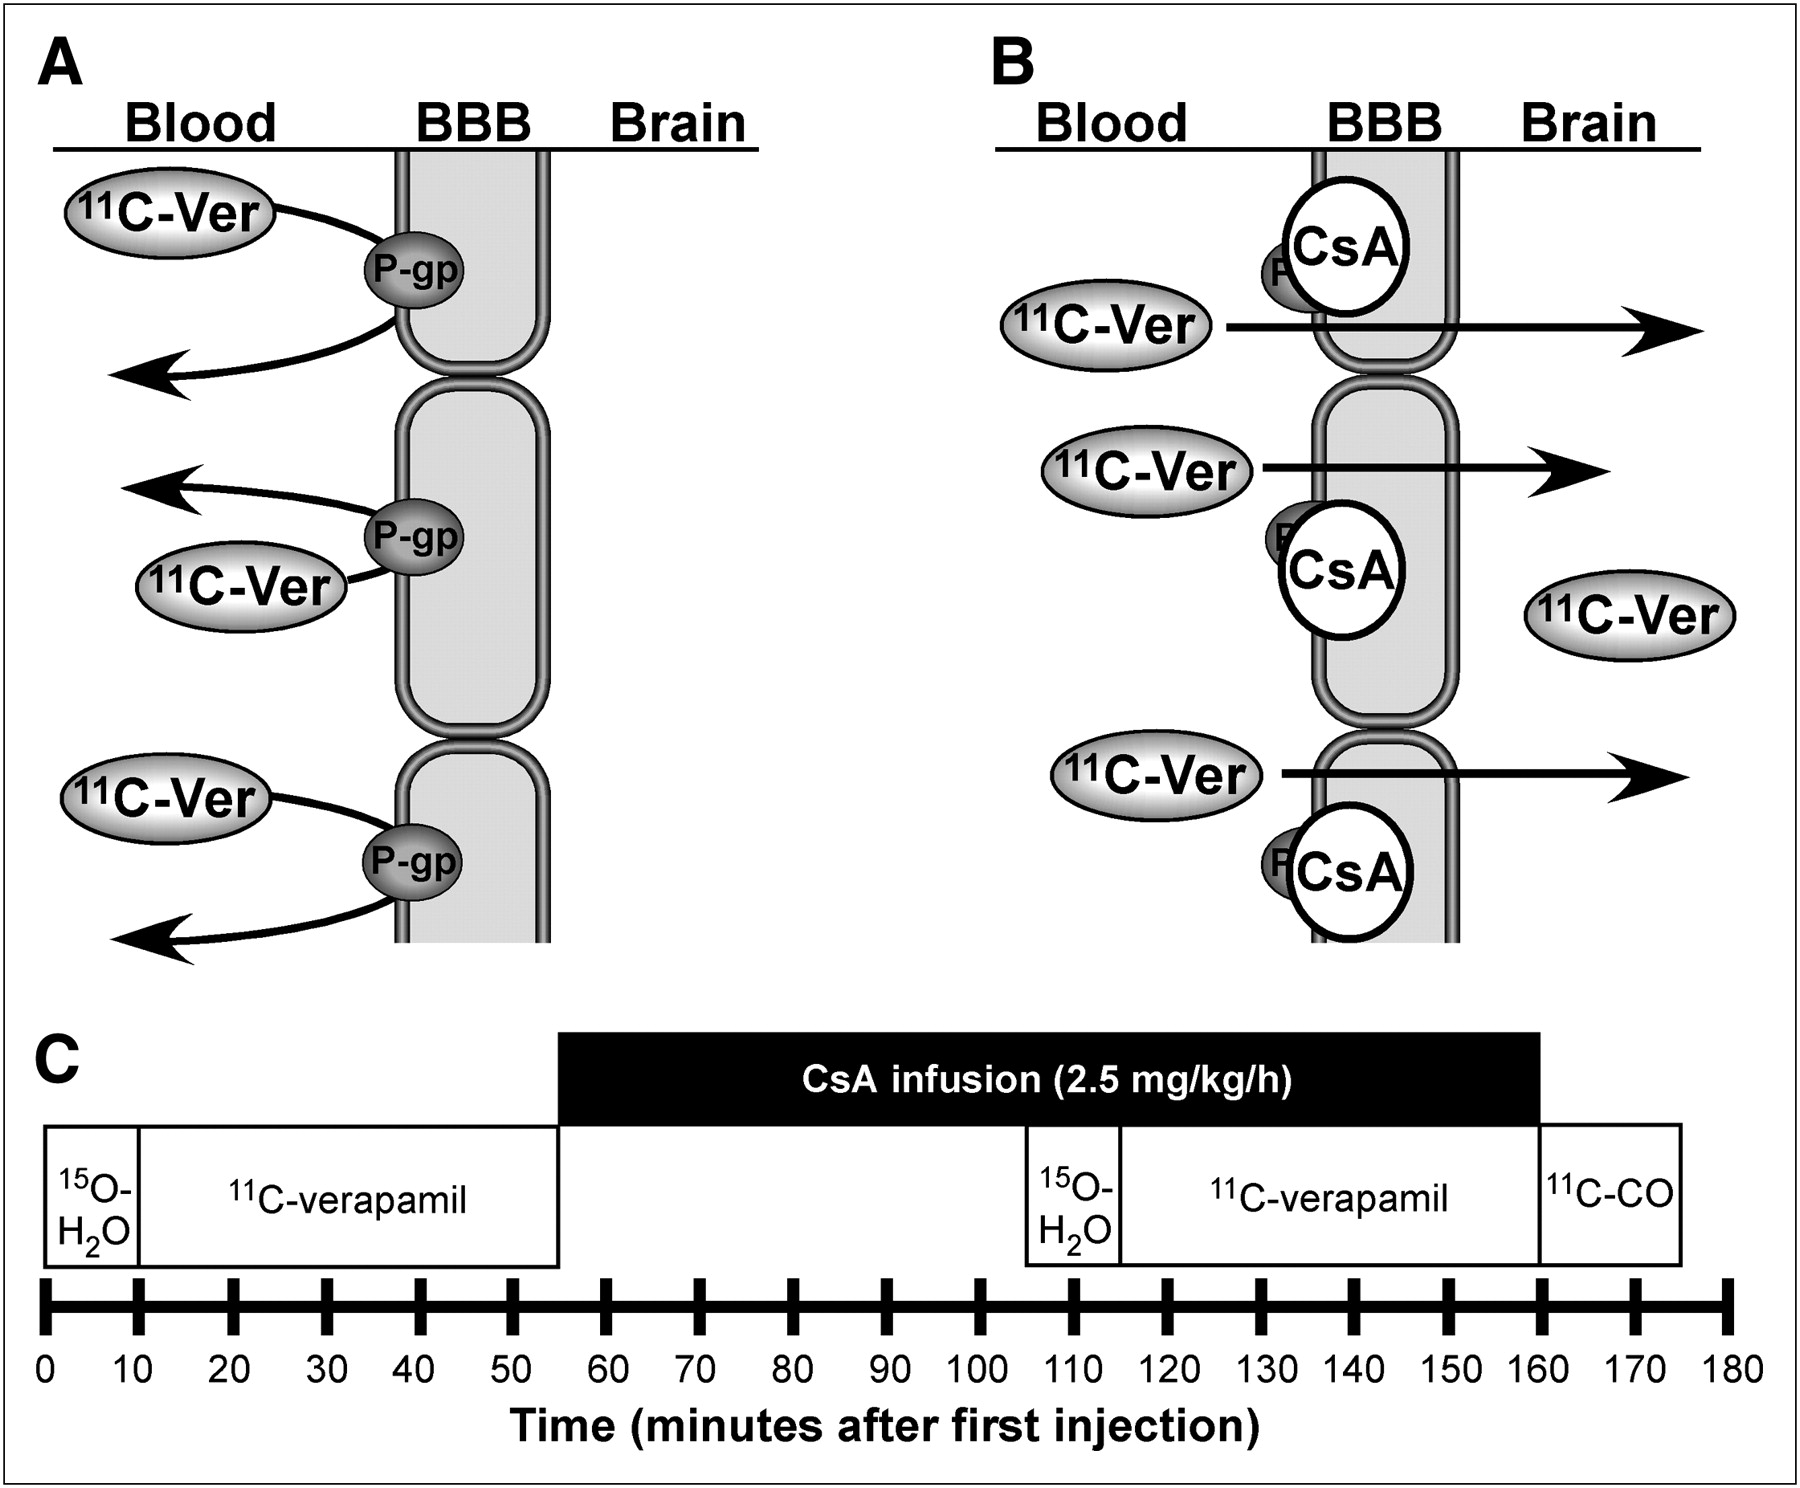
The experimental design for imaging the P-gp blockade by CsA is illustrated in Figure 1. Briefly, the PET protocol consisted of the following sequence of studies: 15O-water (pre-CsA blood flow), 11C-verapamil (pre-CsA P-gp function), initial CsA infusion, 15O-water (blood flow during CsA), 11C-verapamil (P-gp function during CsA), and 11C-carbon monoxide (11C-CO; vascular volume in tissue after CsA treatment).

(A) P-gp, which acts on a wide range of xenobiotic agents, is an adenosine triphosphate–dependent efflux pump involved in multiple-drug resistance. P-gp enables secretory excretion from the BBB, acting on substrates such as 11C-verapamil. (B) In our experiment, P-gp inhibitor CsA binds to P-gp and inhibits both drug efflux activity and verapamil binding. PET of 11C-verapamil before and during CsA administration allows estimation of inhibition of P-gp by CsA directly in humans by determining 11C-verapamil transport in brain. (C) PET timeline for 5-injection protocol to assess 11C-verapamil uptake in human brain before and after administration of P-gp modifier CsA.
To assess cerebral blood flow, 15O-water (∼6 MBq/kg; range, 4.8–8.8 MBq/kg) was injected as an intravenous bolus, and images were acquired continuously with ten 3-s, ten 6-s, and sixteen 9-s time bins. Arterial blood samples (1 mL) were obtained with the following sequences: fourteen 4-s, six 10-s, and nine 20-s samples.
11C-verapamil (∼3.5 MBq/kg; range, 2.2–4.6 MBq/kg) was injected intravenously over 1 min. Image acquisition immediately followed injection and continued up to 45 min using an imaging sequence of eight 15-s, four 30-s, four 60-s, four 3-min, and five 5-min time bins. A total of 22 arterial samples (1 mL) were taken, to parallel the imaging sequence, and separated into aliquots of 100 μL of blood and 100 μL of plasma. A larger volume of blood (3–5 mL) was collected at 1, 5, 10, 15, 20, 30, and 45 min, to determine plasma 11C-verapamil and metabolite concentrations using methods previously described (9). Blood and plasma samples were counted in a calibrated γ-counter (Packard Corp.) to determine blood radioactivity.
The CsA infusion (2.5 mg/kg/h, 2.5 mg/mL; UWMC Drug Services) was initiated after completion of the first 11C-verapamil study. A second 15O-water imaging study was acquired after at least 45 min of CsA infusion, to determine any changes in blood flow induced by the CsA infusion. A second injection of 11C-verapamil followed after 1 h of CsA infusion, with an identical imaging and blood-sampling sequence. CsA infusion continued during the second 11C-verapamil scan to a maximum of 2 h from the start of the infusion. Blood samples were taken at 15, 30, 45, 60, 90, and 120 min after CsA infusion to determine CsA concentrations by high-performance liquid chromatography (9).
At the end of the second 11C-verapamil imaging study, 11C-CO (mean dose, 5.3 MBq/kg; range, 3.4–10.5 MBq/kg) was administered by inhalation, to determine cerebral blood volume. Images were acquired for 16 min after inhalation in time blocks of 4 min, and blood radioactivity was measured in 1-mL samples taken every 4 min. Measurements of the fraction of blood volume in tissue (Vb) were applied directly in compartmental modeling of verapamil. Conventional MRI scans (T1 and T2) acquired within 2 wk of the PET procedures provided anatomic information for constructing regions of interest (ROIs).
Image Processing
MR images (T1) were coregistered to the PET images with a method based on mutual information criteria using PMOD software (PMOD Technologies). ROIs for brain, gray matter, and white matter were identified on the coregistered MR images using conventional image-processing software (Alice; HIPG). The ROIs from contiguous slices were combined to create volumes of interest (VOIs) for each tissue type. Typically, brain regions extended 15 slices (∼6 cm) including both gray and white matter in a volume of about 250 cm3. VOIs were applied to both the dynamic image sets and the static summed standardized uptake value (SUV) images (5–25 min for 11C-verapamil, 30–90 s for 15O-water, and 4–16 min for 11C-CO) for data extraction.
Blood Flow
Tissue time–activity curves for each water VOI were analyzed with a flow-dispersion model for 15O-water (17), estimating flow (F), the partition coefficient (p), and a dispersion parameter. Nonlinear optimization of the model parameters was performed by fitting the model estimation of tissue activity (Ct) to the tissue time–activity curves obtained from PET using the arterial 15O time–activity curve as the blood input function (PMOD Technologies).
Blood Volume
Tissue blood volume was calculated by the following formula: Eq. 1where Ct is the integral tissue activity (Bq/cm3) from scan start (T1 = 4 min) to the end of the scan (T2 = 16 min) after inhalation of 11C-CO, CB is the integral arterial blood activity of 11C, HR is a correction factor for the ratio of small-to-large vessel hematocrit previously reported for the human brain (18,19), and ρt is the tissue-specific gravity in grams per milliliter.
Verapamil Model Input Functions
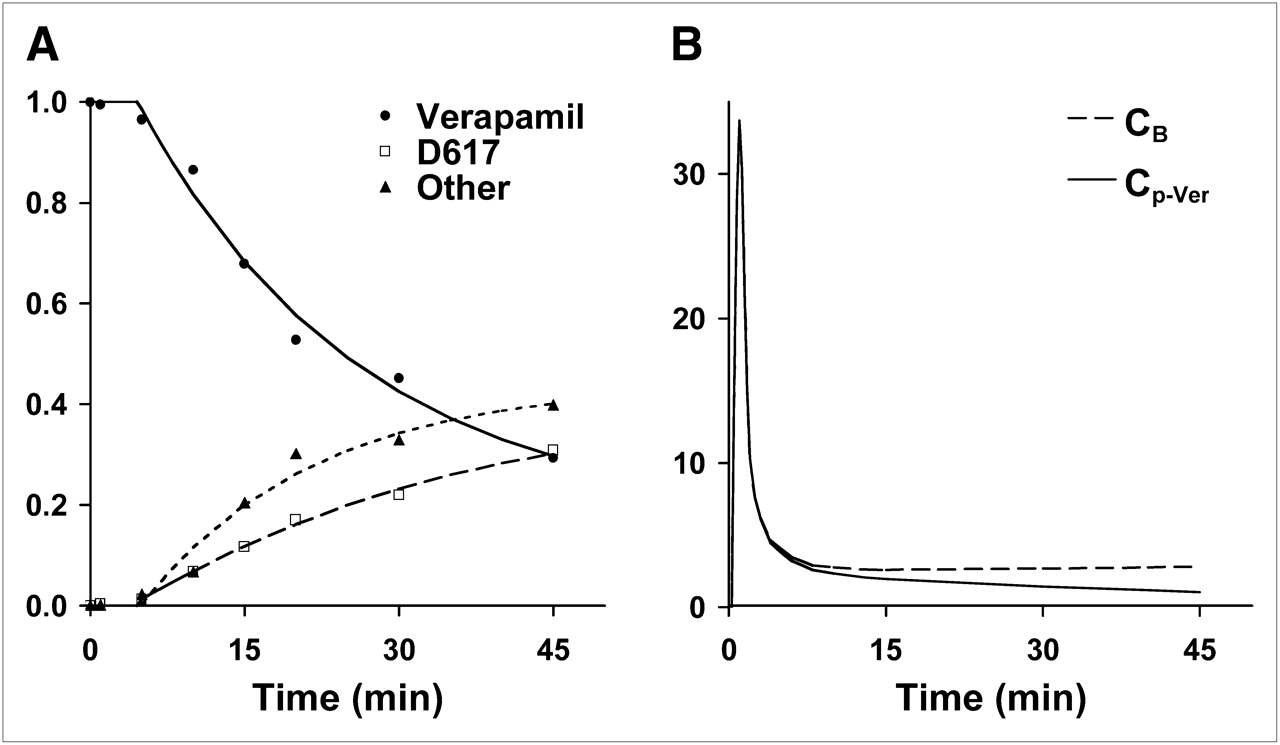
To estimate the kinetics of verapamil transport and retention in brain regions, the arterial activity profile of unmetabolized verapamil was determined as previously reported (9). Briefly, metabolite assays over 45 min of verapamil metabolism result in the following 3 fractions: parent compound, D617/D717 (henceforth referred to as D617), and other metabolites, referred to as polar metabolites (20). We applied an empiric curve fit to the metabolite assay data similar to approaches we have used in comparable settings (21). Then, the fractional curve was applied to the measured plasma activity curve to provide a metabolite-corrected verapamil input function (Cp-Ver) used for modeling analysis on datasets for individual subjects (Fig. 2).

(A) Verapamil in blood declined rapidly to an average of 37% on average at 45 min after injection. In this subject example, exponential washout function (—) fit to verapamil measurements (•) provided fraction of verapamil as a function of time. Metabolites of verapamil in plasma, D617 fraction (▴) and other, polar metabolites (▪) continually rose during imaging study, reaching a combined total metabolite fraction of over 60%. (B) Verapamil model input function, Cp-Ver, is a combination of total blood activity, CB, and the fraction of verapamil determined from plasma metabolite analysis. Similar curves were obtained for all 12 subjects. Mean verapamil fraction at 45 min was 40% (range, 66%−24%), D617 fraction was 30% (range, 49%−17%), and other metabolites were 30% (range, 44%−16%).
Verapamil Compartmental Modeling
Studies examining P-gp at the BBB suggest that it serves to efflux substrates from the BBB into the blood, thus preventing access to the central nervous system. Efflux occurs rapidly relative to the PET acquisition time frame (22). Given this behavior, verapamil transit at the BBB, through the effect of P-gp on verapamil transport, should behave as a single brain-tissue compartment in which P-gp substrates are rapidly exchanged during dynamic PET. In this case, the effect of P-gp would influence the net forward transfer constant, K1, within the first few minutes after verapamil injection. An alternative hypothesis in the case of P-gp with slower kinetics and less effective clearance would suggest that P-gp affects the distribution volume of substrates, Vd ≈ K1/k2, where k2 is the efflux rate constant. In either case, exchange should be entirely bidirectional and be adequately described by a single reversible tissue compartment.
However, our early studies suggested that verapamil retention may occur in the brain beyond 10–15 min after injection in the presence of the P-gp inhibitor CsA (9). This result indicated tissue trapping by an unknown mechanism and required, at a minimum, a second compartment to describe tissue-retention characteristics for a longer imaging duration. Therefore, we assessed the initial transport of verapamil in human subjects both before and during P-gp modulation using a 2C model (Fig. 3A) described previously (10,12). The floated model parameters included delay, K1, K1/k2, k3, and k4. Vb measured directly by 11C-CO PET was applied as a fixed parameter in the verapamil models. The time delay between the blood input function and the tissue activity curve was estimated as part of model optimization. Model parameters were estimated by minimizing the weighted residual sum of the square error between the model solution and the PET measurement, in which the residuals were weighted by the inverse variance of the total counting rate in each frame of data (23). Model starting conditions and range of model parameters appear in Table 1.

Compartmental models of verapamil uptake for assessing P-gp activity at the BBB. (A) 2C model accounts for verapamil transport (K1) and overall retention in brain and is kinetically described by 2 differential equations expressing the quantity of verapamil in exchangeable compartment (Qe) and in retained compartment (Qr): dQe/dt = K1Cp-Ver − k2Qe − k3Qe + k4Qr and dQr/dt = k3Qe − k4Qr. Total tissue uptake (Ct) is then Ct = (Qe + Qr + VbCB)ρ, where ρ is tissue density in grams per milliliter, and Vb is measured fractional blood volume in milliliters per gram. (B) 1C model using 10 min of data can closely approximate transport parameter, K1 of 2C model using 45 min of data, and can be formulized as Ct = (Qe + VbCB)ρ, where dQe/dt = K1Cp-Ver − k2Qe.
Verapamil 2C Model Parameters: Expected Ranges and Starting Values
1C Model for Verapamil
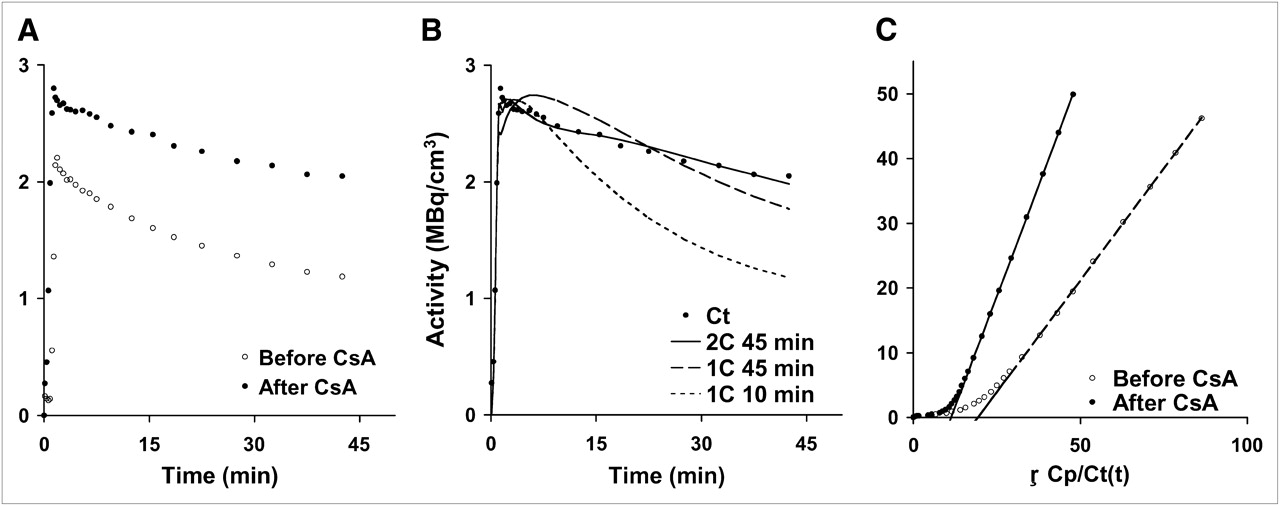
In our initial investigations, a 1C model using the entire verapamil dynamic sequence collected after CsA treatment produced poor fits, compared with a 1C model using the initial 10 min of dynamic data (1C10), as supported by a lower Akaike information criteria (AIC) value (mean 1C45 AIC, 128; mean 1C10 AIC, 60) and visually supported by the poor model fit to the data (Fig. 4B). Therefore, a 1C10 model (Fig. 3B) was implemented on a subset of the data (10 min), where K1 represents the net influx of verapamil from plasma delivery to tissue, and the ratio K1/k2 (Vd) would estimate the overall distribution volume of verapamil in the brain. Model parameters included delay, K1, and Vd. As in the 2C model, Vb was measured using 11C-CO and applied as a fixed parameter in the model.

(A) Brain time–activity curves for 11C-verapamil before and after CsA treatment illustrate differences in uptake after administration of CsA. (B) A representative brain time–activity curve (Ct) was fitted using a simple 1C model with 45 min of data (1C45), the initial 10 min of data (1C10), and the 2C model. (C) Logan plot analysis is the brain time–activity curve normalized for blood activity, where the slope (VdLogan) is the ratio of integral tissue activity over integral blood activity similar to AUCR analysis (tissue AUC/blood AUC).
Noncompartmental Modeling Methods
Model-independent estimates of verapamil retention before and during CsA administration were assessed by several techniques. The SUV was determined from the activity in each region obtained from the 5- to 25-min summed verapamil image and normalized by the injected dose and the subject's weight.
The graphical method described by Logan (24) to assess receptor-binding characteristics from dynamic PET data produces an estimation of the distribution volume (VdLogan) of a receptor-bound radioligand. The Logan analysis requires 2 assumptions after tracer injection: that the tracer equilibrates rapidly in the first few minutes as free and bound product and that there are no metabolites in tissue or blood (24). Assuming no difference between verapamil and metabolites of verapamil, this method has previously been applied to verapamil dynamic datasets to generate a model-independent measure of the VdLogan in the brain (5), with the following formulation, Eq. 2where ROI(τ) and Cb(τ) represent tissue and arterial blood radioactivity, respectively, at time τ; VdLogan is the slope, an estimation of the distribution volume of the tracer; and C is the axis intercept. The Logan plot becomes linear after initial tracer transport and tracer washout, with a slope (VdLogan) that approximates the steady-state distribution volume of the retained tracer (Fig. 4C).
Model Simulations and Analysis
To guide verapamil compartment modeling, we performed simulations and model characterization, as performed in prior analyses for other models (25,26), to estimate parameter identifiability and estimated precision (data not shown). This analysis suggested that K1 and overall metabolic flux (Ki) could be reliably estimated; however, it was difficult to estimate k3 or k2 independently. Sensitivity functions for Vb and K1 early after injection were similar, suggesting that it would be difficult to estimate these parameters independently, especially at the higher K1 values seen after P-gp inhibition. These results, therefore, focused our compartmental analysis on the estimate of K1 and the macroparameters VdTot (VdTot = (K1/k2) + [(K1 × k3)/(k2 × k4)]) and flux (Ki = (K1 × k3)/(k2 + k3)).
Statistical Analysis
Variations in parameter values after CsA administration were determined as percentage change and were tested for significance by the paired t test. A value of P less than 0.05 was required for statistical significance. Conventional correlations of model parameters to other measures of verapamil retention were performed in JMP (SAS Institute). To determine how well the model fit the data, the corrected AIC was calculated as described by Akaike (27).
RESULTS
Subject Studies
Plasma (Cp) had higher radioactivity concentrations than did blood (CB) in measurements determined from 456 arterial samples (mean ± SD, 10.4% ± 13.3%) collected between 1 and 45 min, and the difference was statistically significant (paired t test, P < 0.001). An example of the fractional activity determination in plasma of verapamil and verapamil plus D617 used in the determination of the arterial input functions from 1 subject is presented in Figure 2. Time–activity curves of a brain region before and during CsA infusion from this subject appear in Figure 4A. PET images of 11C-verapamil before and during CsA injection and conventional MRI scans from the same subject are presented in Figure 5. Plasma CsA concentrations reached a stable average of 2.8 μmol/L (range, 2.1–3.2 μmol/L, n = 12) shortly after initial administration and were maintained at this level throughout the second verapamil imaging study. Plasma analysis revealed a steady decline of the parent compound to an average value of 37% ± 9% of radioactivity at 45 min after injection (n = 24). No statistical difference in the fraction of parent 11C-verapamil plasma activity concentrations after CsA treatment (P = 0.76, n = 76) was observed. The correction for vascular space activity in brain tissue ROIs, Vb, was fixed in the verapamil models to values measured directly from the blood volume analysis using 11C-CO PET. The average Vb for the brain was 0.044 mL/g (range, 0.037–0.055 mL/g).

T1-weighted MR image (A) from representative subject and corresponding T2-weighted MR image (B) provide anatomic reference. (C) 11C-verapamil uptake image (SUV) before CsA treatment was acquired between 5 and 25 min after injection. (D) 11C-verapamil uptake image after 1 h of CsA infusion shows general increase in verapamil uptake in all areas of brain after inhibition of P-gp by CsA. Color scale reflects SUV as shown by thermometer.
Changes After CsA Treatment
Brain blood flow increased a small amount (13% ± 18%, n = 12) after the infusion of CsA, whereas verapamil transport (K1) estimated with the 1C10 model or the 2C model increased 69% and 73%, respectively, in the presence of CsA and was significantly greater than blood flow (P < 0.001, n = 12). K1/k2 for the 2C model rose but did not change significantly; therefore, as dictated by equilibrium considerations, k2 also rose during P-gp inhibition. Both Vd for the 1C model and VdTot for the 2C model significantly increased after P-gp inhibition. The blood flow–normalized verapamil transport (2C K1/F) increased 55% ± 21% (n = 12). The verapamil SUV and the AUCR also exhibited significant increases after P-gp inhibition (30%, P < 0.001, and 88%, P < 0.001, respectively; n = 12). Individual brain regions, such as gray and white matter, showed similar changes after CsA treatment. Parameter estimates appear in Table 2, and the percentage changes after CsA treatment are listed in Table 3.
Verapamil Model Parameters in Human Brain
Change in Verapamil Retention After CsA Treatment
Estimates of P-gp activity (K1) were highly correlated between the 1C10 and the 2C models (r = 0.99, n = 24), and their corrected AIC values were similar (1C AIC10, 60 ± 11, and 2C AIC45, 65 ± 17). A direct AIC comparison is not valid because the number of model parameters and number of data points differ; however, a similar AIC may indicate that the models account for the data to a similar degree (27).
Parameters that estimate the tissue distribution volume such as the K1/k2 ratio for the 1C model (Vd) and the 2C VdTot increased (70% and 67% increase, respectively). Differences were observed in the correlations of selected parameters before CsA and during CsA treatment. Before CsA modulation, the parameter pairs exhibiting a high degree of correlation were AUCR versus VdLogan (r = 0.89) and the 1C10 K1 versus 2C K1 (r = 0.99). After CsA modulation of P-gp, 2C model correlations were observed between K1 and VdTot (r = 0.71) but marginally for K1 versus AUCR (r = 0.58), and none of the selected parameters correlated to VdLogan except AUCR (r = 0.96). An example Logan plot appears in Figure 4C.
DISCUSSION
Several methods of analysis, including simple ratio techniques and multicompartmental kinetic modeling, indicated that the effect of blocking P-gp activity in healthy human subjects using CsA increased 11C-verapamil transport across the BBB into the brain by approximately 70%. The increased 11C-verapamil transfer after CsA administration was greater than the nominal changes in measured blood flow accompanying CsA infusion. Estimates of verapamil transport require normalization to independent estimates of blood flow to differentiate flow effects from P-gp activity using verapamil.
In vivo verapamil imaging without the modulating effect of CsA produces little net forward transport of verapamil (low K1), even transiently, within the time resolution of PET, which is consistent with P-gp activity preventing transit across the BBB into the brain (28,29). Given the severe limitation on initial transport, prolonged retention of verapamil would not be readily apparent. Our results suggest, however, that when forward transport is increased by the inhibition of P-gp, trapping becomes apparent, and the 2C model was required to fit 45-min PET data obtained during P-gp inhibition. We performed additional simulations (data not shown), confirming that estimations of k3 were unreliable and that k3 might not be apparent in the absence of P-gp inhibition but readily seen after the nearly 100% increase in K1 produced by CsA inhibition of P-gp. Under these conditions, kinetic parameters that rely on tracer retention versus transport may suffer from low accuracy in PET and would include SUV, VdLogan, VdTot, k3, and Ki. Multicompartmental modeling has the unique advantage over nonmodeling methods of allowing the separation of initial transport rates (K1, k2) from the rate constants associated with verapamil retention (k3, k4). After CsA administration, a uniform, significant increase in early verapamil uptake and transport was observed, resulting in a net increase in brain AUCR. Compartmental modeling results suggested that the increased verapamil uptake after CsA inhibition was primarily an effect of increased transport (K1) across the BBB, not explained by blood flow and not accompanied by a significant change in Vd. The apparent effect on transport is consistent with the vacuum cleaner hypothesis for P-gp at the BBB and other observations demonstrating the efficiency of BBB P-gp in preventing passage of excluded substance into brain parenchyma (28,29). The 2C analysis using model simulations demonstrated good sensitivity and precision for estimating K1 and Ki but had difficulty independently estimating other 2C model parameters such as k3 and VdTot, which reflect verapamil trapping. Monte Carlo error analysis showed a larger coefficient of variation for parameters other than K1 and Ki. Two-compartment simulations showed accurate estimates of K1 and Ki, with little bias and SEs of less than 15% over a realistic range of values.
For imaging times out to 45 min, the fit of a 1C model was significantly poorer than a 2C model that included trapping (Fig. 4B). The biologic nature of verapamil trapping in brain tissue is unknown but likely reflects processes other than P-gp activity, such as calcium channel or protein binding (29). However, curiously, we found a correlation between changes in K1 and parameters that may be dependent on trapping, such as SUV, VdLogan, VdTot, k3, and Ki. An examination of parameter estimates from data during CsA treatment with the 2C model in Table 2 shows that k3 is considerably larger than K1, suggesting that trapping may act as a sink for verapamil and contribute to the concordance of these kinetically distinct measures. The agreement of these measures may help explain the similarity of results in the literature analyzed by methods with considerably different approaches (3,5,9,10,12–14) and may help explain why methods focused on forward transport yield results similar to those measuring apparent distribution volumes.
Our analyses provide insights into this dilemma. The sharp increase in transport (K1) with P-gp inhibition suggests that the activity of P-gp at the BBB is associated with the initial transfer of verapamil from blood to brain. Tissue trapping of verapamil unmasked by the higher K1 values observed during P-gp inhibition may not be related to P-gp activity. Therefore, estimates of verapamil retention (Ki, VdTot, VdLogan, AUCR) may provide information on drug distribution, but may potentially be an estimate of P-gp activity. However, because the mechanism of trapping is incompletely understood, measures such as Ki, VdTot, and VdLogan that are affected by tracer retention may give misleading results if trapping is affected by drug intervention or other effects.
Because verapamil transport is not influenced by tissue trapping, K1 poses as a more robust and appropriate measure to indicate P-gp function at the BBB. The correspondence of verapamil K1 changes after P-gp inhibition to measures of verapamil tissue distribution, such as VdTot, suggests that these other measures can also serve as an indication of P-gp function and might enable simpler image-analysis methods such as Logan analysis. However, the better precision associated with K1 estimates and uncertainty regarding the mechanism of verapamil retention suggest that K1 provides a more suitable measure of P-gp function at the BBB, especially for testing the effects of P-gp inhibitors. This may not be the case for somatic tissues, into which verapamil transfer appears to be relatively high, even in the absence of P-gp inhibition, and in which P-gp function may be manifest as tracer efflux (k2) rather than blood-to-tissue transport (K1).
Our analysis and prior reports (10,12) suggest that the potentially confounding effects of verapamil trapping and of blood metabolites can be avoided using a 1C model applied to the early time course of data. This approach yielded estimates of verapamil K1 that were highly correlated to K1 estimates using the 2C model applied to the full 45 min of data, and their average values were within 10% of each other. The 1C10 modeling protocol shortens the scanning period, greatly simplifies the analysis using a simpler model without the need for blood metabolite assays, and can identify P-gp activity before significant retention (12), which therefore provides an attractive approach for using verapamil PET to measure P-gp function at the BBB.
Our tracer studies differ from the studies of others (10,20,30) in that we used racemic (R plus S) verapamil rather than a pure enantiomer (R). Both racemates are substrates of P-gp, and only the metabolite fraction will change with the enantiomeric ratio, so it is unlikely that racemic verapamil makes a significant difference in the estimation of kinetic parameters. Although the metabolism of racemic verapamil was more rapid (37% parent compound at 45 min) than that of (R)-11C-verapamil (57% parent compound at 40 min (10)), profiles of the metabolic byproducts of verapamil in plasma were measured for every subject, resulting in individualized model input functions minimizing the effect of verapamil metabolism on kinetic analysis.
Lubberink et al. (10), who also supported a 1C model for verapamil, suggested that k2 or Vd provides the best marker of P-gp activity. However, our data suggest an alternative interpretation of P-gp activity at the BBB represented by its effect on the K1 parameter, in which P-gp efflux kinetics at the plasma–BBB barrier are rapid relative to the time scale of PET and result in a small apparent net K1. Estimates of verapamil trapping (Ki, VdTot, VdLogan, AUCR) made apparent during CsA inhibition may explain the correspondence between the results; however, trapping could also confound these estimates, decreasing their reliability.
CONCLUSION
Inhibition of P-gp by CsA yields a significant increase in forward verapamil transport across the BBB, K1 in compartmental models. These changes were not explained by the changes in blood flow observed during CsA treatment. P-gp inhibition by CsA also revealed the apparent trapping of verapamil, requiring a 2C model to fit tissue uptake data obtained out to 45 min after injection. A 1C model applied to the early time course (10 min) of PET data closely approximated K1 values from a 2C model using 45 min of data, including studies conducted both before and during P-gp inhibition. These results suggest that a 1C model with a short scanning sequence, which avoids complications such as labeled metabolite redistribution and the effect of tracer retention on model estimations of P-gp activity, provides an accurate estimation of P-gp activity at the BBB and is therefore preferred.
Acknowledgments
We are indebted to Barbara Lewellen, Pam Phan, and Michelle Wanner of the UW Molecular Imaging Center for their expert technical assistance in PET imaging. We also thank Drs. Sara Eyal, Janet F. Eary, and Kenneth A. Krohn for their helpful comments on this manuscript. This work was supported by National Institutes of Health grants PO1 CA42045, MH063641, and S10 RR17229.
Footnotes
-
COPYRIGHT © 2009 by the Society of Nuclear Medicine, Inc.
References
- Received for publication October 20, 2008.
- Accepted for publication April 28, 2009.


Jump to section
Related Articles
Cited By...
- Imaging P-Glycoprotein Induction at the Blood-Brain Barrier of a {beta}-Amyloidosis Mouse Model with 11C-Metoclopramide PET
- Synthesis and Characterization of Bodipy-FL-Cyclosporine A as a Substrate for Multidrug Resistance-Linked P-Glycoprotein (ABCB1)
- Impact of P-Glycoprotein Function on the Brain Kinetics of the Weak Substrate 11C-Metoclopramide Assessed with PET Imaging in Humans
- Characterization of P-Glycoprotein Humanized Mice Generated by Chromosome Engineering Technology: Its Utility for Prediction of Drug Distribution to the Brain in Humans
- Assessment of P-Glycoprotein Transport Activity at the Human Blood-Retina Barrier with (R)-11C-Verapamil PET
- Strategies to Inhibit ABCB1- and ABCG2-Mediated Efflux Transport of Erlotinib at the Blood-Brain Barrier: A PET Study on Nonhuman Primates
- Clinical Applications of Simultaneous PET/MR Imaging Using (R)-[11C]-Verapamil with Cyclosporin A: Preliminary Results on a Surrogate Marker of Drug-Resistant Epilepsy
- Imaging the Impact of the P-Glycoprotein (ABCB1) Function on the Brain Kinetics of Metoclopramide
- Modulation of P-glycoprotein at the Human Blood-Brain Barrier by Quinidine or Rifampin Treatment: A Positron Emission Tomography Imaging Study
- Role of (Drug) Transporters in Imaging in Health and Disease
- Activity of P-Glycoprotein, a {beta}-Amyloid Transporter at the Blood-Brain Barrier, Is Compromised in Patients with Mild Alzheimer Disease
- Role of P-Glycoprotein in the Distribution of the HIV Protease Inhibitor Atazanavir in the Brain and Male Genital Tract
- Induction of P-Glycoprotein by Antiretroviral Drugs in Human Brain Microvessel Endothelial Cells
- Transporters and Drug-Drug Interactions: Important Determinants of Drug Disposition and Effects
- Modeling Cyclosporine A Inhibition of the Distribution of a P-Glycoprotein PET Ligand, 11C-Verapamil, into the Maternal Brain and Fetal Liver of the Pregnant Nonhuman Primate: Impact of Tissue Blood Flow and Site of Inhibition
- The controversial role of ABC transporters in clinical oncology
- A Novel Positron Emission Tomography Imaging Protocol Identifies Seizure-Induced Regional Overactivity of P-Glycoprotein at the Blood-Brain Barrier
- Multiagent PET for Risk Characterization in Sarcoma
- A Pilot Study to Assess the Efficacy of Tariquidar to Inhibit P-glycoprotein at the Human Blood-Brain Barrier with (R)-11C-Verapamil and PET