


Abstract
Studies in animals and postmortem human brain tissue support a role for P-glycoprotein in clearance of cerebral β-amyloid across the blood–brain barrier (BBB). We tested the hypothesis that BBB P-glycoprotein activity is diminished in Alzheimer disease (AD) by accounting for an AD-related reduction in regional cerebral blood flow (rCBF). Methods: We compared P-glycoprotein activity in mild-AD patients (n = 9) and cognitively normal, age-matched controls (n = 9) using PET with a labeled P-glycoprotein substrate, 11C-verapamil, and 15O-water to measure rCBF. BBB P-glycoprotein activity was expressed as the 11C-verapamil radioactivity extraction ratio (11C-verapamil brain distributional clearance, K1/rCBF). Results: Compared with controls, BBB P-glycoprotein activity was significantly lower in the parietotemporal, frontal, and posterior cingulate cortices and hippocampus of mild AD subjects. Conclusion: BBB P-glycoprotein activity in brain regions affected by AD is reduced and is independent of rCBF. This study improves on prior work by eliminating the confounding effect that reduced rCBF has on assessment of BBB P-glycoprotein activity and suggests that impaired P-glycoprotein activity may contribute to cerebral β-amyloid accumulation in AD. P-glycoprotein induction or activation to increase cerebral β-amyloid clearance could constitute a novel preventive or therapeutic strategy for AD.
The neuropathologic hallmarks of Alzheimer disease (AD) are regional deposition of amyloid plaques, neurofibrillary tangles consisting of hyperphosphorylated τ protein, inflammation, and neurodegeneration, particularly in the parietal and temporal cortices, hippocampus, and amygdala (1). Clinically useful disease-modifying treatments for AD have been elusive. Approved drug therapies, although providing some symptomatic benefits, do not alter the fundamental course or outcome of the disease, adding impetus for research on new mechanisms of disease pathogenesis that might lead to novel therapeutic approaches. The substantial current investment in the development of therapeutic strategies aimed at modifying β-amyloid accumulation (2) has been justified by evidence that deficient β-amyloid clearance, a process known to be impaired in AD (3–6), is associated with toxic neuronal (7) and vascular (8–10) effects and irreversible neurodegeneration.
Studies on mouse models of AD have demonstrated that endogenous P-glycoprotein plays a decisive role in β-amyloid clearance from the central nervous system. Compared with wild-type mice, P-glycoprotein knockout mice have a 50% decrease in in vivo cerebral clearance of labeled β-amyloid 40 and 42 (3). In addition, the brain interstitial concentration of β-amyloid in hAPP transgenic mice (an animal model for AD) is increased by a selective P-glycoprotein inhibitor (3) but decreased by a P-glycoprotein inducer (4). Furthermore, the progeny of hAPP/P-glycoprotein knockout mice accumulate β-amyloid in the brain more extensively than do the progeny of hAPP/P-glycoprotein wild-type mice (3). In hippocampal tissue from AD brain, β-amyloid deposition is higher and P-glycoprotein expression lower than in age-matched control tissue (11). On the basis of these compelling data, we hypothesized that P-glycoprotein activity at the blood–brain barrier (BBB) is compromised in mild-AD patients. Recently, van Assema et al. addressed this question using (R)-11C-verapamil and PET imaging to measure P-glycoprotein activity at the BBB in mild to moderately demented AD patients (12). Our work improves on this prior report by simultaneously measuring regional cerebral blood flow (rCBF) using 15O-water in addition to 11C-verapamil to measure regional P-glycoprotein function. Because rCBF is reduced in areas affected by AD, its measurement is necessary to evaluate 11C-verapamil kinetics as a measure of regional P-glycoprotein function at the BBB (13). Here, we report the results of a PET imaging study to test this hypothesis in mild-AD patients using a combination of 15O-water and 11C-verapamil to measure P-glycoprotein activity at the human BBB, an approach we have successfully used previously in other settings (13,14).
MATERIALS AND METHODS
Subjects
Eighteen older adults (9 with normal cognition, 9 with mild AD) were studied after we had obtained written informed consent (from legal next of kin for AD patients). The procedures were approved by the University of Washington Institutional Review Board and the Radiation Safety and Radioactive Drug Research committees. The subjects were classified according to the Alzheimer Disease Research Centers Uniform Dataset after exclusion of any who had major medical comorbidities or were taking systemic drugs or herbal products that induce, inhibit, or act as substrates for P-glycoprotein and after surgical brain lesions and stroke had been ruled out by unenhanced brain MR imaging. AD subjects had been taking a stable therapeutic dose of cognition-enhancing medication (a cholinesterase inhibitor or memantine) for at least 12 wk at the time of the study. Sample size calculations, based on our study on healthy volunteers (aged 20–50 y) (15), assumed a difference of at least 50% in BBB P-glycoprotein activity between AD and control subjects, because a smaller effect would not be clinically or scientifically significant. Seven subjects per group were sufficient to provide 80% power to detect this difference at an α value of 0.05.
PET Imaging
Radiosynthesis was conducted using methods we have described previously (15). Briefly, 11C-verapamil was produced by bubbling 11C-CH3I into 1–2 mg of (±) norverapamil in 0.35 mL of anhydrous acetonitrile and heating at 100°C for 5 min. The product was purified by separation on an Inertsil ODS2 (6 × 150 mm, 5 μM; GL Sciences, Inc.) column at 46°C in 35% ethanol and 65% phosphate-buffered saline by volume. The specific activity of 11C-verapamil was determined using ultraviolet absorption at 263 nm or mass spectrometry (positive electrospray) to measure μmoles per milliliter of drug product and dividing radioactivity (mCi) per milliliter by μmoles per milliliter. The specific activity of 11C-verapamil was 40,700 ± 18,500 GBq/mmol (range, 20,720–111,000 GBq/mmol) at injection. The variability in specific activity was primarily due to the time lapse between the end of bombardment and injection. The imaging protocol was similar to that we have described previously (15) except for the fact that venous blood sampling replaced arterial sampling for 12 (9 AD and 3 control) subjects, to reduce the study burden for older subjects.
Each subject first received an intravenous bolus of 15O-water (5.18 ± 0.74 MBq/kg), to measure rCBF. Brain images were acquired using an Advance PET Scanner (GE Healthcare) in 3-dimensional mode with the following sequence of time bins: 16 × 2 s, 8 × 4 s, 8 × 8 s, and 10 × 16 s. When obtained, arterial samples (1 mL each, every 15 s for the first 2 min, every 30 s for next 1.5 min, and at 4 and 5 min) were drawn manually using a Hi-Flo 5-gang, 3-way manifold (Smiths Medical). Venous samples from the contralateral arm (1 mL) were obtained every minute for 5 min. All blood samples were drawn in preweighed tubes and counted.
P-glycoprotein activity at the BBB was determined as a function of distributional clearance (K1) of 11C-verapamil radioactivity across the BBB (15,16). Approximately 15 min after 15O-water administration, 11C-verapamil (5.18 ± 1.11 MBq/kg, 0.06 ± 0.03 μg/kg) was administered intravenously as a 1-min infusion. Images were acquired using the following postinjection sequence of time bins: 16 × 5 s, 7 × 10 s, 5 × 30 s, 5 × 60 s and 5 × 120 s. Arterial samples (1 mL each when obtained; every 15 s for the first minute, every 20 s for the next 1 min, every 30 s for the next 1 min, every 1 min for the next 5 min, every 2 min for the next 4 min, and finally at 15 and 20 min) and venous samples (1 mL at 1, 2, 5, 10, 15, and 20 min) were obtained manually. Aliquots of 200 μL of blood and 200 μL of plasma were counted for radioactivity as described previously (15).
Data Analysis
Final measurements of rCBF and P-glycoprotein activity in each subject were expressed relative to the subject’s own cerebellum CBF and 11C-verapamil K1 values. The cerebellum was used as a reference region because its CBF is unaffected by AD, the structure is large and therefore provides a reliable signal for image analysis (17–19), and it serves to account for dose variability and any bias in estimating verapamil K1 and CBF by arterial image analysis. This approach obviated the measurement of absolute arterial blood concentrations of 15O-water or 11C-verapamil for use as an input function for kinetic modeling of the data. Nevertheless, for modeling purposes, it was useful to have arterial input functions in an approximately correct Y-scale range. To do so, we estimated the arterial 15O-water and 11C-verapamil concentrations by extraction from the dynamic PET images (20) and scaled them using late venous measurements and the average arterial-to-venous ratio at pseudoequilibrium, obtained from control subjects who had both arterial and venous sampling (n = 6). An automated algorithm was used to extract the arterial time course of the tracer from image data (20). This method uses a segmentation procedure to focus on a suitable blood-pool region within the field of view. Data within this region were analyzed by a bayesian penalty optimization that accounted for spillover of activity from surrounding tissue and imperfect recovery due to limitations in scanner spatial resolution (∼4 mm). The construction of the bayesian prior distribution for arterial blood curves followed our previous approach (20) based on earlier studies that directly measured arterial blood curves by arterial catheterization (21).
PET image reconstruction and data analysis were conducted as described previously (13). Image and blood data were corrected for radioactive decay. MR images were coregistered to the PET images using PMOD, version 3.0 (PMOD Technologies). Parametric maps for rCBF and verapamil K1 were derived from the respective dynamic PET images and estimated arterial concentrations (0–2 min for 15O-water or 0–10 min for 11C-verapamil when the metabolism of verapamil in young, healthy volunteers is minimal; verapamil metabolism is further decreased in elderly subjects) (22). Parametric maps were generated by fitting a 1-tissue-compartment (Zhou general ridge regression with spatial constraint) model in PMOD Pixel-Wise Modeling (version 3.0; PMOD Technologies) to the data as described previously (16).
Individual rCBF and verapamil K1 parametric maps were coregistered with density-corrected (attenuated) PET brain images for each subject, and each set of individual parametric maps was coregistered to the Montreal Neurologic Institute standard brain using the MR imaging T1-weighted images and the PET brain transmission images as input into the FLIRT software of the Functional Magnetic Resonance Imaging of the Brain software library (http://fsl.fmrib.ox.ac.uk/fsl/fslwiki/FLIRT). rCBF and verapamil K1 parametric images were normalized to the cerebellum signal to generate rCBFc and K1c parametric maps, using an atlas-guided contour drawn to avoid regions near large blood vessels. Each pixel value of the PET images was divided by the average signal within the cerebellum-contoured region to create 2 different normalized maps. We further normalized K1c to the rCBFc (ratio of regional 11C-verapamil K1c and rCBFc) and generated statistical parametric maps grouped by regional cerebellum–normalized verapamil relative extraction ratio (ERc). The software Randomize (http://fsl.fmrib.ox.ac.uk/fsl/fslwiki/randomise) was used to perform a nonparametric voxel-by-voxel unpaired 2-tailed t test with multiple-comparison correction using the Threshold-Free Cluster Enhancement option (23) to compare PET parametric maps of AD subjects and controls (Fig. 1). Automated anatomic labeling of differences in rCBFc or ERc was done by coregistering the maps to the standard Montreal Neurologic Institute brain (24).
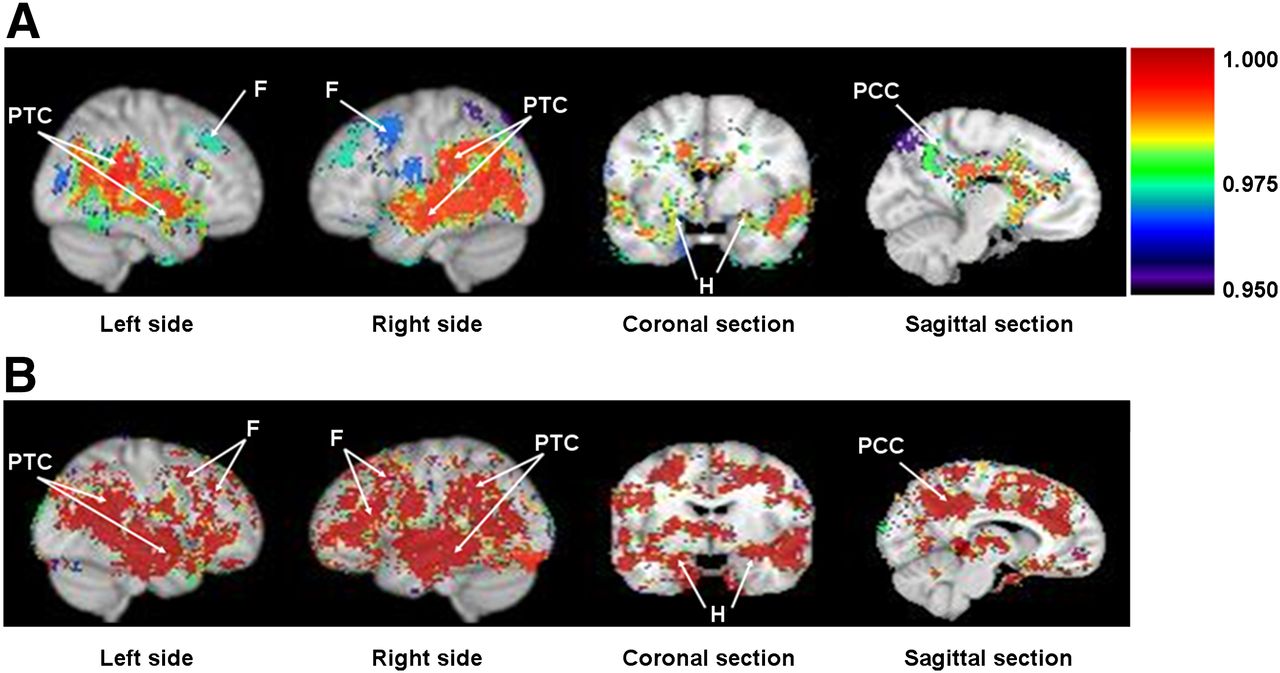
Difference in rCBFc (A) and ERc (B) in AD patients vs. controls. Grouped statistical brain parametric image comparisons (AD vs. controls) in sagittal, coronal, and midsagittal planes show significant decrease in rCBFc (A) or P-glycoprotein activity (higher ERc) (B) in parietotemporal cortex (PTC), frontal lobe (F), hippocampus (H), and posterior cingulate cortex (PCC) in AD patients. Colored statistical parametric grouped brain images are shown as threshold overlay (threshold set to 0.95, which equals P = 0.05) on top of standard Montreal Neurologic Institute brain made from 152 coregistered brains placed into standardized Montreal Neurologic Institute coordinate space. Color index is shown as probability statistical values (1 − P), with higher significance represented as higher value (i.e., lower CBFc in A and greater ERc or lower P-glycoprotein activity in B).
Region-of-Interest (ROI) Analysis
To quantify the magnitude of differences in rCBFc and ERc from the parametric approach, ROIs were contoured on the left and right parietotemporal cortices and on the cerebellum. The ROIs were drawn using the software FSLVIEW, and the anatomic location was validated on the basis of the automated anatomic labeling atlas provided by the MRIcro anatomic template (http://www.cabiatl.com/mricro/mricro/template.html). 11C-verapamil K1c and CBFc values were obtained, and ERc values were calculated for each region by normalizing K1c with CBFc as per the following equation:
Semiparametric Approach
A semiindependent confirmation of results was conducted using a semiparametric approach. Tissue time–activity curves were obtained for 15O-water and 11C-verapamil in the ROIs for cerebellum and for left and right temporal and parietal cortices. rCBF was estimated by fitting a 1-compartment flow dispersion model using estimated 15O-water arterial concentrations and the tissue time–activity 15O-water concentrations in the cerebellum or the parietotemporal cortices. Then, the cerebellum-normalized area under the curve of the 11C-verapamil concentration–time profile (AUCc, 0–10 min) was estimated for these regions. These values were normalized to the rCBFc (0–2 min) as per the following equation:
Statistics
Statistical comparisons for rCBFc and ERc data for ROI analysis (Fig. 2) and the semiparametric approach (Fig. 3) were performed using unpaired 2-tailed t tests (Prism, version 3.01; GraphPad Software, Inc.).

ROI analysis in AD patients vs. controls. ROI analysis of parametric maps shows significantly lower rCBF (A) and P-glycoprotein activity (higher ERc) (B) in temporal and left parietal cortices of AD patients vs. controls. Data are mean ± SD.

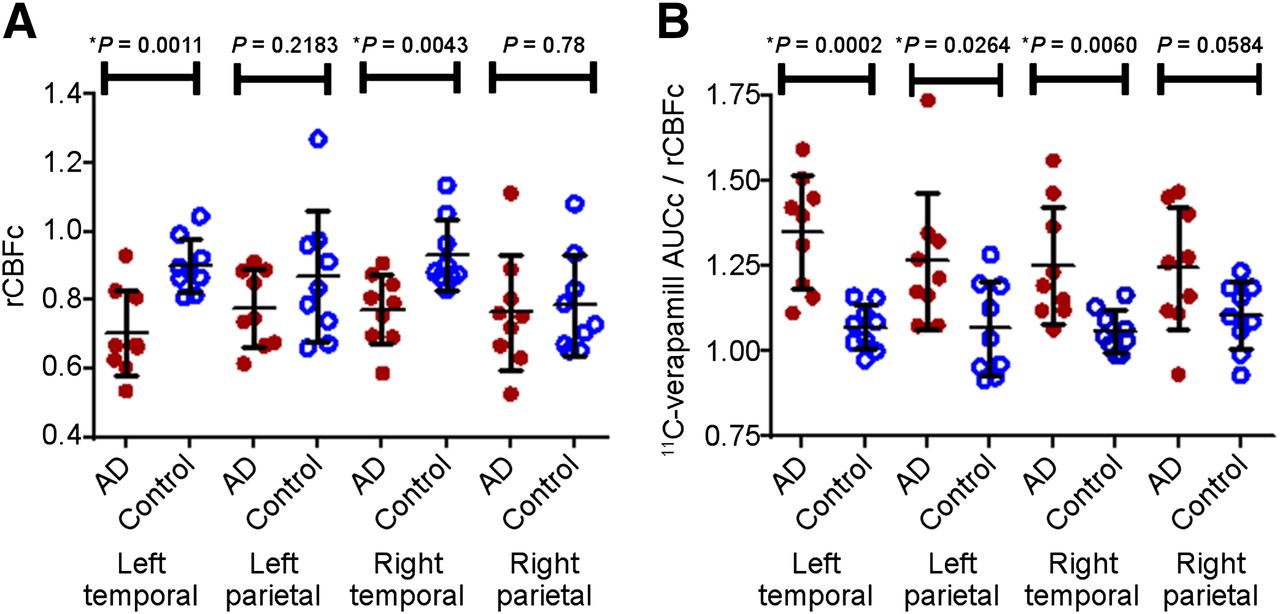
Semiparametric analysis in AD patients vs. controls. Semiparametric ROI analysis shows significant decrease in rCBFc (A) or P-glycoprotein activity (higher 11C-verapamil AUCc/rCBFc) (B) in parietotemporal cortex of AD patients vs. controls. Data are mean ± SD.
RESULTS
Subjects
The subject sample (Table 1) showed no group differences for age (P = 0.75), weight (P = 0.34), or education (P = 0.18). Cognitive (Mini-Cog and Mini-Mental State Examination) score differences between the groups (both P < 0.0001) are typical of cognitively normal subjects versus mildly demented AD subjects.
Profile of Subjects Enrolled in Study
Cerebral Blood Flow in AD Patients Versus Controls
rCBFc maps demonstrated significant regional hypoperfusion (P < 0.05) in the posterior cingulate cortex, left and right parietotemporal cortices, hippocampus, and frontal brain regions in AD versus control subjects (Fig. 1A). rCBFc was also reduced in the posterior cingulate cortex and hippocampus, regions typically affected in early AD (Fig. 1A). Pons normalization, another brain region unaffected by AD, yielded similar results.
BBB P-Glycoprotein Activity in AD Patients Versus Controls
Parametric Approach
ERc (11C-verapamil K1c/rCBFc) represents regional BBB P-glycoprotein activity (13). Because P-glycoprotein reduces net blood-to-brain clearance of verapamil (K1 or ER) across the BBB, ER is inversely related to P-glycoprotein activity. Lower P-glycoprotein activity, implying reduced ability to export β-amyloid, translates into higher ER (13). Comparison of ERc-grouped statistical parametric maps in the sagittal plane demonstrated a significant (P < 0.05) bilateral increase in verapamil ERc (i.e., our hypothesized reduction in P-glycoprotein activity) in parietotemporal and frontal lobes in AD (Fig. 1B) compared with controls. P-glycoprotein activity was also decreased in the hippocampus and posterior cingulate cortex (Fig. 1B), regions where the earliest changes in AD are observed. The decrease in P-glycoprotein activity in AD was symmetric in sagittal views of the parietotemporal cortices (Fig. 1B) but less so in frontal lobes (reduction more prominent on the left) and in coronal views of the parietotemporal cortex and hippocampus (more prominent on the right) (Fig. 1B). Not all brain regions showing reduced P-glycoprotein activity had reduced rCBFc; this discordance indicates that reduced P-glycoprotein activity cannot be attributed to regional hypoperfusion. Pons normalization yielded similar results.
To quantify the magnitude of the difference in cerebral blood flow and P-glycoprotein activity between AD and control subjects, ROI analysis was conducted on the parametric maps for the left and right parietotemporal cortices (Fig. 2). For these regions, K1c and CBFc values were obtained and ERc values were calculated by the ratio K1c/CBFc. Despite the variability, as expected, the rCBFc (Fig. 2A) and P-glycoprotein activity (ERc values) (Fig. 2B) were reduced in these brain regions of AD patients versus controls, particularly in the temporal cortex and left parietal cortex (P < 0.05). These ER values are numerically greater than unity because they are relative and not absolute values.
Semiparametric Approach
Area under the tissue time–activity curve was computed to examine cerebral verapamil distribution, a method previously shown to approximate P-glycoprotein activity at the human BBB (13,15). Despite the variability, this analysis also demonstrated decreased rCBFc in the left and right temporal cortices of the AD brain (Fig. 3A) but was less sensitive to the parietal cortical differences observed using the parametric approach. Similarly, 11C-verapamil AUCc normalized to rCBFc was significantly increased (representing reduced P-glycoprotein activity) in the left and right temporal and the left (but not the right) parietal cortices in AD (Fig. 3B).
DISCUSSION
P-glycoprotein activity was reduced by nearly 50% in the parietotemporal and posterior cingulate cortices (Fig. 1), regions that constitute an AD signature in PET studies measuring either rCBF (25–28) or metabolic activity (29,30). P-glycoprotein activity in the hippocampus and left frontal cortex was also reduced, consistent with known pathologic changes and metabolic imaging studies in AD (31–33). These findings support investigation of deficient P-glycoprotein activity as a possible pathogenic mechanism in AD and call for studies of individuals in the presymptomatic phases of the disease. If P-glycoprotein activity is reduced during the early phases of amyloid accumulation, before neurodegenerative changes have become extensive and irreversible, therapies targeting enhancement of endogenous P-glycoprotein activity could become a new focus for drug development.
Measurement of rCBF is important for accurate estimation of regional P-glycoprotein activity at the BBB when distribution clearance of 11C-verapamil into the brain is used as an index of BBB P-glycoprotein activity. Lipophilic P-glycoprotein PET ligands, including verapamil, are highly extracted by brain tissue when P-glycoprotein activity is absent or diminished, and therefore its distribution clearance (K1) into the brain is sensitive to changes in rCBF (15,34). Accurate estimation of P-glycoprotein activity at the BBB in AD, where rCBF is not constant across brain regions, depends on measuring the ER of verapamil (13). If K1 is used instead, P-glycoprotein activity could appear constant even when reduced, since in the absence of changes in rCBF, reduced P-glycoprotein activity should result in higher K1. But, in AD, this change in K1 will be nullified or limited by disease-related regionally reduced blood flow. When ER is used as a measure of P-glycoprotein activity, reduced blood flow is accounted for and regions having reduced activity will be correctly reported by a higher ER. That is, the use of ER as the measure of P-glycoprotein activity at the BBB effectively addresses the confounding effect of regional differences in perfusion seen in AD. Further, normalizing K1c to rCBFc and generating ERc-grouped statistical parametric maps made comparisons of AD and control ERs more stringent. We confirmed the above parametric analysis with a semiparametric approach and verified that kinetic modeling of verapamil did not introduce bias.
A nonspecific regional increase in BBB permeability to 11C-verapamil is not likely to explain our observation of increased regional 11C-verapamil ERc in AD patients, because overall BBB permeability is not strongly affected by AD (35). We observed an apparent dissociation between reduced P-glycoprotein activity and regional hypoperfusion in wide areas of brain in AD. This is a novel finding and suggests that, at the least, P-glycoprotein activity and rCBF report different aspects of the disease. If compromised P-glycoprotein activity proves to be part of the early pathogenetic cascade of AD, it could become a target for future novel therapeutics. van Assema et al. published a study testing the same hypothesis as proposed here but using (R)-11C-verapamil in patients with mild to moderate AD (12). On the basis of their finding, using a 2-compartment model, that the binding potential (k3/k4) of (R)-11C-verapamil in the brains of subjects with mild to moderate AD was greater than that in age-matched healthy controls, they concluded that the functioning of P-glycoprotein at the BBB function was reduced in AD (12). Unlike our analysis using a 1-compartment model and a short scanning time (over a period of 10 min, when >80% of the radioactivity in the plasma is unmetabolized verapamil (16)), they used an extended imaging time (60 min), during which an increasing fraction of blood radioactivity (≤50%) represents labeled metabolites (36), a problem that can confound interpretation of imaging data (16). In addition, we have previously shown that k3 and k4 are poorly estimated and likely to be confounded by binding of verapamil or metabolites to yet-unidentified brain constituents that might differ between AD patients and controls (e.g., amyloid plaques). Our approach improves on the analysis by van Assema et al. (12) by accounting for the perfusion dependence of verapamil distribution and correcting for the confounding effect of regional differences in perfusion seen in AD. As expected, and consistent with our data, they found no difference in K1, the distributional clearance of 11C-verapamil across the BBB in AD. Though we agree with van Assema et al. that P-glycoprotein activity is compromised in regions affected by AD (e.g., parietal and temporal cortex), there are important differences between their findings and ours. They found decreased P-glycoprotein activity in regions not typically affected in mild-to-moderate AD (e.g., occipital cortex) (30,33) and failed to observe diminished activity in brain regions uniformly involved early in the disease process (e.g., medial temporal lobe or hippocampus).
To our knowledge, our data, obtained using analytic methods not confounded by disease-related differences in rCBF, are the first to demonstrate decreased P-glycoprotein activity at the BBB in brain regions typically affected in mild AD. We cannot determine whether decreased P-glycoprotein activity plays a primary pathogenic role in reducing cerebral clearance of β-amyloid or whether accumulation of β-amyloid, or other pathologic events in AD, results in reduced BBB P-glycoprotein activity (37). Irrespective of any causal relationship, the end result is expected to be a reduction in cerebral clearance of β-amyloid. Increasing the cerebral clearance of β-amyloid by inducing or activating BBB P-glycoprotein activity could constitute a novel therapeutic target to restore central nervous system β-amyloid homeostasis in patients with AD. Potent inducers of P-glycoprotein such as rifampin and dexamethasone are Food and Drug Administration–approved prescription drugs, and others are available over the counter (e.g., St. John’s wort). Although these drugs can induce intestinal P-glycoprotein activity (38,39), it is not clear whether their systemic concentrations would be sufficient to induce P-glycoprotein at the BBB. Studies to address this question are ongoing in our laboratory. If P-glycoprotein is found to be inducible at the BBB in AD, the next critical questions will be whether such treatment can arrest progression of the disease and at what point in the disease evolution it should be initiated (40).
CONCLUSION
BBB P-glycoprotein activity in brain regions affected by AD is reduced, and this reduction is independent of rCBF. These data suggest that impaired P-glycoprotein activity may contribute to cerebral β-amyloid accumulation in AD. P-glycoprotein induction/activation to increase cerebral β-amyloid clearance could constitute a novel preventive or therapeutic strategy for AD.
DISCLOSURE
The costs of publication of this article were defrayed in part by the payment of page charges. Therefore, and solely to indicate this fact, this article is hereby marked “advertisement” in accordance with 18 USC section 1734. This study was supported by grants from AHAF (A2007-086), the National Institute of Aging (031485), NCRR (TL1 RR 025016), and the ITHS TL1 Multidisciplinary Predoctoral Clinical Research Training Program (PHS2271). No other potential conflict of interest relevant to this article was reported.
Acknowledgments
We thank Michelle Wanner, Pam Phan, Jeff Stevenson, Steve Shoner, and Xuehi Li (Department of Radiology, University of Washington); Li Liu and Brian Kirby (Department of Pharmaceutics, University of Washington); and Mary Lessig (Department of Psychiatry and Behavioral Sciences) for their technical assistance.
Footnotes
Published online May 19, 2014.
- © 2014 by the Society of Nuclear Medicine and Molecular Imaging, Inc.
REFERENCES
- Received for publication July 31, 2013.
- Accepted for publication March 17, 2014.


Jump to section
Related Articles
Cited By...
- Single-cell multi-region dissection of brain vasculature in Alzheimers Disease
- Transport of Alzheimers Associated Amyloid-{beta} Catalyzed by P-glycoprotein
- Imaging P-Glycoprotein Induction at the Blood-Brain Barrier of a {beta}-Amyloidosis Mouse Model with 11C-Metoclopramide PET
- Zonation-dependent single-endothelial cell transcriptomic changes in the aged brain
- Region-specific blood-brain barrier transporter changes leads to increased sensitivity to amisulpride in Alzheimers disease
- Alzheimers disease: A matter of blood-brain barrier dysfunction?
- Rapid in vivo measurement of {beta}-amyloid reveals biphasic clearance kinetics in an Alzheimers mouse model
- Clinical Applications of Simultaneous PET/MR Imaging Using (R)-[11C]-Verapamil with Cyclosporin A: Preliminary Results on a Surrogate Marker of Drug-Resistant Epilepsy
- A{beta}40 Reduces P-Glycoprotein at the Blood-Brain Barrier through the Ubiquitin-Proteasome Pathway
- Role of (Drug) Transporters in Imaging in Health and Disease