


Article Figures & Data
Figures
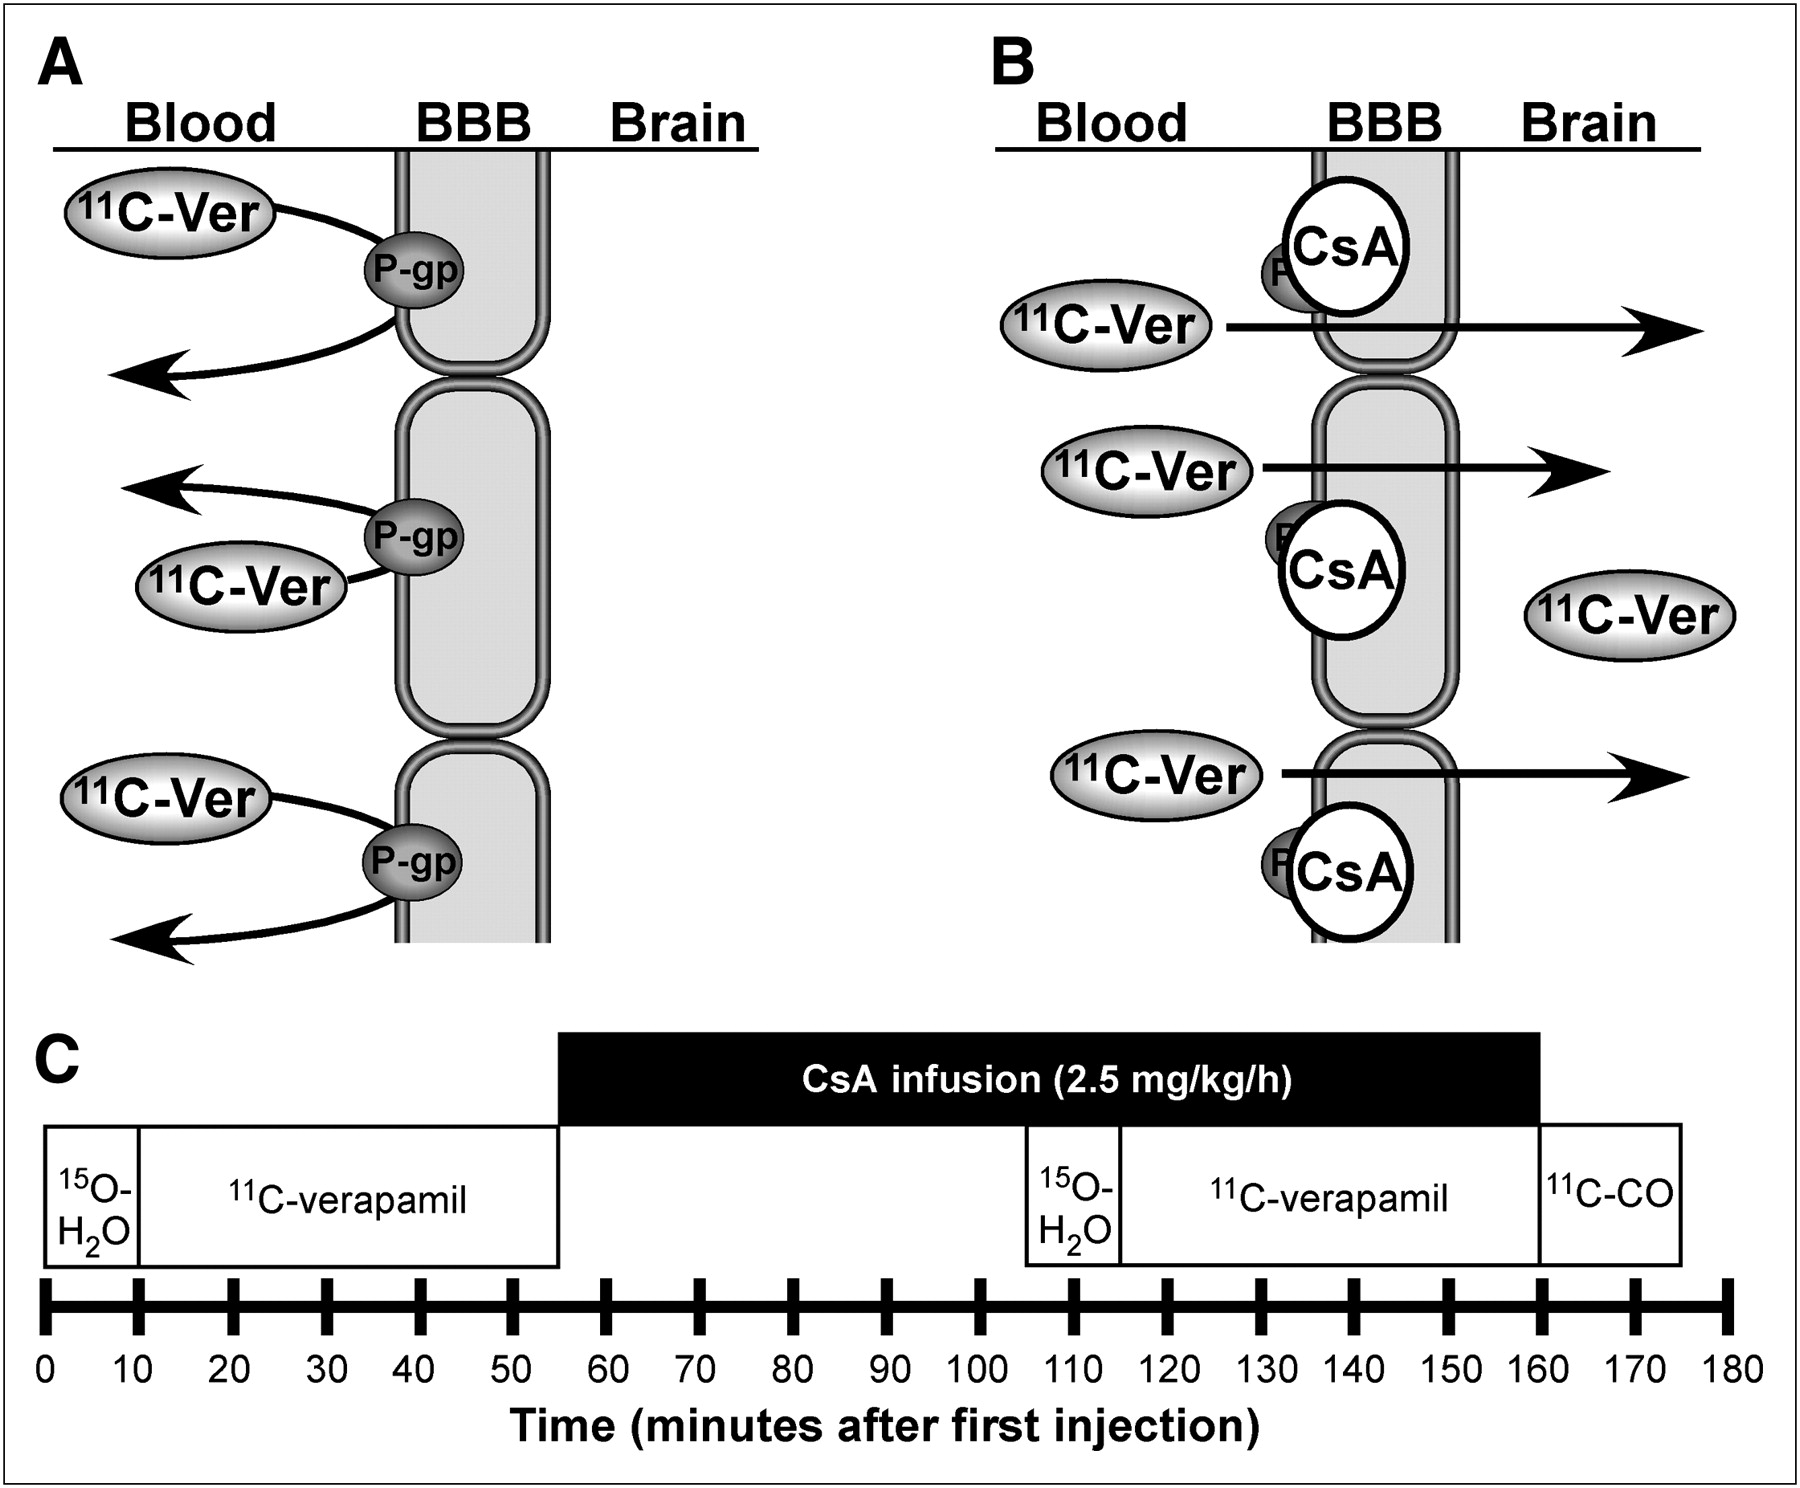
- FIGURE 1.
(A) P-gp, which acts on a wide range of xenobiotic agents, is an adenosine triphosphate–dependent efflux pump involved in multiple-drug resistance. P-gp enables secretory excretion from the BBB, acting on substrates such as 11C-verapamil. (B) In our experiment, P-gp inhibitor CsA binds to P-gp and inhibits both drug efflux activity and verapamil binding. PET of 11C-verapamil before and during CsA administration allows estimation of inhibition of P-gp by CsA directly in humans by determining 11C-verapamil transport in brain. (C) PET timeline for 5-injection protocol to assess 11C-verapamil uptake in human brain before and after administration of P-gp modifier CsA.
- FIGURE 2.
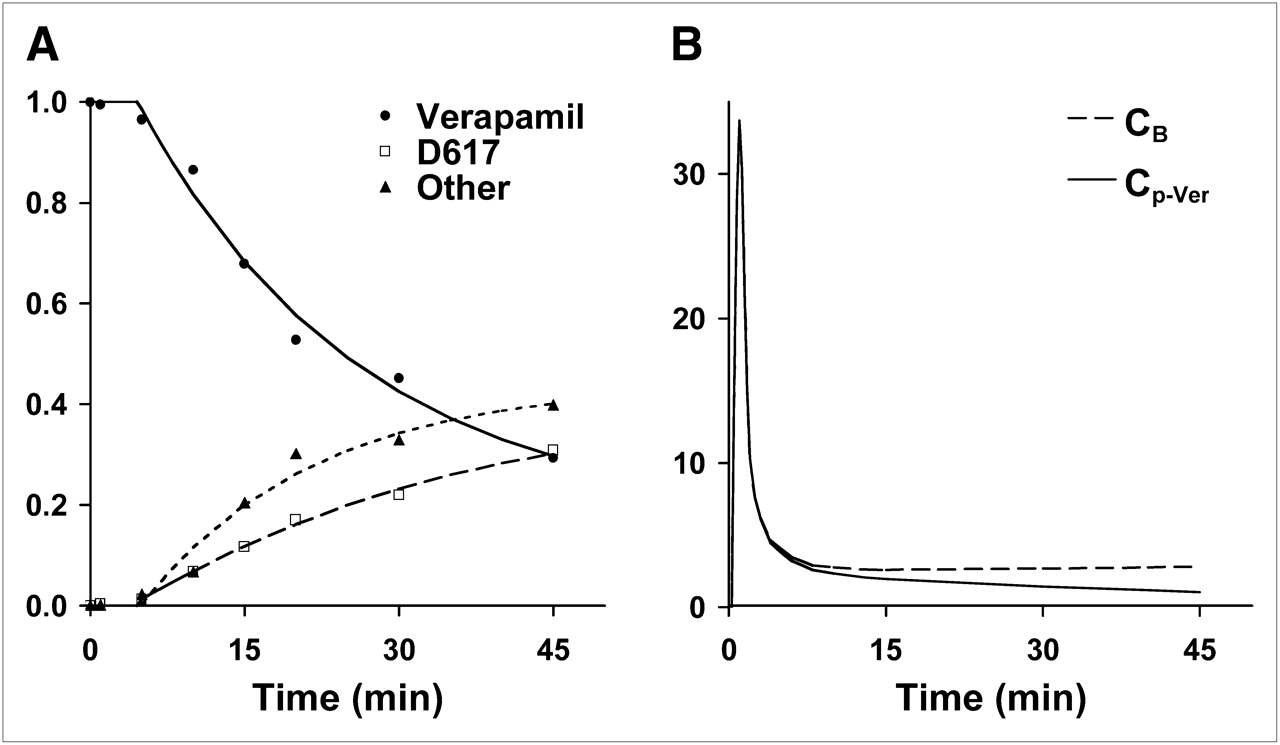
(A) Verapamil in blood declined rapidly to an average of 37% on average at 45 min after injection. In this subject example, exponential washout function (—) fit to verapamil measurements (•) provided fraction of verapamil as a function of time. Metabolites of verapamil in plasma, D617 fraction (▴) and other, polar metabolites (▪) continually rose during imaging study, reaching a combined total metabolite fraction of over 60%. (B) Verapamil model input function, Cp-Ver, is a combination of total blood activity, CB, and the fraction of verapamil determined from plasma metabolite analysis. Similar curves were obtained for all 12 subjects. Mean verapamil fraction at 45 min was 40% (range, 66%−24%), D617 fraction was 30% (range, 49%−17%), and other metabolites were 30% (range, 44%−16%).
- FIGURE 3.
Compartmental models of verapamil uptake for assessing P-gp activity at the BBB. (A) 2C model accounts for verapamil transport (K1) and overall retention in brain and is kinetically described by 2 differential equations expressing the quantity of verapamil in exchangeable compartment (Qe) and in retained compartment (Qr): dQe/dt = K1Cp-Ver − k2Qe − k3Qe + k4Qr and dQr/dt = k3Qe − k4Qr. Total tissue uptake (Ct) is then Ct = (Qe + Qr + VbCB)ρ, where ρ is tissue density in grams per milliliter, and Vb is measured fractional blood volume in milliliters per gram. (B) 1C model using 10 min of data can closely approximate transport parameter, K1 of 2C model using 45 min of data, and can be formulized as Ct = (Qe + VbCB)ρ, where dQe/dt = K1Cp-Ver − k2Qe.
- FIGURE 4.
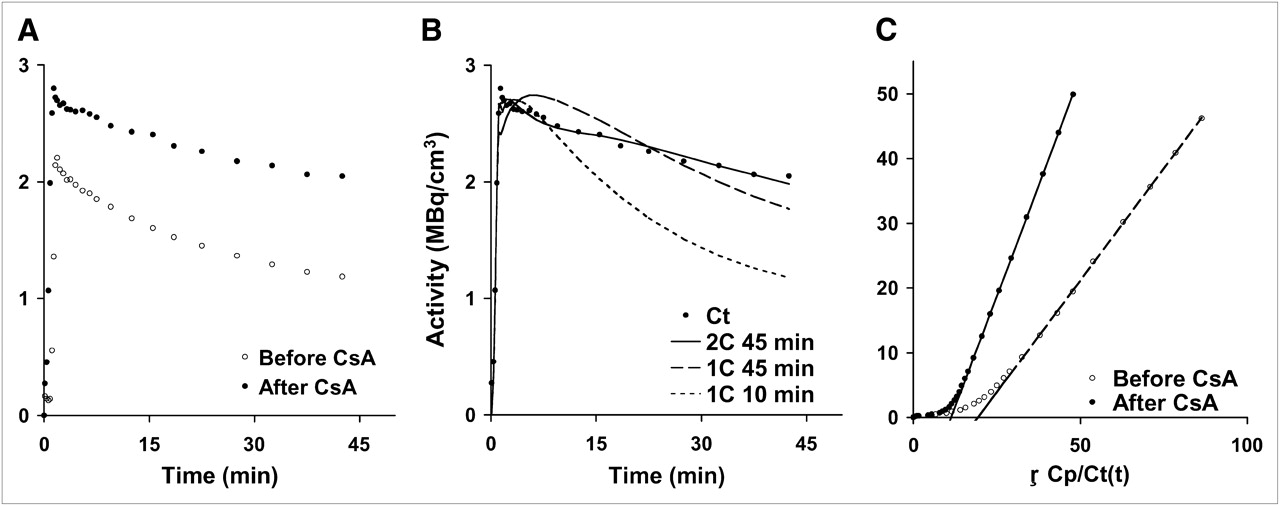
(A) Brain time–activity curves for 11C-verapamil before and after CsA treatment illustrate differences in uptake after administration of CsA. (B) A representative brain time–activity curve (Ct) was fitted using a simple 1C model with 45 min of data (1C45), the initial 10 min of data (1C10), and the 2C model. (C) Logan plot analysis is the brain time–activity curve normalized for blood activity, where the slope (VdLogan) is the ratio of integral tissue activity over integral blood activity similar to AUCR analysis (tissue AUC/blood AUC).
- FIGURE 5.
T1-weighted MR image (A) from representative subject and corresponding T2-weighted MR image (B) provide anatomic reference. (C) 11C-verapamil uptake image (SUV) before CsA treatment was acquired between 5 and 25 min after injection. (D) 11C-verapamil uptake image after 1 h of CsA infusion shows general increase in verapamil uptake in all areas of brain after inhibition of P-gp by CsA. Color scale reflects SUV as shown by thermometer.


Tables
Parameter Typical value Range for optimization K1 (mL/min/g) 0.1 0.01–0.5 k2 (mL/g) 0.2 0.01–1 k3 (min−1) 0.25 0.01–1 k4 (min−1) 0.05 0.001–0.2 2C = 2-tissue-compartment, 4–rate constant model graphically displayed in Figure 3A.
Model/input K1 (mL/g/min) K1/k2 (1/min) k3 (1/min) k4 (1/min) VdTot (mL/g) Ki (mL/g/min) k2 (1/min) Vd (1/min) VdLogan (mL/g) 2C,4P: ver* Pre-CsA mean 0.064 0.39 0.127 0.054 1.28 0.027 Pre-CsA range 0.039–0.089 0.235–0.807 0.092–0.179 0.035–0.069 0.68–2.16 0.016–0.039 Post-CsA mean 0.109 0.45 0.255 0.064 2.00 0.051 Post-CsA range 0.064–0.159 0.256–0.774 0.109–0.47 0.042–0.089 1.42–2.88 0.034–0.088 Change (%) 73 27 103 25 67 97 P 0.001 0.329 0.006 0.036 0.001 0.001 1C,2P: ver† Pre-CsA mean 0.06 0.106 0.59 Pre-CsA range 0.038–0.081 0.058–0.166 0.35–0.94 Post-CsA mean 0.099 0.097 0.98 Post-CsA range 0.056–0.135 0.073–0.119 0.63–1.53 Change (%) 69 −3 70 P 0.001 0.552 0.003 Logan plot: CB* Pre-CsA man 0.76 Pre-CsArange 0.53–0.96 Post-CsA mean 1.46 Post-CsA range 1.0–1.87 Change (%) 93 P 0.001


Jump to section
Related Articles
Cited By...
- Imaging P-Glycoprotein Induction at the Blood-Brain Barrier of a {beta}-Amyloidosis Mouse Model with 11C-Metoclopramide PET
- Synthesis and Characterization of Bodipy-FL-Cyclosporine A as a Substrate for Multidrug Resistance-Linked P-Glycoprotein (ABCB1)
- Impact of P-Glycoprotein Function on the Brain Kinetics of the Weak Substrate 11C-Metoclopramide Assessed with PET Imaging in Humans
- Characterization of P-Glycoprotein Humanized Mice Generated by Chromosome Engineering Technology: Its Utility for Prediction of Drug Distribution to the Brain in Humans
- Assessment of P-Glycoprotein Transport Activity at the Human Blood-Retina Barrier with (R)-11C-Verapamil PET
- Strategies to Inhibit ABCB1- and ABCG2-Mediated Efflux Transport of Erlotinib at the Blood-Brain Barrier: A PET Study on Nonhuman Primates
- Clinical Applications of Simultaneous PET/MR Imaging Using (R)-[11C]-Verapamil with Cyclosporin A: Preliminary Results on a Surrogate Marker of Drug-Resistant Epilepsy
- Imaging the Impact of the P-Glycoprotein (ABCB1) Function on the Brain Kinetics of Metoclopramide
- Modulation of P-glycoprotein at the Human Blood-Brain Barrier by Quinidine or Rifampin Treatment: A Positron Emission Tomography Imaging Study
- Role of (Drug) Transporters in Imaging in Health and Disease
- Activity of P-Glycoprotein, a {beta}-Amyloid Transporter at the Blood-Brain Barrier, Is Compromised in Patients with Mild Alzheimer Disease
- Role of P-Glycoprotein in the Distribution of the HIV Protease Inhibitor Atazanavir in the Brain and Male Genital Tract
- Induction of P-Glycoprotein by Antiretroviral Drugs in Human Brain Microvessel Endothelial Cells
- Transporters and Drug-Drug Interactions: Important Determinants of Drug Disposition and Effects
- Modeling Cyclosporine A Inhibition of the Distribution of a P-Glycoprotein PET Ligand, 11C-Verapamil, into the Maternal Brain and Fetal Liver of the Pregnant Nonhuman Primate: Impact of Tissue Blood Flow and Site of Inhibition
- The controversial role of ABC transporters in clinical oncology
- A Novel Positron Emission Tomography Imaging Protocol Identifies Seizure-Induced Regional Overactivity of P-Glycoprotein at the Blood-Brain Barrier
- Multiagent PET for Risk Characterization in Sarcoma
- A Pilot Study to Assess the Efficacy of Tariquidar to Inhibit P-glycoprotein at the Human Blood-Brain Barrier with (R)-11C-Verapamil and PET