


Abstract
P-glycoprotein in the blood–brain barrier (BBB) has been found to be associated with several types of neurologic damage. 11C-Verapamil has been used for in vivo imaging of P-glycoprotein function in the BBB by PET, but metabolites in plasma complicate the quantitative analysis of human studies. In this study, we validated the quantification methods of 11C-verapamil transfer from plasma to the brain in humans. Methods: The transfer rate constant from plasma to the brain, K1, was estimated by nonlinear least squares (NLS) with a 2-input compartment model, including the permeation of the main metabolite in plasma at the BBB, and with a 1-input compartment model using only 15-min data that contained little metabolite in plasma. K1 was also estimated by graphical analysis of an integration plot that uses only early-time data, before the appearance of metabolites, and the estimated K1 was compared with that obtained by the NLS method. In the simulation study, the reliability of parameter estimates in the graphical analysis method was investigated for various values of rate constants, time ranges of parameter estimations, and noise levels. Results: 11C-Verapamil in plasma gradually converted to its metabolites, and about 45% of the radioactivity in the plasma specimen was associated with 11C-verapamil metabolites at 30 min after injection. Although K1 estimated from graphical analysis was slightly smaller than that by NLS, there was strong correlation among the K1 values obtained by these 3 methods. In the simulation study, for graphical analysis, the differences between the true and mean of K1 estimates became larger and the coefficient of variation (COV) of K1 estimates became smaller as the end time of linear regression became later. The COV of graphical analysis was almost equal to that of NLS with the 1-input compartment model. Conclusion: The transfer of 11C-verapamil from plasma to the brain was able to be quantitatively estimated by graphical analysis because this method can provide K1 from the data of the initial few minutes without considering the effect of the metabolites in plasma.
P-glycoprotein (P-gp) is found at cell membranes of various organs, and functions as an efflux pump hampering the invasion of toxic compounds into the cells (1–4). P-gp is also expressed at the blood–brain barrier (BBB), a functional barrier between blood and brain interstitial space formed by a continuous endothelial lining of cerebral capillaries, and plays indispensable roles as one of the barrier functions in BBB (5–8). In addition to its pharmacologic importance, P-gp in BBB was recently found to be associated with several neurologic disorders (9,10).
11C-Verapamil has been used for in vivo neuroimaging of the brain by PET, representing a potent tool for imaging the function of P-gp (11–14). Some investigators analyzed the kinetics of 11C-verapamil by the distribution volume (DV) estimated from the graphical analysis developed by Logan et al. (15) in rodents, reporting that the DV was increased by the pretreatment of cyclosporin A (CsA), a P-gp inhibitor (16,17). In a human study, Sasongko et al. demonstrated that the ratio of the area under the curve of brain to that of blood was increased in the presence of CsA (18), and Kortekaas et al. reported that the uptake of 11C-verapamil as evaluated by the DV with the graphical analysis of Logan et al. was elevated in the midbrain of Parkinson's disease patients as compared with control subjects (19). On the other hand, Lee et al. evaluated the transfer of 11C-verapamil from blood to brain with the graphical analysis using early-time data, the so-called integration plot, in rhesus monkeys with or without treatment of a P-gp inhibitor, PSC833, demonstrating that the brain uptake of 11C-verapamil was increased after the PSC833 treatment (20). Moreover, Muzi et al. estimated the rate constant of 11C-verapamil transfer to the brain, K1, with 1- and 2-tissue compartment models in healthy volunteers, reporting that K1 increased in the presence of the P-gp inhibitor CsA (21). This means that the initial brain uptake of 11C-verapamil can be an indicator of the P-gp activity at the BBB. However, Sasongko et al. reported that the plasma radioactivity of verapamil was approximately 35%, that of the main metabolite D-617 was 20% at 45 min, and that D-617 and several other minor metabolites might contribute to the image (18). Although these metabolites in plasma complicate the quantitative analysis, validation of these kinetic analysis methods for 11C-verapamil has not been sufficiently confirmed in humans.
In this study, we evaluated the quantitative analysis methods to estimate the transfer of 11C-verapamil from plasma to the brain in healthy volunteers, and the reliability of the estimated parameters was investigated by computer simulation.
MATERIALS AND METHODS
Subjects
Ten subjects (age range, 20–31 y; mean age ± SD, 23.8 ± 3.3 y) participated in this study. All volunteers were free of any somatic, neurologic, or psychiatric disorders, and they had no history of current or previous drug abuse. This study was approved by the Ethics and Radiation Safety Committees of the National Institute of Radiological Sciences, Chiba, Japan, and written informed consent was obtained from each subject.
Radioligand
11C-Verapamil was synthesized from norverapamil (Eisai Co. Ltd.) as described previously (22).
PET
PET scans were performed using an ECAT EXACT 47 scanner (CTI/Siemens), which provides 47 planes and a 16.2-cm axial field of view. A transmission scan with a 3-rod source of 68Ge-68Ga was followed by a dynamic 60-min scan (15 s × 8, 30 s × 4, 60 s × 2, 120 s × 1, 240 s × 4, 360 s × 6) with a bolus injection of 629.0–856.9 MBq (mean ± SD, 746.3 ± 58.2 MBq) of 11C-verapamil. The specific radioactivities were 31.0–99.3 GBq/μmol (mean ± SD, 48.1 ± 20.6 GBq/μmol) at the time of injection. The PET data were acquired in 2-dimensional mode and the data were reconstructed by filtered backprojection using a ramp filter with a cutoff frequency of 0.5.
MRI was performed with a Gyroscan NT scanner (1.5 T) (Phillips Medical Systems) to obtain T1-weighted images of the brain.
The PET images were coregistered to MR images, and regions of interest (ROIs) were defined over the frontal, temporal, parietal, and occipital cortices, and the cerebellum with a template-based method as described by Yasuno et al. (23).
Arterial Blood Sampling
To obtain the arterial input function, an automated blood sampling system was used during the first 5 min of each PET measurement (24). The concentration of radioactivity in arterial blood was measured every second. At the same time, arterial blood samples were taken manually and their radioactive concentrations were measured 26 times during the scan. Each manually taken blood sample was centrifuged to obtain plasma and blood cell fractions, and the concentration of radioactivity in the plasma was measured. Radioactivity between PET and blood was calibrated with a cylinder phantom and 18F solution. Plasma metabolites were analyzed as follows: For the plasma fractions at 2, 4, 7, 12, 19, 29, 42, and 59 min after injection, acetonitrile was added and then centrifuged. The supernatant was analyzed for radioactive components using a high-performance liquid chromatography system (PU-610A series; GL Sciences) with a coupled bismuth germanate positron detector (25) to measure plasma 11C-verapamil metabolites. Isocratic elution was performed with a reversed-phase semipreparative Waters μBondpak C18 column (7.8 mm [inner diameter] × 300 mm). The mobile phase consisted of a mixture of acetonitrile and 0.1 mol/L ammonium acetate (70:30, v/v). The percentage of parent radioactivity was determined from the activity of the parent verapamil with respect to the total activity in the chromatogram.
Data Analysis
2-Input Compartment Model.
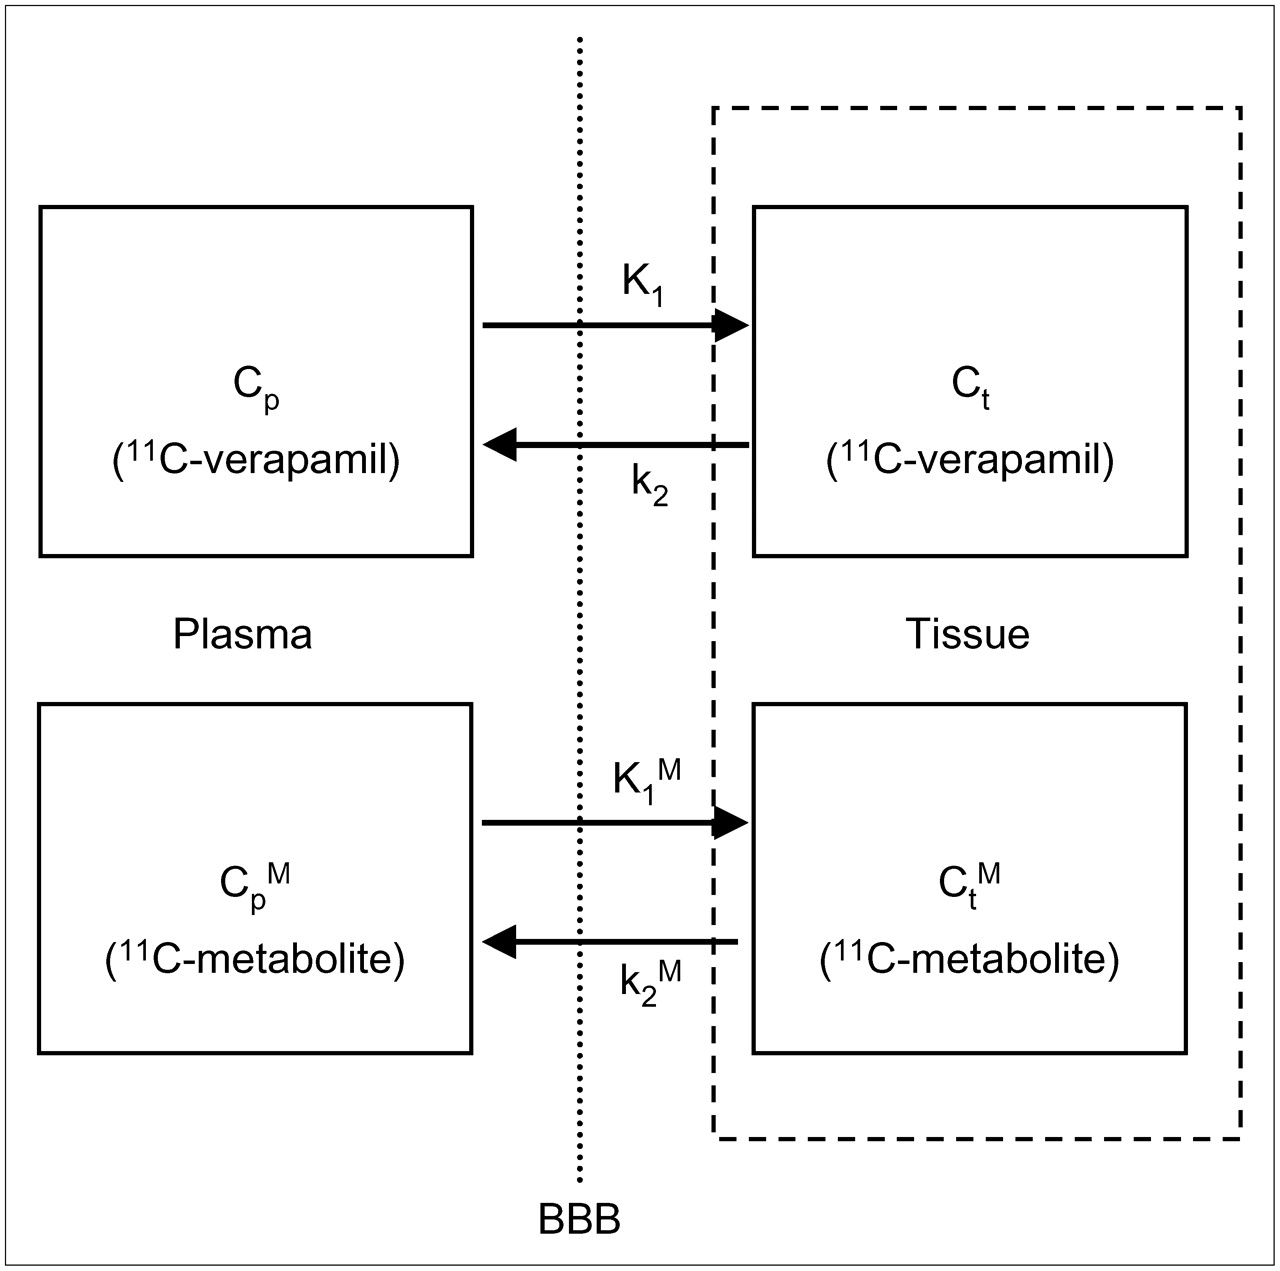
The rate constants between plasma and tissue were estimated both for unmetabolized 11C-verapamil and for the main metabolite with a 2-input, 2-tissue compartment model including transfer of the metabolite from plasma to brain (Fig. 1) (26,27). K1 describes the rate constant for transfer of 11C-verapamil from plasma to brain, k2 describes the rate constant for transfer of 11C-verapamil from brain to plasma, and K1M and k2M represent the transfer of the main metabolite between plasma and brain. The fraction of unchanged 11C-verapamil in the total plasma radioactivity was fitted by a 2-exponential expression (28), f = a × exp(–bt) + (1 – a) × exp(–ct), where f is the fraction of unchanged 11C-verapamil, and a, b, and c are the estimated parameters. A plasma curve of unchanged 11C-verapamil used as input function Cp was generated by the product of the plasma activity and the fraction curves of unchanged 11C-verapamil. Meanwhile, the fraction of the main metabolite in total plasma radioactivity was fitted by f′ = 1 – {a′ × exp(–b′t) + (1 – a′) × exp(–c′t)}, where f′ is the fraction of the main metabolite, and a′, b′, and c′ are the estimated parameters. A plasma curve of the main metabolite used as input function CpM was generated by the product of the plasma activity and the metabolite fraction curves. In this model, 5 parameters (K1, k2, K1M, k2M, blood volume [BV]) were estimated by nonlinear least squares (NLS) with iteration of the Modified Marquardt algorithm without weighting and without constraints. Parameter estimates were considered invalid if DV [= K1/k2] and DVM [= K1M/k2M were outside the range 0.0 < DV, DVM < 5.0.

The 2-input, 2-tissue compartment model including transfer of metabolite in plasma to tissue.
1-Input Compartment Model.
Rate constants between plasma and tissue—that is, K1 and k2—were also estimated with a 1-input, 1-tissue compartment model including only the transfer of unmetabolized 11C-verapamil. In this model, a plasma curve of unchanged 11C-verapamil was used as input function Cp, and 3 parameters (K1, k2, BV) were estimated by NLS in the same way as in the 2-input compartment model. NLS fitting was performed for both 60-min data and 15-min data.
Uptake Estimates with Graphical Analysis.
The rate constant of transfer from plasma to brain was estimated by the graphical analysis method with integration of plasma input versus tissue (integration plot) (20,29). In the 1-input, 1-tissue compartment model, the radioactivity concentration in the brain is given by: Eq. 1where Cp and Cb are the radioactivity concentration of unchanged 11C-verapamil in plasma and brain, respectively; K1 is the transfer rate constant from plasma to brain; and k2 is the efflux rate constant from the brain. In the early phase after administration of tracer, as efflux from the brain and metabolites in plasma is negligible, the second term is small enough to eliminate, and radioactivity concentration in the brain can be described by:
 Eq. 2When a BV component is considered, measured radioactivity concentration in the ROI is given by:
 Eq. 3where Cw(t) is the radioactivity concentration in whole blood, and BV is the blood volume. From Equations 2 and 3, K1 can be obtained by linear regression from the equation:
 Eq. 4where te is the end-time-point of linear regression in which efflux from the brain is assumed to be negligible. In this study, points of the first frame were excluded from linear regression to eliminate the large variation in time–activity curves of the brain, and (1 – BV)K1 and BV were estimated as slope and intercept, respectively, by linear regression using points of 9 frames from the second frame (mean time point = 22.5 s) to the 10th frame (mean time point = 165 s) after the injection. K1 estimated from the integration plot was compared with that from NLS with 2-input or 1-input compartment models.
Analysis of human data was implemented using MATLAB (The MathWorks) or PMOD (PMOD Technologies).
Simulation Study
The reliability of K1 estimated with the integration plot was evaluated by computer simulation. Because there was little metabolite in plasma during the initial 12 min used in the evaluation of the integration plot, simulated time–activity curves were generated according to the 1-input, 1-tissue compartment model. Time–activity curves were simulated with measured input function for various rate constants (k values: K1 = 0.03, 0.05, and 0.07; DV = 0.4, 0.7, and 1.0; BV = 0.05). The noise ratio for each frame was determined according to the collected total count of the frame (30,31). Noise was generated with random numbers based on gaussian distribution and added to the nondecaying tissue activity for each frame. In this simulation study, the noise level was adjusted to be 1%, 3%, and 5% at the 16th frame (mean time point = 10 min) of the time–activity curve with K1 = 0.05, DV = 0.7, and 1,000 noisy datasets were generated for each k value and noise level. In these noise-added time–activity curves, K1 was estimated by the integration plot with points from 15 s to 1, 2, 3, 5, 8, and 12 min, and the mean and the coefficient of variation (COV; SD/mean [%]) of estimated K1 in 1,000 runs were evaluated for each.
The simulations were performed on Dr.View (Asahi Kasei Information Systems Co.).
RESULTS
PET Studies
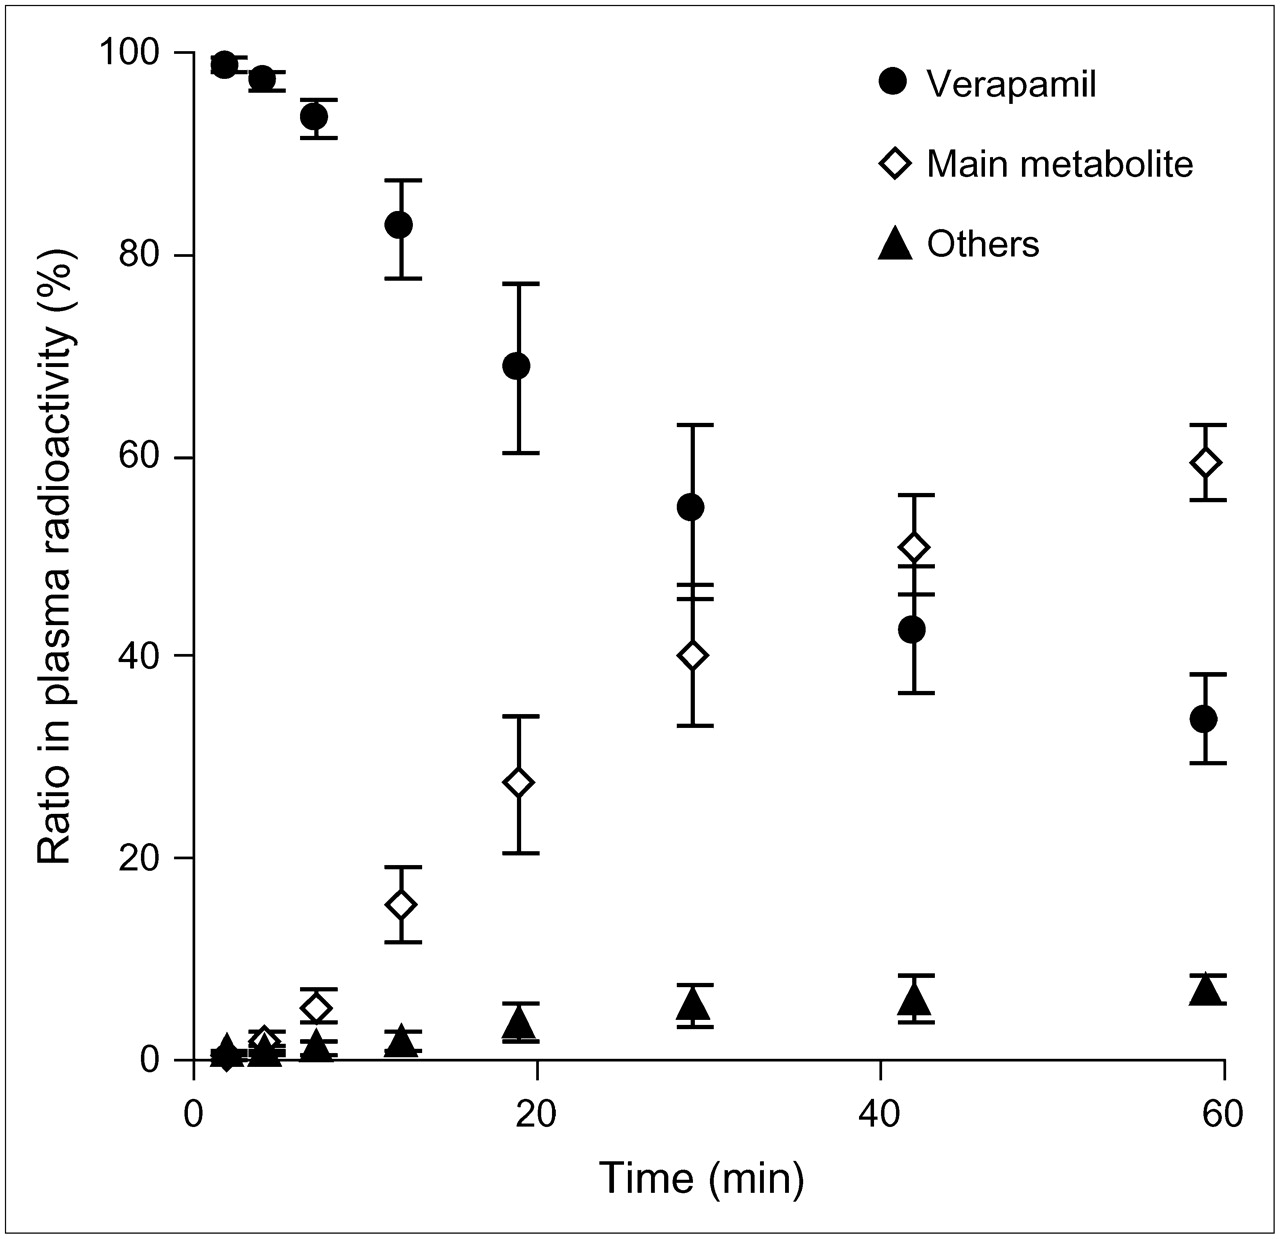
The ratios of unchanged 11C-verapamil and the main and minor metabolites in total plasma radioactivity are shown in Figure 2. The ratio of unchanged 11C-verapamil was about 94% at 7 min, 83% at 12 min, 55% at 30 min, and 35% at 60 min.

Time curve of percentage of unchanged radioligand and metabolites in total plasma radioactivity using 11C-verapamil in 10 subjects.
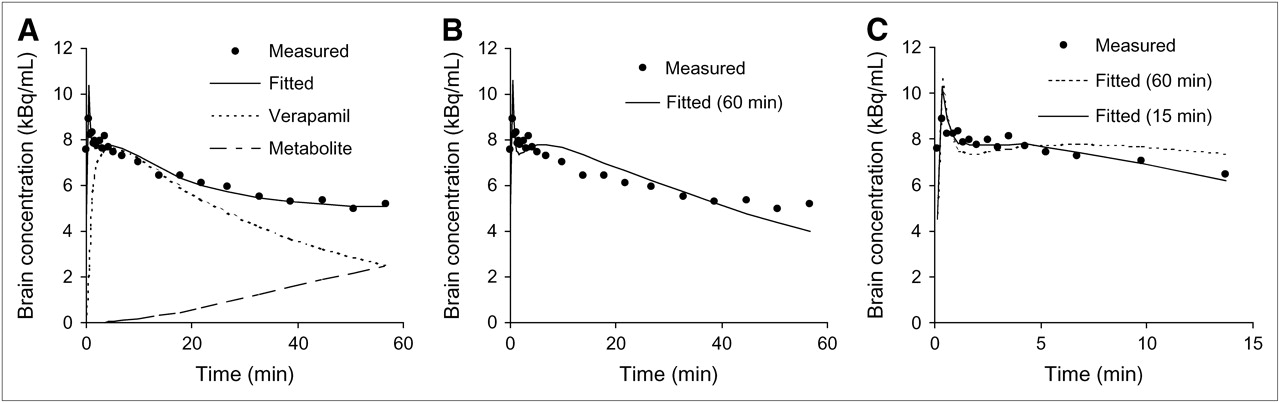
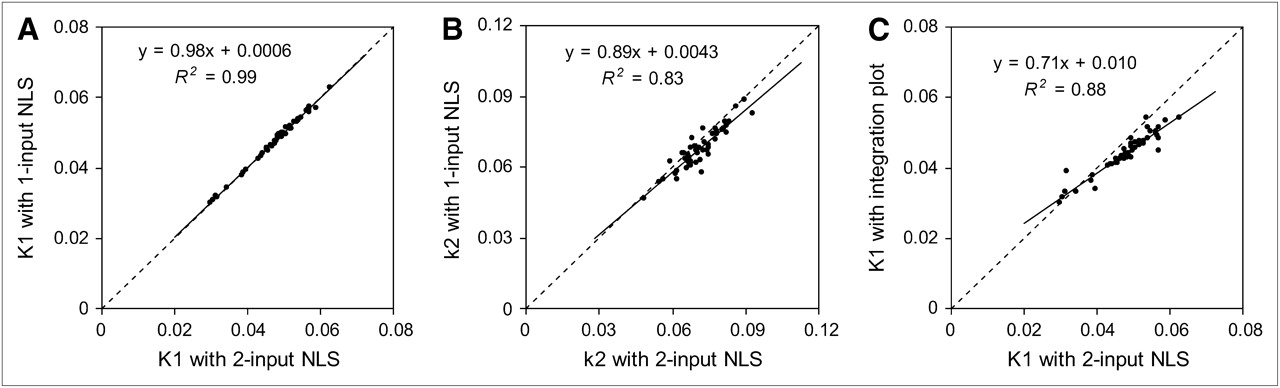
The shape of the time–activity curve was similar for all regions, and measured time–activity curves of 60 min were well described by the 2-input compartment model, taking into account the transfer from the metabolite in plasma to brain (Fig. 3A). The 1-tissue compartment model was not sufficient to describe the measured time–activity curves at 60 min for all regions of the brain (Fig. 3B), and this model was able to fit the measured time–activity curves up to 15 min (Fig. 3C). The estimated rate constants of each region are listed in Table 1. In the 2-input compartment model, K1 ranged from 0.046 (temporal) to 0.050 (occipital), K1M ranged from 0.057 (occipital) to 0.071 (temporal), and k2M ranged from 0.068 (occipital) to 0.11 (cerebellum). The COV of K1M and k2M were remarkably large. In the frontal cortex, the COV of K1M and k2M were 57% and 63%, respectively. In the 1-input compartment model by 15-min data, K1 ranged from 0.046 (temporal) to 0.049 (cerebellum). In the graphical analysis, the brain and plasma concentration data up to about 3 min were approximately linear (Fig. 4). Estimated K1 ranged from 0.043 (temporal) to 0.046 (occipital), values slightly smaller than those of NLS with the 2-input or the 1-input compartment model. There was strong correlation between the K1 and k2 values estimated with the 2-input compartment model for 60-min measured data and those with the 1-input compartment model for 15-min data (Figs. 5A and B). However, K1 values estimated from the 1-input compartment model for 60-min data were about 10% smaller than those from the 2-input compartment model. Although the K1 values estimated from the integration plot were slightly smaller than those of NLS, a strong correlation was also found between these methods (Fig. 5C).

Measured time–activity curve and fitting result with 2-input compartment model (A), with 1-input compartment model using measured data up to 60 min (B), and with 1-input compartment model using measured data up to 15 min (C) for 11C-verapamil. Symbols represent measured radioactivity concentrations in temporal cortex.
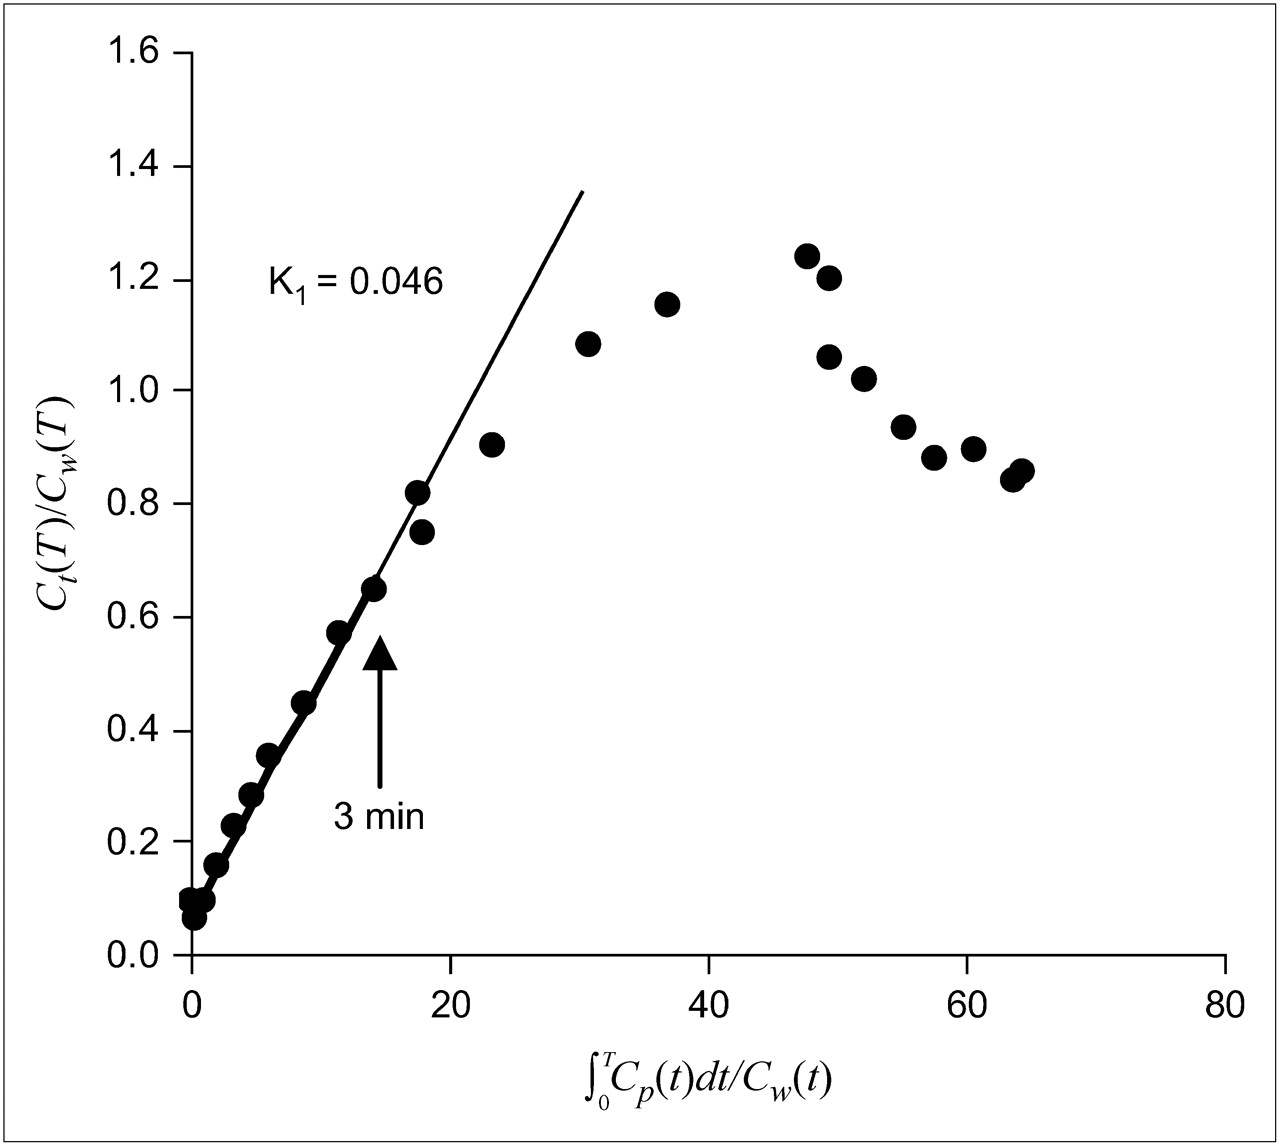
Graphical analysis of integration plot for measured time–activity curve of temporal cortex. K1 value was estimated by using points between 15 s and 3 min.

Relationship between K1 estimated from NLS with 1-input compartment model for 15-min measured data and that with 2-input compartment model for 60-min data (A), between k2 estimated from NLS with 1-input compartment model for 15-min measured data and that with 2-input compartment model for 60-min data (B), and between K1 estimated from integration plot and that from NLS with 2-input compartment model for 60-min measured data (C).
Estimated Rate Constants for 3 Methods
Simulation Study
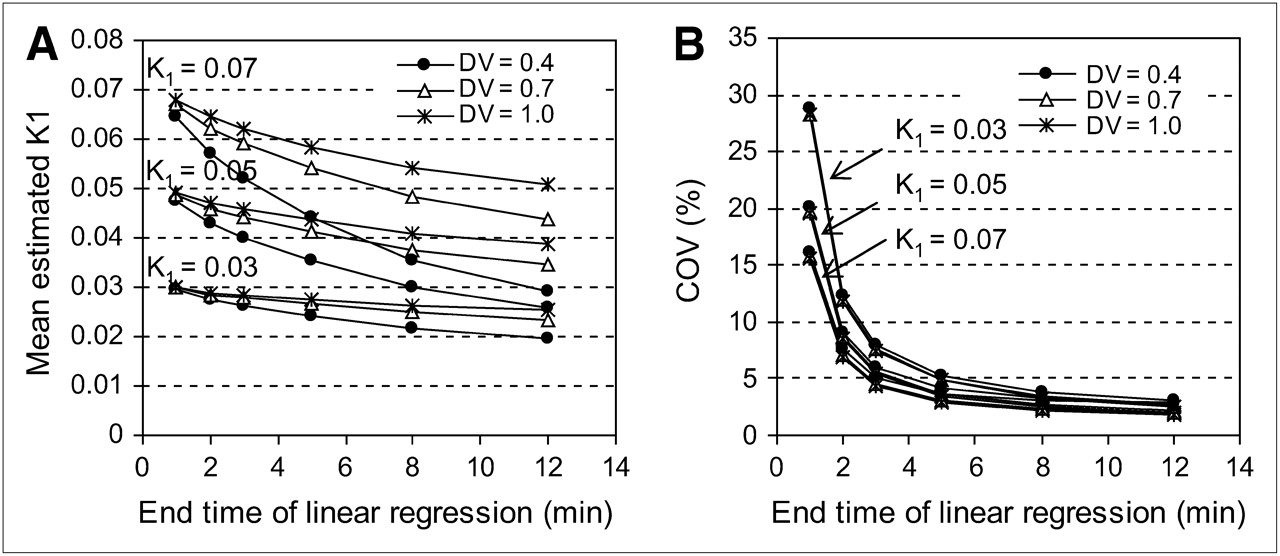
In the simulation study of the integration plot, plot points of Equation 4 began to fall from the linear line about 2 min after injection, especially in the time–activity curve with a small DV—that is, large k2. In noise-added time–activity curves, K1 was underestimated, and the difference between true and mean values of estimated K1 changed according to the end time of linear regression, becoming large when the end time was late. The difference also became large when the K1 value was large and the DV value was small, indicating that the k2 value was large (Fig. 6). However, this underestimation was independent of the noise level. Furthermore, the COV of K1 estimates became smaller as the end time of linear regression became later. The COV depended on the noise level, and it became larger as the noise level increased. When K1 was 0.05, DV was 0.7, and the end time of linear regression was 3 min, the COV of K1 estimates were 1.9% at 1% noise, 5.6% at 3% noise, and 9.3% at 5% noise. However, COV was independent of the DV value.

Relationship between mean estimated K1 of integration plot and end time of linear regression (A) and between COV of estimated K1 and end time of linear regression (B) for simulated time–activity curves with noise levels of 3% with K1 = 0.03, 0.05, and 0.07, and DV = 0.4, 0.7, and 1.0.
DISCUSSION
Effect of Metabolites in Plasma on Parameter Estimation
In the 11C-verapamil study with the 60-min scan, the time–activity curve was not described by the 1-input, 1-tissue compartment model (Fig. 3). This might be explained by the existence of radioactive metabolites in plasma passing the BBB and increasing with time. It has been reported that there was little 11C-metabolite in plasma and brain of rats 1 h after injection (13,32), whereas Lee et al. reported that the significant amount of radioactivity in plasma was associated with the form of metabolites of 11C-verapamil 1 h after injection in nonhuman primates (20). Meanwhile, Sasongko et al. (18) reported that D-617 and several other minor metabolites would retain the label and that the plasma radioactivity of verapamil was approximately 35%, that of D-617 was 20% at 45 min, and that therefore these metabolites might contribute to the image as most of these unconjugated metabolites of verapamil have been shown to be substrates of P-gp with affinity similar to that of verapamil (33). In our human study, 11C-verapamil was gradually converted to its metabolites after intravenous administration, and about 45% of the radioactivity in the plasma specimen was associated with 11C-verapamil metabolites at 30 min after injection (Fig. 2), a result consistent with that of Sasongko et al. (18). The measured time–activity curve was well described with the 2-input, 2-tissue compartment model, including the passing of the main metabolite in plasma to the brain (Fig. 3). Although the good fit of the 2-input compartment model does not represent evidence for the existence of metabolites permeating the BBB, this result suggests the possibility of the contribution of metabolites to the measured activity.
Graphical Analysis
In Equation 2, the term of BV is not included. The plots with this equation were not on the straight line even in early-time data. The value of K1 was small in the 11C-verapamil study, so the effect of BV cannot be neglected. Therefore, we modified Equation 2 to Equation 4, and the estimated BV value was valid.
Even if the metabolites in plasma pass the BBB, the K1 value estimated by the integration plot is not affected by them because the integration plot yields K1 from only early-time data, in which the plasma fraction of the unchanged form is >95%. Therefore, estimation by the integration plot does not require consideration of the effect of the metabolites, which becomes a problem in NLS with the compartment model or the graphical analysis of Logan et al. (15). Although the integration plot provides only K1, and more detailed quantification such as NLS with the compartment model is necessary to understand the overall dynamics of the tracer, it is useful in the evaluation of the difference in K1 between subjects.
However, by this method, K1 was underestimated (Fig. 5C). This underestimation may be a result of neglecting the efflux from the brain, represented as k2. Actually, the integration plot of Equation 4 contains only the time during which the efflux from the brain did not appear. When k2 is small, the effect of the efflux is negligible for a few minutes after the injection. However, when k2 is larger, the efflux cannot be negligible even for only a few minutes after the injection (Fig. 6). In the simulation study, the error of underestimation was greatly affected by the k2 value, indicating that the integration plot is not appropriate for a tracer with large k2 and regional or individual large variations of k2. In healthy volunteers, K1 estimated by the 2-input compartment model ranged from 0.046 to 0.050, k2 ranged from 0.068 to 0.077, and DV ranged from 0.64 to 0.74 (Table 1), indicating that regional differences of these parameters are small. Moreover, the COV of k2 and the DV among individuals were about 10% in all regions. In these variations of k2 and DV among regions and individuals, the difference of K1 underestimation resulting from the k2 and DV is small. The underestimation of estimated K1 in this DV value was about 10% when K1 was estimated by using points up to 3 min (Fig. 6). In the future, 11C-verapamil will be applied for various diseases and, in a case with a large k2, interpretation of the estimated K1 should be attempted with caution.
Considering the effect of the efflux across the BBB, the endpoint of linear regression should be selected as early as possible. However, too early an endpoint of linear regression brings about an estimation error caused by statistical noise in the tissue time–activity curve, especially in the time–activity curve with a high noise level. Deducing from the residual error of time–activity curve fitting by NLS, the noise level of human ROI analysis in this study was 1%–3% (31). At this noise level, the COV of graphical analysis is small enough. However, in pixel-by-pixel calculation, the noise level is large. In a time–activity curve with 20% noise at the 16th frame (mean time point = 10 min), the COV of K1 by graphical analysis with data up to 3 min was >35%, this was larger than that by NLS with 1-input compartment model. When the endpoint for linear regression was >5 min, the COV became smaller than NLS with the 1-input compartment model. However, bias of the underestimation became larger as the endpoint became later. Therefore, graphical analysis is not appropriate for pixel-by-pixel calculation.
NLS with Compartment Model
The 2-input compartment model can provide the rate constants of transfer of metabolite between plasma and brain, and the radioactivity of metabolite in brain. However, the COV of K1M and k2M were >50%, so estimated parameters without constraint are not reliable.
NLS with the 1-input compartment model can provide K1 with data from only 15 min, in which the rate of unchanged verapamil in plasma is about 80%. Therefore, the 1-tissue compartment model is also useful for the estimation of transfer from plasma to brain, K1. However, k2 cannot be estimated reliably in a short-time scan and would be greatly affected by metabolites in brain if they exist. More studies focusing on metabolites in the brain will be necessary for the evaluation of k2.
Indicator of P-gp Function in 11C-Verapamil Studies
The integration plot does not require consideration of the permeation of BBB for the metabolites. However, the integration plot provides only K1. Nevertheless, Muzi et al. reported that increase in K1 estimates in the presence of CsA in healthy volunteers was independent of blood flow and demonstrated inhibition of P-gp efflux at the BBB (21). Moreover, Lee et al. reported that the transfer of 11C-verapamil evaluated by the integration plot increased after treatment with P-gp inhibitor, PSC833, in nonhuman primates (20). Therefore, taken together, the estimation of K1 is deemed to be helpful for the assessment of P-gp function in the BBB.
CONCLUSION
The rate constant of transfer to the brain, K1, was estimated by graphical analysis of an integration plot with data points of an initial few minutes, during which the rate of unchanged verapamil in radioactivity of plasma is >95%. In human data with healthy volunteers, K1 estimated by graphical analysis correlated with that by NLS with the 2- or 1-input compartment model. In the simulation study, the COV of K1 by graphical analysis was smaller than that by other methods in the noise level of ROI analysis. The integration plot is useful for the estimation of transfer to the brain, as this method can provide K1 easily with only the data of the initial few minutes without needing to consider the permeability of metabolite in plasma.
Acknowledgments
We are grateful to Dr. Takuya Morimoto, Dr. Yota Fujimura, Dr. Miho Ota, Dr. Shoko Nozaki, Katsuyuki Tanimoto, Masaru Ohno, Takahiro Shiraishi, Akira Ando, and Chikako Hirai for their help with the PET experiment and Yoshiko Fukushima for her help as a clinical research coordinator. We also thank Chie Seki and Takehito Ito for their valuable advice. This research was partially supported by the Ministry of Education, Culture, Sports, Science and Technology, Grant-in-Aid for Young Scientists (B), 16790709, 2004–2005.
Footnotes
-
COPYRIGHT © 2006 by the Society of Nuclear Medicine, Inc.
References
- Received for publication February 8, 2006.
- Accepted for publication May 10, 2006.


Jump to section
Related Articles
Cited By...
- Avoiding Barriers to PET Radioligand Development: Cellular Assays of Brain Efflux Transporters
- Lysosomal trapping of a radiolabeled substrate of P-glycoprotein as a mechanism for signal amplification in PET
- Imaging of Cyclosporine Inhibition of P-Glycoprotein Activity Using 11C-Verapamil in the Brain: Studies of Healthy Humans
- Human Brain Imaging and Radiation Dosimetry of 11C-N-Desmethyl-Loperamide, a PET Radiotracer to Measure the Function of P-Glycoprotein
- Tariquidar-Induced P-Glycoprotein Inhibition at the Rat Blood-Brain Barrier Studied with (R)-11C-Verapamil and PET
- Evaluation of In Vivo P-Glycoprotein Function at the Blood-Brain Barrier Among MDR1 Gene Polymorphisms by Using 11C-Verapamil