About the Cover
Cover image

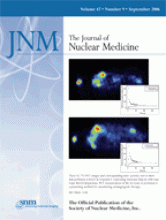
These H215O PET images and corresponding time–activity curves show that perfusion is lower in troponin I–expressing (bottom) than in wild-type (top) Morris hepatomas. PET measurement of the decrease in perfusion is a promising method for monitoring antiangiogenic therapy.
SEE PAGE 1506


