


Abstract
P-glycoprotein (P-gp) is a membrane protein that functions as an adenosine triphosphate–dependent efflux pump for xenobiotics at the blood–brain barrier (BBB). Polymorphisms of MDR1 gene have been reported to be associated with the expression level of P-gp. 11C-Verapamil is considered to be one of the suitable radioligands for evaluating P-gp functions. However, the metabolites of verapamil might complicate the quantitative analysis because of their possible brain penetration. In the present study, we investigated the P-gp functional differences at the BBB between the haplotypes (1236TT, 2677TT, 3435TT vs. 1236CC, 2677GG, 3435CC) of the MDR1 gene with different quantitative analyses of 11C-verapamil. Methods: Thirty-three healthy male volunteers were enrolled in this study after identification of the haplotypes of the MDR1 gene. Brain PET scans with 11C-verapamil were performed for 16 min. Integration plot analysis, which yields brain uptake clearance, was performed with the first 3-min data. Integration plot analysis was then compared with several other quantitative analyses with 16-min data (1-input, 1-tissue compartment model, and the area under the curve ratio (AUCratio) between brain and plasma). Results: In the integration plot, there was no difference in the absolute values of brain uptake clearance (CLuptake) between the haplotypes; CLuptake of 11C-verapamil for the haplotypes (1236TT, 2677TT, 3435TT vs. 1236CC, 2677GG, 3435CC) were 0.053 ± 0.011 and 0.051 ± 0.011 mL/g/min, respectively. CLuptake of 11C-verapamil in the integration plot was significantly correlated with K1 and DV(K1/k2) (DV is distribution volume; K1 and k2 are plasma and tissue rate constants) in the 1-input, 1-tissue compartment model and the AUCratio. Conclusion: On the basis of the several quantitative analyses of 11C-verapamil, the assumption that the function of P-gp at the BBB is different between the haplotypes (3 single nucleotide polymorphisms: C1236T, G2677T, and C3435T) of MDR1 gene was not supported.
P-glycoprotein (P-gp) is expressed at the blood–brain barrier (BBB), a functional barrier responsible for restricting the entry of compounds from circulating blood to the brain, which functions as a cellular efflux pump for xenobiotics and endogenous substrates to prevent their invasion into the brain at the luminal membrane of brain capillaries (1–3). The importance of P-gp at the BBB has been elucidated from a clinical viewpoint. A drug−drug interaction with P-gp inhibition has been suggested at the BBB (4,5). In a clinical case of loperamide administration, respiratory depression by loperamide was induced with the coadministration of quinidine, a known P-gp inhibitor, possibly due to an increase in the brain concentration of loperamide by an inhibition of P-gp at the BBB (4). Furthermore, using PET, it was shown that cyclosporin A, another P-gp inhibitor, significantly increased the brain concentration of 11C-verapamil in healthy subjects (5). The expression pattern of P-gp has also been suggested to play some roles in the etiology and pathogenesis of certain brain diseases such as Parkinson's and Alzheimer's (6–8). P-gp activity could affect the exposure of neurotoxic xenobiotics to the brain, thereby modulating interindividual susceptibility for Parkinson's disease (6,7). A significant inverse correlation was reported between P-gp expression and the deposition of amyloid β-peptide (Aβ) in the brain of nondemented subjects (8). It has been suggested that the accumulation of Aβ may be influenced by the expression of P-gp in blood vessels and that P-gp may influence the elimination of Aβ from the brain.
A number of single nucleotide polymorphisms (SNPs) have been reported for MDR1 gene, which encodes P-gp. These polymorphisms might affect the pharmacokinetics and pharmacodynamics of drug substrates and influence the prognosis of diseases such as leukemia (9,10). A synonymous C3435T polymorphism in exon 26 was reported to be associated with a lower expression level of P-gp in the duodenum and a higher steady-state concentration of digoxin (11), although the opposite relation has also been reported in subjects with this variant (12,13). The contribution of MDR1 variants to the expression of P-gp (both at protein and mRNA levels) is still controversial.
An approach using gene-based haplotypes, which are specific combinations of SNPs located throughout the genome, proved superior to the use of individual SNPs for predicting the association between MDR1 phenotypes (14,15). Haplotypes containing the SNPs G2677T and C3435T were reported to be significantly associated with the risk of Parkinson's disease (16). Additionally, highly significant linkage disequilibrium was shown among exons 12 C1236T, 21 G2677T, and 26 C3435T (17,18), which could account for most of the haplotypes. Epileptic patients with the CGC, TGC, and TTT haplotypes were reported more likely to be drug resistant (19). Hepatic elimination of 99mTc-methoxyisobutylisonitrile was reported to be different among these 3 SNPs (20). These clinical reports gave rise to a growing interest in the quantitative evaluation of P-gp function in the living human brain, such as that genetic polymorphism might be associated with interindividual differences in drug concentration and response in the central nervous system.
In vivo evaluation of P-gp function was proposed using PET with 11C-colchicine, 11C-carvedilol, 18F-paclitaxel, and 11C-verapamil (21). Among these drugs, the brain uptake of 11C-verapamil was increased after pretreatment with a potent P-gp inhibitor, PSC833, in nonhuman primates (22) and cyclosporin A in humans (5) as well as in rodents (23,24). High uptake of 11C-verapamil in the midbrain was reported in Parkinson's disease (25). With regard to the influence of functional haplotypes in MDR1 genes, it was recently reported that there was no difference in the brain distribution of 11C-verapamil (26). In these reports, several quantitative analyses such as the Logan plot and the area under the curve ratio (AUCratio) between brain and plasma—which use long datasets—were performed. Because of the rapid metabolism of 11C-verapamil, the metabolites in plasma might complicate the quantification of P-gp activity at the BBB due to their possible brain penetration, particularly with longer sampling intervals (5,21,24). Recently, Lee et al. (22) suggested that brain uptake clearance (CLuptake), determined by the integration plot, correlates with P-gp function at the BBB. The integration plot can reduce the effects of metabolites (22), as the analytic method uses short datasets with negligible metabolites in blood.
In this study, we aimed to investigate the differences in 11C-verapamil transfer at the BBB between the 2 haplotypes (3 SNPs; C1236T, G2677T, and C3435T) of the MDR1 gene by the integration plot method and also compared the parameters from the integration plot with those from other quantitative analysis models.
MATERIALS AND METHODS
General Study Design
All researchers participating in this study were unaware of the genetic information and the identification of the subjects; 1 administrator was responsible for the genetic information and identification of all subjects.
In the first step, blood samples were taken from the subjects and MDR1 polymorphisms were analyzed. PET scans were then performed on the subjects with identified polymorphisms. Finally, the association between P-gp function from quantitative PET analysis and polymorphism was analyzed.
This study was approved by the Ethics Committees of Tokyo University, the National Institute of Radiological Sciences, Tottori University, and Kannondai Clinic. Written informed consent was obtained from all subjects.
Subjects
Thirty-three healthy male volunteers (mean age ± SD, 23.5 ± 3.2 y) were enrolled in this study. Their health status was judged to be normal on the basis of physical examinations with screening of blood chemistries, complete blood count, urinalysis, and an electrocardiogram before the study.
Identification of MDR1 Polymorphisms
Blood samples from all volunteers were taken at Kannondai Clinic and then sent to Tottori University for MDR1 polymorphism analysis. Genomic DNA was prepared from blood samples by Toyobo blood kit on a Toyobo HMX-2000 robot. The genotype of MDR1 was identified by polymerase chain reaction−restriction fragment length polymorphism analysis as described previously (15).
The subjects were divided as follows: One group (TTT) consisted of 20 subjects with MDR1 genes of 1236TT, 2677TT, and 3435TT, whereas the other group (CGC) consisted of 13 subjects with MDR1 genes of 1236CC, 2677GG, and 3435CC. The mean age ± SD of the TTT group and CGC group was 23.4 ± 3.6 y and 23.7 ± 2.5 y, respectively.
PET Study
PET scans were performed for all 33 subjects at the National Institute of Radiological Sciences, Chiba, Japan.
Radioligand
11C-Verapamil was synthesized from norverapamil (Eisai Co. Ltd.) as described previously (27). The racemic mixture of verapamil was used.
PET Scans
All PET scans were performed using an ECAT EXACT HR+ PET camera (CTI/Siemens) in 2-dimensional mode. After a 10-min transmission, dynamic scans were performed for 16 min (15 s × 8, 30 s × 4, 1 min × 2, 2 min × 1, and 4 min × 2; total, 17 frames) immediately after an intravenous bolus injection of 730.1 ± 46.3 MBq (mean ± SD) of 11C-verapamil with a specific radioactivity of 55.2 ± 38.5 GBq/μmol (mean ± SD).
Blood Sampling and Plasma Metabolite Analysis
To obtain the arterial input function, an automated blood sampling system was used during the first 5 min of each PET scan. The concentration of radioactivity in arterial blood was measured every second, and manual sampling was also performed at 10 s, 20 s, 30 s, 40 s, 50 s, 60 s, 70 s, 80 s, 90 s, 100 s, 110 s, 130 s, 2.5 min, 3 min, 3.5 min, 4 min 20 s, 5 min, 6 min, 8 min, 10 min, and 15 min after the injection to measure the radioactivity in whole blood and plasma in a well-type scintillation counter. The radioactivity was corrected for decay.
Arterial blood samples were also taken manually at 2, 4, 7, and 12 min for plasma metabolite analysis. They were deproteinized with acetonitrile and then centrifuged. The supernatant was analyzed for radioactive components using a high- pressure liquid chromatography system (PU-610A series; GL Sciences) with a coupled bismuth germanate (BGO) positron detector (28) to measure the plasma 11C-verapamil metabolites. Isocratic elution was performed with a reversed-phase semipreparative Waters Bondpak C18 column (7.8 mm [inner diameter] × 300 mm). The mobile phase consisted of a mixture of acetonitrile and 0.1 mol/L ammonium acetate (70:30, v/v). The flow rate was 6 mL/min and the injected sample volume was <1.0 mL. The eluate was monitored by ultraviolet absorbance at 280 nm and coupled BGO positron detection. The percentage of parent compound was determined from the parent radioactivity with respect to the total radioactivity in the chromatogram. The plasma time–activity curve was corrected for the amount of unchanged 11C-verapamil in the plasma.
MRI Scans
MRI scans were acquired on a Gyroscan NT scanner (Phillips Medical Systems) (1.5 T) to obtain T1-weighted images of the brain (1-mm thickness).
PET Data Analysis
All emission data were reconstructed with a 4.0-mm Hanning filter, and regions of interest (ROIs) were placed on the PET/MRI coregistration images by a template-based method (29). ROIs of the prefrontal cortex, temporal cortex, parietal cortex, and occipital cortex were summed as the cortex.
Integration Plot
The initial brain uptake rate of 11C-verapamil, when the amount of metabolite of 11C-verapamil was considered to be low, can be described by the following equation: Eq. 1where CLuptake is the brain uptake clearance based on the plasma concentration of 11C-verapamil, Xt,cereb is the amount of 11C-verapamil in the cortex at time t, and Ct,WB is the whole-blood (WB) concentration of 11C-verapamil. AUC(0∼t) represents the area under the plasma concentration curve from 0 to t, and VE represents the initial distribution volume in the brain at time 0. VE was obtained from the y-intercept of the integration plot and includes the distribution volume of plasma resident within the brain as well as the initial distribution volume in the brain of 11C-verapamil rapidly equilibrating with that in plasma. The CLuptake value can be obtained from the initial slope of a plot of Xt,cereb/Ct,WB versus AUC(0∼t)/Ct,WB, designated as the integration plot (22,30). In this study, the points of the initial 20 s were excluded for linear regression to eliminate the large variation of the time–activity curve in the brain, and the data between 20 s and 3 min were used for the analysis.
1-Input, 1-Tissue Compartment Model
Rate constants between plasma and tissue—that is, K1 and k2—were estimated with a 1-input, 1-tissue compartment model including the transfer of unmetabolized 11C-verapamil. In this model, a plasma curve of unchanged 11C-verapamil was used as input function Cp, and 3 parameters (K1, k2, DV) were estimated by nonlinear least squares (NLS). NLS fitting was performed for 16-min data. The distribution volume (DV) was also estimated as the ratio of K1 to k2.
AUC Ratio Model
The area under the time–activity curve of the ROIs in the brain [AUCbrain (∼16 min)] was calculated for 16 min. The area under the time–activity curve of the metabolite-uncorrected plasma radioactivity [AUCplasma_uncorrected (∼16 min)] and of the metabolite-corrected plasma radioactivity [AUCplasma_corrected (∼16 min)] was calculated for 16 min.
The ratios of AUCbrain (∼16 min) to AUCplasma_uncorrected (∼16 min) and AUCplasma_corrected (∼16 min) were calculated and were defined as AUCratio_uncorrected and AUCratio_corrected.
Statistical Analysis
The parameters derived from the integration plot were used to evaluate the differences in P-gp function at the BBB between the polymorphisms of the MDR1 gene. Data are expressed as mean ± SD. Statistical significance of differences in CLuptake between haplotypes was analyzed by the Student t test. All probability values were 2-tailed, and a P value < 0.05 was considered significant.
The time courses of the percentage of unchanged 11C-verapamil in the plasma were compared between haplotypes using 2-way repeated-measures ANOVA with Greenhouse–Geisser correction. One subject in the CGC group was excluded from this analysis because data for 1 time point (4 min) were missing because of technical problems.
The analysis was performed with SPSS 12.0 J for Windows.
Correlations between CLuptake and other parameters derived from the 1-input, 1-compartment model (K1, k2, DV) and AUCratio_uncorrected and AUCratio_corrected were evaluated by linear regression.
RESULTS
The AUC [AUCplasma (∼3 min)] of the plasma concentration time profile of 11C-verapamil up to 3 min after the injection was not significantly different between the haplotypes (1236TT, 2677TT, 3435TT and 1236CC, 2677GG, 3435CC) (Table 1). In plasma, >93% of 11C-verapamil remained unmetabolized at 4 min after intravenous administration.
Pharmacokinetic Parameters of Intravenously Administered 11C-Verapamil of Haplotypes of MDR1 Genes
The distribution parameters of 11C-verapamil in the brain, such as maximal concentration in the cortex (Cmax_cortex), time at maximal concentration in the cortex (Tmax_cortex), and AUCcortex (∼3 min), were not different between the haplotypes (Table 1). CLuptake for the subjects with the TTT haplotype (1236TT, 2677TT, 3435TT) was 0.053 ± 0.011 mL/g/min, whereas that with the CGC haplotype (1236CC, 2677GG, 3435CC) was 0.051 ± 0.011 mL/g/min. This difference in CLuptake of 11C-verapamil between haplotypes was not significant (Fig. 1). Although the subject populations of the haplotypes were not even (13 vs. 20), the imbalance would not have had significant effects on the results.
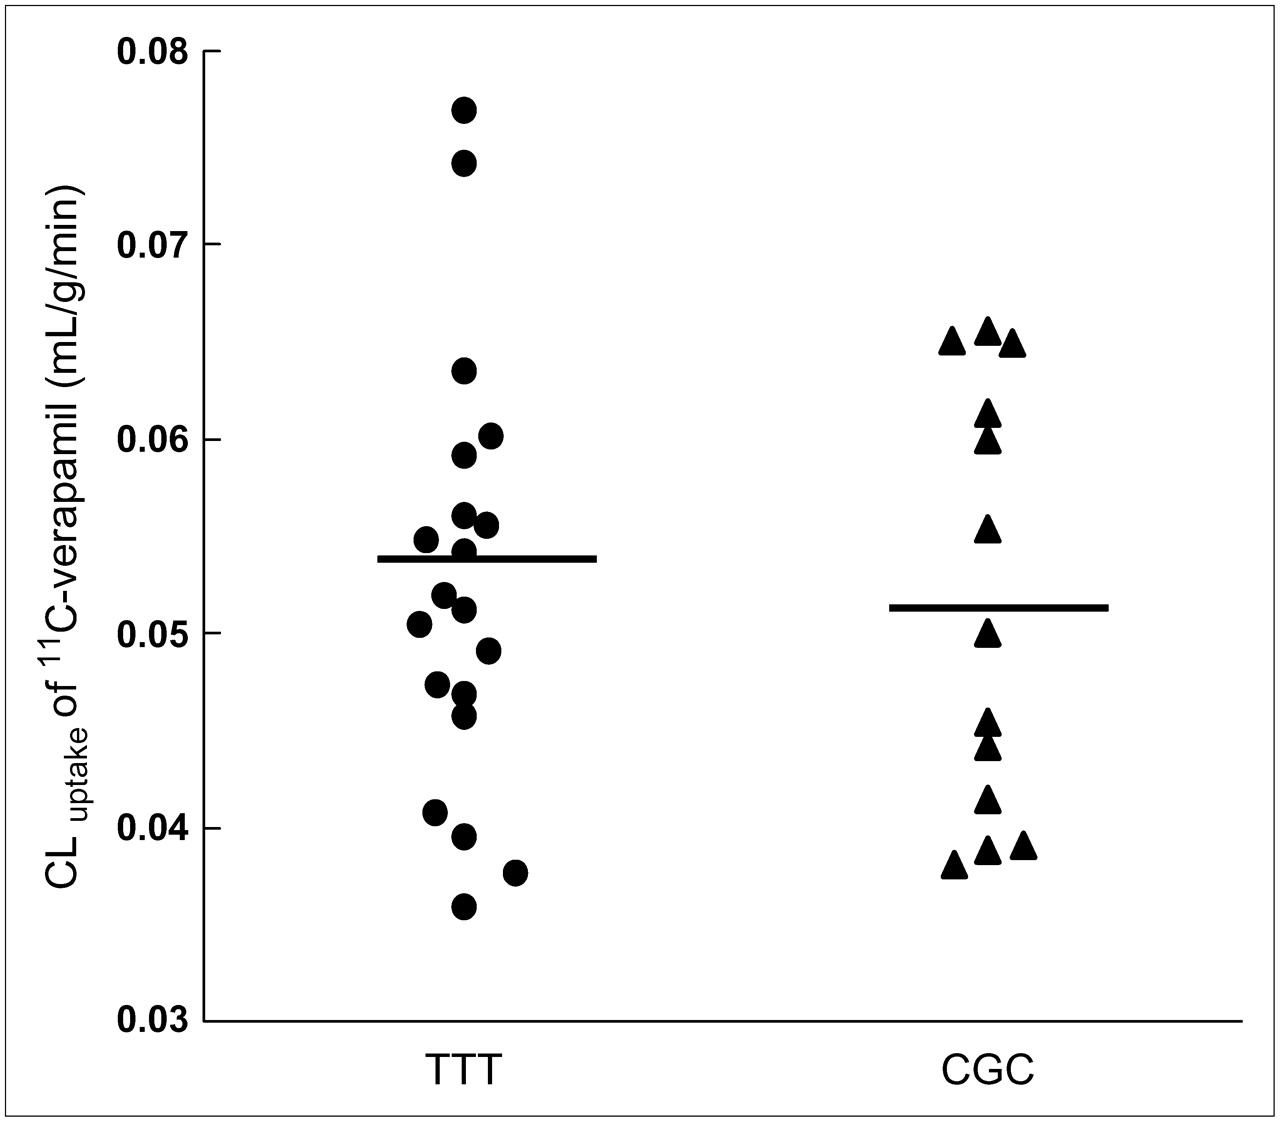
CLuptake (mL/g/min) of 11C-verapamil between haplotypes TTT (1236TT, 2677TT, and 3435TT) vs. CGC (1236CC, 2677GG, and 3435CC). The mean of each haplotype is indicated by a horizontal bar.
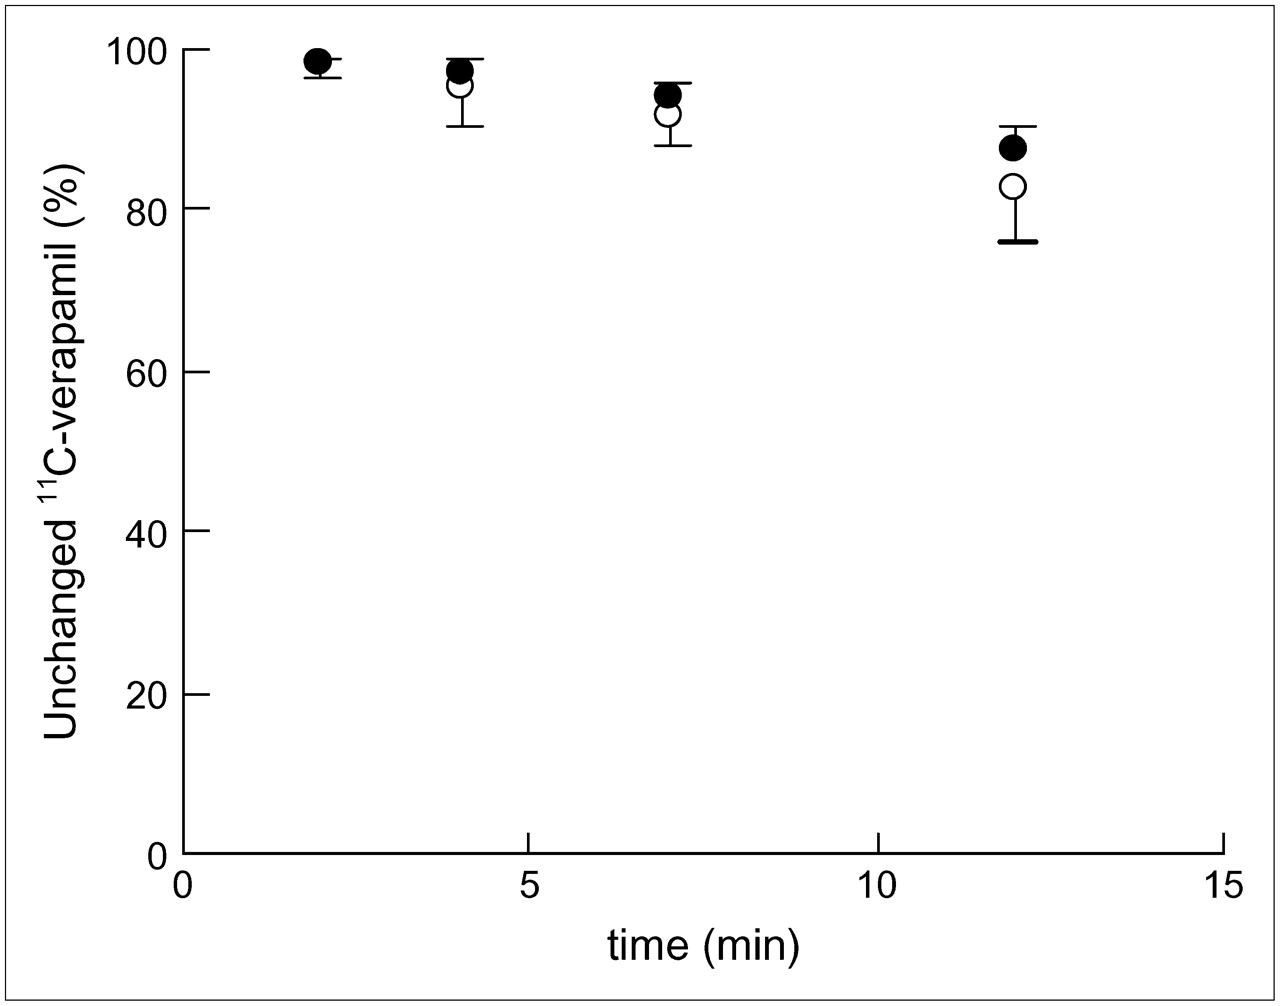
The percentage of unmetabolized 11C-verapamil in the plasma decreased gradually as shown in Figure 2. The percentages of unmetabolized 11C-verapamil were 97.9% ± 1.2% at 2 min, 95.4% ± 4.8% at 4 min, 91.6% ± 3.5% at 7 min, and 82.4% ± 6.6% at 12 min in the TTT group and 98.3% ± 0.8% at 2 min, 96.9% ± 1.7% at 4 min, 94.3% ± 1.7% at 7 min, and 87.6% ± 2.7% at 12 min in the CGC group. Two-way repeated-measures ANOVA did not detect significant haplotype-by-time interaction for the percentage of unchanged 11C-verapamil [F1.87, 56.0 = 2.467, P = 0.098].

Time course of percentage of unmetabolized 11C-verapamil in plasma between haplotypes (1236TT, 2677TT, and 3435TT [○] vs. 1236CC, 2677GG, and 3435CC [•]). Error bars are shown as 1 SD.
The CLuptake value was significantly correlated with K1 (R2 = 0.99) and DV (R2 = 0.77) values derived from the 1-input 1-compartment model. However, the k2 value was not significantly correlated with CLuptake (Fig. 3).

Correlation between CLuptake of integration plot and K1 (A), k2 (B), and DV (C) in 1-input, 1-compartment model. Linear regression is shown when correlation is significant.
The CLuptake value was significantly correlated with AUCratio_uncorrected (R2 = 0.96) and AUCratio_corrected (R2 = 0.96) (Fig. 4).
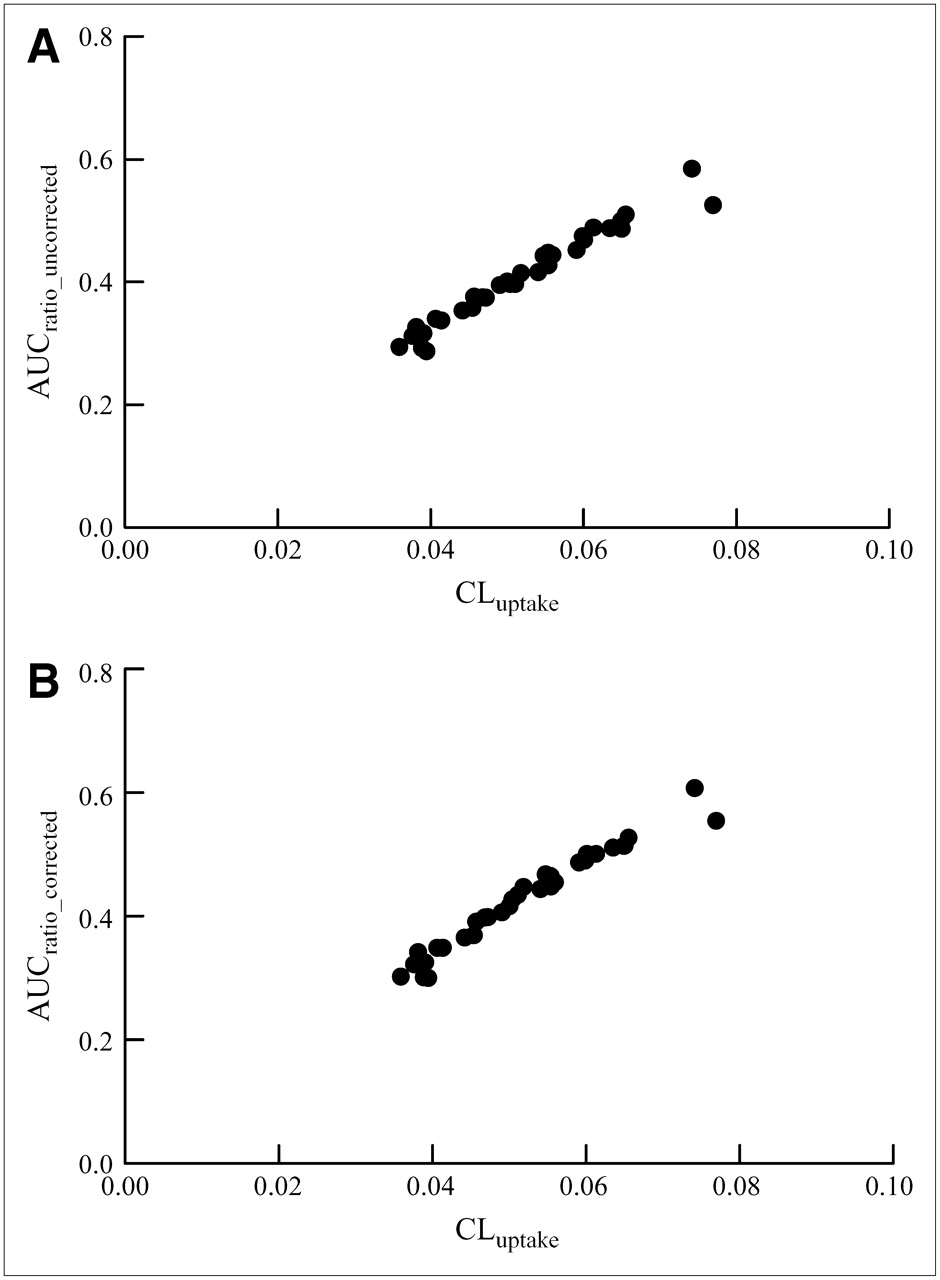
Correlation between CLuptake of integration plot and AUCratio_uncorrected (A) and AUCratio_corrected (B).
DISCUSSION
In this study, the P-gp function at the BBB, evaluated by integration plot analysis with the first 3-min data using 11C-verapamil as a probe, was not significantly different between the haplotypes of MDR1 genes (1236TT, 2677TT, 3435TT vs. 1236CC, 2677GG, 3435CC).
11C-Verapamil has been used for the evaluation of P-gp function at the BBB in studies of neuropsychiatric diseases and drug interaction (25,31), but several different quantitative analyses were used in each study. The metabolites of verapamil D-617 and D-620 were suggested to be P-gp substrates (32), and the significant amount of radioactivities in plasma was associated with the form of metabolites of 11C-verapamil at 1 h after the injection in nonhuman primates (22), in contrast to rodents, in which little radioactive metabolite has been reported in plasma and brain even at 1 h after the injection (33,34). Although the effect of the metabolites on the quantification of 11C-verapamil uptake in the brain has not been conclusively determined yet, a long dataset of 11C-verapamil (0–60 min) fitted the 2-input compartment model (35), suggesting that metabolites of 11C-verapamil could enter the brain.
Brunner et al. recently reported that there was no difference in the brain distribution of 11C-verapamil between TTT haplotype (3435T, 1236T, and 2677T) and wild-type CGC haplotype (3435C, 2677G, and 1236C) in healthy subjects (26). They used the AUC ratio between brain and plasma for 60 min (5). Because of the possible brain penetration of the metabolites of 11C-verapamil, it is difficult to exclude the possibility that analyses using long datasets are influenced by the accumulation of metabolites in the brain because total radioactivities were used as brain concentration. To avoid the effects of metabolites of 11C-verapamil, it might be worthwhile using a stereoisomer of verapamil, (R)-11C-verapamil, which was reported to have a lower level of metabolites (34), in future studies.
As alternative analytic method for evaluating P-gp function at the BBB, we proposed an integration plot yielding CLuptake, which correlates with P-gp activity at the BBB and can be obtained using a short dataset with negligible metabolites in the blood. The CLuptake obtained using the initial 3-min data was significantly correlated with K1 but not k2 in the 1-input, 1-compartment model, supporting the notion that this parameter reflects the brain uptake process. Although the biologic meaning of k2 in this model has not been clearly defined, k2 values were not significantly different between the polymorphisms in this study (data not shown).
CLuptake was significantly correlated with AUCratio (∼16 min) irrespective of metabolite correction. Metabolites did not seem to have an effect on the AUC ratio up to 16 min. This is reasonable considering that the percentage of the unmetabolized 11C-verapamil was >82% at 12 min.
Although the average CLuptake value of 11C-verapamil was similar regardless of the used haplotypes (C1236T, G2677T, C3435T) of the MDR1 gene (Table 1), this parameter showed large variation (minimum, 0.036; maximum 0.077), similar to that found by intestinal biopsy (2–8 times) (36). It is possible that factors other than the haplotypes investigated in this study might be responsible for the interindividual variations. Most nucleotide variants in MDR1 genes, including the haplotypes in this study, were located on the coding regions. However, the promoter variants of the MDR1 gene have also been suggested to be important for interindividual differences of P-gp expression, such as in luciferase activity and at placental and hepatic messenger RNA levels (37). Further study will be necessary for the assessment of variations of the P-gp function at the BBB in regard to polymorphisms with promoter regions.
Another possibility is that the functional differences between haplotypes become evident in pathologic conditions. Pharmaco-resistant epilepsy was reported be associated with C3435T polymorphism (38). The 2677T and 3435T haplotype was found to be associated with a risk of Parkinson's disease (16). Hoffmeyer et al. (11) reported that the functional difference of P-gp with C3435T polymorphism is more evident by rifampicin treatment through the induction of P-gp in the jejunum. Induction of P-gp expression in brain capillary endothelial cells by pregnane X receptor agonists, glutamate and transforming growth factor-β1 (39–41), has also been reported.
In future studies, this method can be applied to the investigation of the role of P-gp in the pathophysiology of disease, such as the elimination mechanism of Aβ in Alzheimer's disease, and also in the evaluation of treatments including drug−drug interactions at the BBB.
CONCLUSION
P-gp function at the BBB measured with 11C-verapamil was not significantly different between the haplotypes (3435T, 1236T, and 2677T vs. 3435C, 2677G, and 1236C) in healthy subjects using several quantitative analyses, including integration plot analysis with the first 3-min data, which could reduce the effects of metabolites.
Acknowledgments
We thank Jun Kosaka, Miho Ota, Shoko Nozaki, Ryosuke Arakawa, Chikako Hirai, and Yoshiko Fukushima for their help with the PET study and data analysis. This study was supported by a consignment expense for the Molecular Imaging Program on “Research Base for PET Diagnosis” and by a grant-in-aid for the Advanced and Innovational Research Program in Life Sciences from the Ministry of Education, Culture, Sports, Science and Technology, Japanese Government.
Footnotes
-
COPYRIGHT © 2006 by the Society of Nuclear Medicine, Inc.
References
- Received for publication March 14, 2006.
- Accepted for publication May 15, 2006.


Jump to section
Related Articles
Cited By...
- A Proof-of-Concept Study to Inhibit ABCG2- and ABCB1-Mediated Efflux Transport at the Human Blood-Brain Barrier
- Breast Cancer Resistance Protein and P-Glycoprotein Influence In Vivo Disposition of 11C-Erlotinib
- Transporters and Drug-Drug Interactions: Important Determinants of Drug Disposition and Effects
- Developmental Changes in P-Glycoprotein Function in the Blood-Brain Barrier of Nonhuman Primates: PET Study with R-11C-Verapamil and 11C-Oseltamivir
- PET Imaging of the Gastrointestinal Absorption of Orally Administered Drugs in Conscious and Anesthetized Rats
- P-Glycoprotein Function at the Blood-Brain Barrier in Humans Can Be Quantified with the Substrate Radiotracer 11C-N-Desmethyl-Loperamide
- Imaging of Cyclosporine Inhibition of P-Glycoprotein Activity Using 11C-Verapamil in the Brain: Studies of Healthy Humans
- P-Glycoprotein Function at the Blood-Brain Barrier Imaged Using 11C-N-Desmethyl-Loperamide in Monkeys
- 11C-Loperamide and Its N-Desmethyl Radiometabolite Are Avid Substrates for Brain Permeability-Glycoprotein Efflux
- P-glycoprotein Restricts the Penetration of Oseltamivir Across the Blood-Brain Barrier