


Abstract
Permeability-glycoprotein (P-gp), an efflux transporter in several organs, acts at the blood–brain barrier to protect the brain from exogenous toxins. P-gp almost completely blocks brain entry of the PET radiotracer 11C-N-desmethyl-loperamide (11C-dLop). We examined the ability of 11C-dLop to quantify P-gp function in humans after increasing doses of tariquidar, an inhibitor of P-gp. Methods: Seventeen healthy volunteers had a total of 23 PET scans with 11C-dLop at baseline and after increasing doses of tariquidar (2, 4, and 6 mg/kg intravenously). A subset of subjects received PET with 15O-H2O to measure cerebral blood flow. Brain uptake of 11C-dLop was quantified in 2 ways. Without blood data, uptake was measured as area under the time–activity curve in the brain from 10 to 30 min (AUC10–30). With arterial blood data, brain uptake was quantified with compartmental modeling to estimate the rates of entry into (K1) and efflux from (k2) the brain. Results: Brain uptake of radioactivity was negligible at baseline and increased only slightly (∼30%) after 2 mg of tariquidar per kilogram. In contrast, 4 and 6 mg of tariquidar per kilogram increased brain uptake 2- and 4-fold, respectively. Greater brain uptake reflected greater brain entry (K1), because efflux (k2) and cerebral blood flow did not differ between tariquidar-treated and untreated subjects. In the subjects who received the highest dose of tariquidar (and had the highest brain uptake), regional values of K1 correlated linearly with absolute cerebral blood flow, consistent with high single-pass extraction of 11C-dLop. AUC10–30 correlated linearly with K1. Conclusion: P-gp function at the blood–brain barrier in humans can be quantified using PET and 11C-dLop. A simple measure of brain uptake (AUC10–30) may be used as a surrogate of the fully quantified rate constant for brain entry (K1) and thereby avoid arterial sampling. However, to dissect the function of P-gp itself, both brain uptake and the influx rate constant must be corrected for radiotracer delivery (blood flow).
Adenosine triphosphate binding cassette (ABC) transporters are a group of transmembrane proteins that maintain chemical homeostasis by selectively effluxing compounds from the cytoplasm to the extracellular milieu. One of the most extensively studied ABC transporters is ABCB1, which is the product of the multidrug resistance gene, more commonly referred to as permeability-glycoprotein (P-gp) (1). P-gp is present at several sites in the body, including the blood–brain barrier, where P-gp prevents potentially toxic material from entering the brain (2). However, several therapeutic drugs are also substrates for P-gp, and their efflux by P-gp is a potential mechanism of drug-resistance in schizophrenia (3), epilepsy (4), and several types of tumors (1,5).
The function of P-gp has been measured with PET using radiolabeled substrates, including 99m/94mTc-sestamibi (6,7), 11C-verapamil (8), and 18F-paclitaxel (9). Each of these agents has at least 1 limitation, including difficulty in synthesis, significant contamination by radiometabolites, or only modest increase in brain uptake after the inhibition of P-gp (10).
In the search for an improved radiotracer to measure P-gp function, we evaluated 11C-loperamide and 11C-N-desmethyl-loperamide (11C-dLop). Loperamide is a potent opiate agonist that is available over the counter and used to treat diarrhea. Loperamide lacks effects on the central nervous system because P-gp avidly blocks its entry into the brain (11,12). Although 11C-loperamide can monitor the function of P-gp at the blood–brain barrier, quantitation with this radiotracer is impaired, because its prominent metabolite, 11C-dLop, is also a substrate for P-gp (13). 11C-dLop is an ideal radiotracer to measure the function of P-gp because its further metabolism generates radiometabolites with minimal entry into the brain (13,14). In addition, using cell cultures with transfected human genes, we found that dLop is selective for P-gp (ABCB1) among the 3 most common ABC transporters at the blood–brain barrier (ABCB1, ABCC1, and ABCG2) (15).
We previously showed that 11C-dLop can quantify P-gp function at the blood–brain barrier in monkeys (16). However, to separately measure the effect of P-gp on entry versus delivery, brain uptake must be corrected for regional cerebral blood because of the high single-pass extraction (>30%) of this radiotracer. We then extended 11C-dLop to healthy humans and found virtually no uptake in the brain (17), consistent with P-gp acting quickly and with high capacity to block the uptake of 11C-dLop. The purpose of this study was to determine whether 11C-dLop can quantify P-gp function in humans and whether measurement of cerebral blood flow (CBF) is required to correct for differential delivery to regions of the brain. To have measureable uptake of radiotracer, we inhibited P-gp with tariquidar (also called XR9576). Tariquidar was previously tested as an adjuvant to cancer chemotherapy, with the goal of increasing uptake of anticancer drugs in tumors that had become resistant by overexpressing P-gp (18). Tariquidar (tested at 2 mg/kg intravenously) was generally ineffective in multidrug-resistant cancer (19). On the basis of our studies in monkeys (and the negative clinical trials in human cancer), we suspected that higher doses of tariquidar would be required to significantly increase brain uptake of 11C-dLop. Thus, we tested 3 doses of tariquidar: 2, 4, and 6 mg/kg intravenously.
MATERIALS AND METHODS
Subject Selection
Five healthy human volunteers (mean age ± SD, 35 ± 10 y; 3 men and 2 women; mean weight ± SD, 90.2 ± 27.8 kg) participated in the initial PET study with 11C-dLop but without arterial blood sampling. Two PET scans were obtained for each subject: at baseline and after the administration of tariquidar (2 mg/kg intravenously up to a maximal dose of 150 mg). Because of low brain uptake in the initial study, 12 additional healthy volunteers were studied with arterial blood sampling. These 12 subjects underwent a total of 13 PET scans: 6 at baseline (mean age ± SD, 31 ± 7; 2 men and 4 women; mean weight ± SD, 79.3 ± 17.4 kg), 4 after the administration of 4 mg of tariquidar per kilogram (mean age ± SD, 38 ± 11; 4 men; mean weight ± SD, 78.8 ± 13.4 kg), and 3 after the administration of 6 mg of tariquidar per kilogram (mean age ± SD, 33 ± 7; 1 man and 2 women; mean weight ± SD, 79.4 ± 16.9 kg). One subject underwent PET both at baseline and after 6 mg of tariquidar per kilogram (Supplemental Table 1 shows demographic and PET scan information for each subject; supplemental materials are available online only at http://jnm.snmjournals.org).
All subjects' histories were obtained, and they underwent physical examination, routine blood and urine laboratory testing (including chemistries, complete blood count, liver function tests, and urinalysis), and electrocardiography to exclude serious medical conditions, psychiatric illness, and abuse of illicit substances. Subjects were free of any medication (including nonprescription medications, herbals, and supplements) for at least 3 d before and after the administration of tariquidar, except women of child-bearing potential who were allowed to continue taking oral contraceptives. Subjects younger than 18 y or older than 50 y of age were excluded from study.
Radiotracer Preparation
11C-dLop was prepared by the methylation of its primary amide precursor with 11C-iodomethane, as described previously (13). The preparations were conducted according to our investigational new drug application (101,092), submitted to the U.S. Food and Drug Administration (http://pdsp.med.unc.edu/snidd/). The radiotracer was obtained in high radiochemical purity (100%) and with a specific activity of 90 ± 46 GBq/μmol (n = 23 batches) at the time of injection.
Tariquidar Preparation and Administration
Tariquidar solution was supplied by AzaTrius Pharmaceuticals. Each milliliter of solution contained 7.5 mg of tariquidar base as the dimesylate salt in a sterile solution of 20% ethanol/80% propylene glycol, with a small amount of hydrochloric acid added. Tariquidar solution was stored refrigerated (2–8°C) and protected from light and allowed to warm to ambient temperature before dilution. The stock solution was filtered and then diluted in 5% dextrose solution at a concentration of 0.6 mg/mL for intravenous administration. The infusion bag and tubing were protected from light at all times.
Tariquidar was infused intravenously via the antecubital vein at a rate of 375 mL/h. The injection of 11C-dLop took place within 1 h of the completion of the tariquidar infusion. The 1-h delay was required to complete the 15O-H2O scans between completion of tariquidar administration and injection of 11C-dLop.
Safety Monitoring
Subjects were monitored for changes in blood pressure, temperature, heart rate, and respiration rate before and after tariquidar infusion. In addition, these parameters, and electrocardiogram tracing, were monitored after the injection of 11C-dLop. Blood and urine laboratory tests were repeated within 24 h after completion of the study.
11C-dLop PET
Five subjects underwent PET without arterial sampling. In these subjects, 3-dimensional images were acquired on an Advance scanner (GE Healthcare) in dynamic mode with increasing frame duration for a total scan time of 60 min. An 8-min 68Ge transmission scan was obtained before injection of the radiotracer for attenuation correction. A fixed injection duration of 20 s was used for these subjects. 11C-dLop was injected via a computer-controlled Harvard programmable pump (Harvard Apparatus). The injection rate was calculated using the DOSE program (NIH PET Department) after inputting the syringe size, desired dose of radioactivity, and injection duration. Subjects underwent a second PET scan under identical conditions on the same day (n = 2), or on a following day (n = 3), after the administration of tariquidar (2 mg/kg intravenously or a maximum dose of 150 mg).
A total of 12 additional subjects underwent PET with arterial sampling. In these subjects, 3-dimensional images were acquired on a High Resolution Research Tomograph (Siemens Medical Solutions) over a scan time of 60 min. A 6-min transmission scan using a 137Cs point source was obtained before injection of the radiotracer for attenuation correction. A fixed injection duration of 1 min was used for these subjects; however, 1 baseline subject had 11C-dLop injected over 20 s. The radiotracer injection method was otherwise identical to that described for the 5 subjects without arterial sampling. Arterial blood was manually sampled at 15-s intervals for the first 2 min, then at 3, 5, 10, 20, 30, 45, and 60 min. Plasma 11C-dLop was quantified using a high-performance liquid chromatography radiodetector. The plasma concentration of the parent radiotracer was separated from radiolabeled metabolites. Because of time constraints, a small number of alternating plasma samples from the early time points was not analyzed using a high-performance liquid chromatography radiodetector. Instead the percentage composition of parent radiotracer for these time points was estimated by interpolating the measured values. A high-performance liquid chromatography radiodetector was used to determine the concentration of parent radiotracer for the 60-min time point for each subject. Free fraction of 11C-dLop in plasma was measured by ultrafiltration, as previously described (13).
Injected doses of radioactivity from 11C-dLop administration were as follows: 695 ± 69 MBq (baseline), 621 ± 91 MBq (tariquidar, 2 mg/kg), 722 ± 13 MBq (tariquidar, 4 mg/kg), and 707 ± 44 MBq (tariquidar, 6 mg/kg).
15O-H2O Imaging
Two baseline subjects and all subjects receiving tariquidar at 4 or 6 mg/kg intravenously also underwent 1–3 PET scans with 15O-H2O before the injection of 11C-dLop. For each scan, 444 MBq of 15O-H2O were administered, followed by a 1-min acquisition. To allow adequate decay of radioactivity, at least 15 min was allowed between injections of 15O-H2O and between the terminal injection of 15O-H2O and injection of 11C-dLop. Continuous arterial blood sampling was performed during each 15O-H2O scan using an automated blood counter.
Image Analysis
For the High Resolution Research Tomograph scans, reconstructed images were realigned using statistical parametric mapping (version 5; Wellcome Department of Cognitive Neurology) and normalized to stereotactic space. The Montreal Neurologic Institute template was used to define regions of interest (frontal, temporal, occipital, parietal, and cerebellar cortex) with pixelwise modeling software (version 3.95; PMOD Technologies). Regions were inspected and manually adjusted when necessary. An additional region was manually drawn over the choroid plexus in the lateral ventricles.
The concentration of radioactivity was corrected for subject body weight and injected dose of radioactivity and expressed as standardized uptake value (SUV): %SUV = (% injected activity per cm3 brain) × (g of body weight). The area under the time–activity curve from 10 to 30 min (AUC10–30) for each brain region was calculated using the trapezoidal method and compared between each group of subjects.
To compare results from images acquired on the Advance camera (GE Healthcare) (tariquidar, 2 mg/kg; no arterial sampling) with those acquired using the High Resolution Research Tomograph (Siemens), a 30 cm3 region of cerebellar gray matter was manually drawn. The AUC10–30 of this region was pooled to compare the concentration of radioactivity in the cerebellum at baseline and after administration of tariquidar at 2, 4, and 6 mg/kg.
For baseline and tariquidar scans of 4 and 6 mg/kg, brain and metabolite-corrected plasma data were used to calculate rate constants and total distribution volume (VT) using standard 1- and 2-tissue-compartment models (20). VT is equal to the ratio, at equilibrium, of the concentration of total radioactivity in the brain to the concentration of parent radioligand in plasma and is the quotient of K1 (the rate constant for brain entry) and k2 (the rate constant for brain efflux) when using the 1-tissue-compartment model. The total concentration of radioactivity in whole blood was used for vascular correction, assuming that blood constitutes 5% brain volume. The identifiability of the rate constants was obtained from the diagonal of the covariance matrix and expressed as the SE.
The 15O-H2O scans were also normalized to stereotactic space, and the same regions used for 11C-dLop analysis were applied. Absolute blood flow was calculated using the autoradiographic method (21). In subjects who received more than one 15O-H2O scan, outlier blood flow values were discarded and remaining values were averaged for each region. With absolute blood flow (F) and K1, we further calculated the extraction fraction (E) using the following equation: Eq. 1where
 Eq. 2and PS is the permeability–surface area product.
Group data are expressed as mean ± SD.
RESULTS
Safety Analysis
11C-dLop was well tolerated by all subjects, and no subject's complaints were attributed to radiotracer injection. Heart rate, blood pressure, respiratory rate, temperature, and electrocardiogram were unchanged after the injection of 11C-dLop.
Tariquidar was well tolerated in all but 1 subject. This subject received 6 mg/kg (total dose, 367 mg). Thirty minutes after the tariquidar infusion was initiated, the subject complained of a metallic taste in her mouth and mild nausea. The subject denied any other complaints, including headache, change in vision, weakness, dizziness, or abdominal pain. Heart rate, blood pressure, respiration rate, and temperature did not significantly change during tariquidar administration. Out of concern for possible toxicity, we terminated further accrual into the study. All subjects who received the higher dose of tariquidar (6 mg/kg) returned for repeated blood and urine laboratory tests between 3 and 7 d after receiving tariquidar. No subject had any significant change in blood chemistries (including liver function tests, blood urea nitrogen, and creatinine concentrations), complete blood count, or urinalysis.
Brain Uptake of 11C-dLop
Because results from monkey studies using 11C-dLop demonstrated that the AUC could be used as a surrogate measure of K1 (16), we performed the initial 11C-dLop analysis without the use of the arterial input function. At baseline, concentration of radioactivity was low (∼15 %SUV). After P-gp blockade, the concentration of radioactivity increased by 28%; however, this difference was not statistically significant. Brain uptake (SUV · min) was 211 ± 42 at baseline and 271 ± 54 after 2 mg of tariquidar per kilogram (P = 0.0502, paired t test, n = 5).
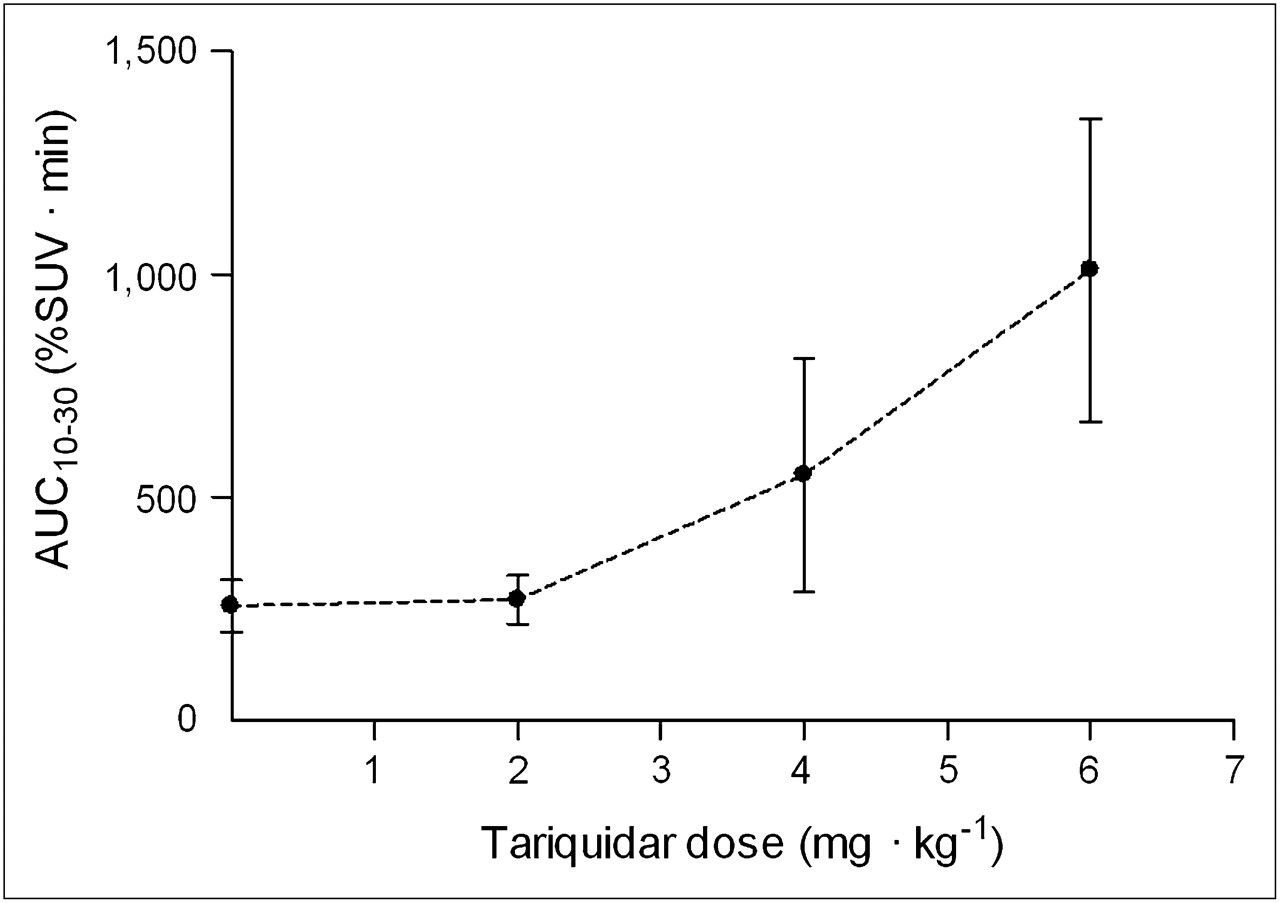
To achieve greater inhibition of P-gp, we administered higher doses of tariquidar. Brain uptake increased in a dose-dependent manner at 2, 4, and 6 mg of tariquidar per kilogram (Figs. 1 and 2). Doses of 4 and 6 mg/kg of tariquidar increased brain uptake about 2- and 4-fold, respectively, compared with baseline values (Fig. 3). Similar to that in the baseline scans, the time–activity curves show that tariquidar-treated subjects had a rapid peak uptake, followed by minimal washout of radioactivity.

Uptake of radioactivity in brain after injection of 11C-dLop as function of dose of tariquidar. Brain uptake was measured as AUC10–30 in cerebellum (30 cm3). In addition to baseline scan (dose of 0 mg/kg), tariquidar was administered at 2, 4, or 6 mg/kg intravenously. Symbols and error bars represent mean values ± SD.

PET images of 11C-dLop in human brain and corresponding MR image at baseline and after administration of tariquidar (6 mg/kg intravenously). PET images were summed from 0 to 60 min, and pixel values represent mean concentration of radioactivity (%SUV). Arrows point to choroid plexus on medial surfaces of lateral ventricles and roof of third ventricle.

(A) Concentration of radioactivity in brain, without vascular correction, at baseline (•) and after administration of tariquidar, 4 mg/kg intravenously (○), and 6 mg/kg intravenously (▪). Symbols and error bars represent mean ± SD. (B) Concentration of radioactivity in same subjects, with vascular correction. Conc = concentration.
After the injection of 11C-dLop, the choroid plexus had high (∼300–400 %SUV) and sustained uptake of radioactivity in both baseline and P-gp-blocked scans (Fig. 2). P-gp inhibition did not significantly change the peak uptake in the choroid plexus, even after correcting for spill-in from adjacent brain regions.
Kinetic Analysis
Overall, the unconstrained 2-tissue-compartment model did not provide a significantly better fit than the 1-tissue-compartment model (Figs. 4A and 4B). Although a subset of brain regions demonstrated significantly better fit using the 2-tissue-compartment model in certain subjects (F test, P < 0.01), these regional differences were not consistent among all subjects. Moreover, the 2-tissue-compartment model estimated the kinetic parameters with poor identifiability (e.g., SE > 100%). In comparison, the 1-tissue-compartment model estimated K1, k2, and VT with much better identifiability (SE < 12%). P-gp blockade using tariquidar at concentrations of 4 mg/kg and 6 mg/kg resulted in 2- and 4-fold higher values for VT, respectively. These increases were mainly due to higher values of K1, because k2 was similar for baseline and P-gp-blocked scans, regardless of the concentration of tariquidar (Table 1).

(A and B) Representative time–activity curves and compartmental fitting of radioactivity in occipital cortex (×) in single subject at baseline and after administration of tariquidar (6 mg/kg intravenously). Solid and dashed lines represent 1- and 2-compartment-model fitting, respectively. (C and D) Concentration of parent 11C-dLop in plasma from 6 subjects at baseline and 3 subjects after administration of tariquidar (6 mg/kg intravenously). Each symbol represents a different subject. Duration of 11C-dLop injection was 60 s for each subject except 1 baseline subject (□), who had 11C-dLop injected over 20 s. Conc = concentration.
Rate Constants from 1-Tissue Compartmental Modeling of 11C-dLop Scans, at Baseline and After Pharmacolocal Inhibition of P-gp with Tariquidar (4 or 6 mg/kg Intravenously)
Increases in brain uptake were not due to increased plasma concentrations of 11C-dLop in the subjects who received tariquidar, because peak plasma concentration was slightly lower on average after maximal blockade of P-gp (Figs. 4C and 4D). In addition, plasma free fraction of parent radiotracer was not significantly different between groups (14.6% ± 1.7% at baseline and 17.4% ± 5.4% and 16.0% ± 4.0% after 4 and 6 mg of tariquidar per kilogram, respectively).
Regional AUC10–30 correlated well with K1 values among the 12 subjects who underwent PET with arterial sampling (Fig. 5). Time stability analysis indicated that VT values calculated from less than 50 min of scanning were within a 10% difference from that from the entire 60-min scan but continued to increase because of the slow washout of 11C-dLop. However, K1 values were stable (within 10% of terminal value) after only 20 min of scan time (Supplemental Fig. 1).

Linear correlation between K1 and AUC10–30. K1 was calculated using the arterial input function for 5 brain regions in subjects at baseline (n = 6) and after administration of tariquidar at 4 (n = 4) and 6 mg/kg intravenously (n = 3). Correlation coefficient (r) = 0.94, P < 0.0001.
For the choroid plexus, K1 values were much higher than those for cortical regions. Values for K1 (mL · cm−3 · min−1) were similar among subjects at baseline (0.25) and those who received tariquidar at 4 mg/kg (0.23) and 6 mg/kg (0.28).
Parent radiotracer represented an unusually high percentage of total radioactivity throughout the duration of the 11C-dLop scan. After combining the 4 and 6 mg/kg groups, the percentage of total radioactivity composed of parent radiotracer at 60 min was not significantly different between subjects at baseline (90.2% ± 5.5%) and subjects after tariquidar administration (75.7% ± 15.8%) (P = 0.08, 2-tailed t test).
Blood Flow
Tariquidar increased brain uptake of radioactivity but did not do so by increasing delivery of 11C-dLop to the brain, as measured by regional CBF. For example, in the occipital cortex, a brain region with high blood flow, CBF values (mL · cm−3 · min−1) were 0.348 ± 0.023 in the baseline group and 0.385 ± 0.060 and 0.393 ± 0.110 in the 4 and 6 mg/kg groups. The 13% difference in CBF between the baseline and 6 mg/kg blocked conditions was much less than the 300% difference in brain uptake of radioactivity.
In the subjects who received the highest concentration of tariquidar, K1 correlated linearly with absolute blood flow (Fig. 6). Using absolute blood flow values, we calculated extraction fraction and permeability-surface fraction for 5 brain regions in each subject. At baseline, E was low (3.5%) and was 2- and 4-fold higher in the 4 and 6 mg/kg groups, respectively (Table 2). PS values increased proportionately with increasing dose of tariquidar.

Relationship between K1 (rate constant of brain entry) and blood flow in 3 subjects who received tariquidar (6 mg/kg intravenously). K1 and blood flow showed positive correlation, with correlation coefficient (r) > 0.88 and P < 0.05 for each subject. Five brain regions are shown for each subject. Extraction fraction (E) was calculated from slope of each line.
Extraction Fraction and Permeability Surface Product of 11C-dLop at Baseline and After Pharmacologic Inhibition of P-gp with Tariquidar (4 and 6 mg/kg Intravenously)
DISCUSSION
The results from this study confirm that 11C-dLop is a substrate for P-gp at the human blood–brain barrier and that the function of P-gp is inversely related to brain uptake of radioactivity. Similar to results in monkeys, the function of P-gp can be quantified from either a simple measure of brain uptake (AUC10–30) or the rate constant of brain entry (K1), and both are strongly correlated. However, the single-pass extraction fraction (E) of 11C-dLop is sufficiently high that both AUC10–30 and K1 should be corrected for regional CBF to separately measure the effects of permeability from those of drug delivery. Finally, our results suggest that the human blood–brain barrier expresses P-gp with such high capacity that a large degree of inhibition, via high doses of tariquidar, is required to overcome its efflux activity. On the basis of the limited data size in this study, we cannot make a definitive recommendation on which measure, AUC10–30 or K1, is superior for future studies with 11C-dLop.
Tariquidar increased brain uptake of 11C-dLop by increasing its entry (K1) rather than by decreasing its efflux (k2). These results support the notion that P-gp captures the substrate while in transit through the membrane, thereby preventing entry into brain (22). K1 is the product of flow and extraction (Eq. 1), and extraction itself is also a function of flow (Eq. 2). Among the variables listed in Equations 1 and 2, the primary effect of P-gp is to decrease permeability P. Thus, to measure the direct effect of P-gp, permeability (or some surrogate) must be calculated that corrects for the effect of blood flow. Although both K1 and E are dependent on flow, K1 shows the greater effect for physiologic values of flow. Thus, we recommend that either K1 or its surrogate AUC10–30 be corrected, that is, divided by, flow to more directly measure the function of P-gp.
Unlike the brain, uptake in the choroid plexus was not affected by inhibition of P-gp, even after correction for spill-in of activity from the surrounding brain. These results suggest that P-gp does not play a role in the accumulation of 11C-dLop in the choroid plexus. However, both the brain and the choroid plexus showed prolonged and unexplained retention of radioactivity. The retention is not caused by the radiotracer binding to opiate receptors, because naloxone is not able to displace uptake in monkey brain (13).
P-gp activity is only slightly inhibited by tariquidar at the dose of 2 mg/kg intravenously. This dose was used in clinical studies of tariquidar as an adjuvant to chemotherapy in patients with multidrug-resistant tumors (18,19). The largely negative results of these studies have led most to conclude that P-gp inhibition is not an effective method of improving delivery of chemotherapy to tumor cells. However, if multidrug-resistant tumors have the same large capacity of P-gp as that at the blood–brain barrier, the dose of tariquidar may have simply been too low.
Although tariquidar has been well tolerated at 2 mg/kg in moderately large trials of cancer chemotherapy, one of our patients at 6 mg/kg experienced a metallic taste in the mouth and mild nausea. Both symptoms abated shortly after the infusion was stopped. Although both symptoms were mild and are fairly common side effects of intravenous medications, we halted the study to explore whether they were side effects of tariquidar or of the compounds (propylene glycol and ethanol) used to dissolve the drug. We do not know the answer to this question. However, oral administration of tariquidar has been used in phase I studies (23) and may result in more stable amounts of P-gp inhibition while avoiding potential toxicity from propylene glycol.
PET with 11C-dLop has numerous clinical applications, such as predicting drug resistance in patients with cancer (1), epilepsy (4), and treatment-resistant psychiatric illness (3). Results from imaging with 11C-dLop might inform clinicians of the potential benefit or futility of available medications. In addition, imaging with 11C-dLop could aid in determining the influence of P-gp dysfunction in several neurodegenerative disorders, such as Alzheimer disease, that have been associated with decreased P-gp function. Because several medications are known to be inducers of P-gp function (24–26), pairing 11C-dLop imaging with directed treatment could slow the progression of these diseases.
CONCLUSION
P-gp function in humans can be quantified using PET and 11C-dLop. After the pharmacologic inhibition of P-gp, 11C-dLop has a sufficiently large extraction fraction to require that brain uptake be corrected for radiotracer delivery (i.e., CBF) to accurately measure the function of P-gp. Thus, in future clinical application we recommend blood flow be measured to correct uptake of 11C-dLop for any group or regional differences in the delivery of radiotracer.
Acknowledgments
We thank AzaTrius Pharmaceuticals for supplying tariquidar; Judith Starling, George Grimes, and Gerald Overman for formulating tariquidar; Jinsoo Hong and Yi Zhang for assistance in the production of radiotracer; and Maria D. Ferraris-Araneta, Barbara Scepura, Gerald Hodges, Leah Dickstein, Robert Gladding, and the NIH PET Department for successfully completing the PET studies. A patent application has been filed on behalf of the U.S. government for PET imaging of P-gp function. Sami Zoghbi, Victor Pike, and Robert Innis could personally benefit from this patent. This research was supported by the Intramural Research Program of NIMH (project Z01-MH-002852-04).
Footnotes
-
COPYRIGHT © 2010 by the Society of Nuclear Medicine, Inc.
References
- Received for publication September 2, 2009.
- Accepted for publication December 21, 2009.


Jump to section
Related Articles
Cited By...
- P-Glycoprotein (ABCB1) Inhibits the Influx and Increases the Efflux of 11C-Metoclopramide Across the Blood-Brain Barrier: A PET Study on Nonhuman Primates
- Assessment of P-Glycoprotein Transport Activity at the Human Blood-Retina Barrier with (R)-11C-Verapamil PET
- Modulation of P-glycoprotein at the Human Blood-Brain Barrier by Quinidine or Rifampin Treatment: A Positron Emission Tomography Imaging Study
- Quantification of 11C-Laniquidar Kinetics in the Brain
- The Inhibitor Ko143 Is Not Specific for ABCG2
- Quantification of Dynamic 11C-Phenytoin PET Studies
- Increased Permeability-Glycoprotein Inhibition at the Human Blood-Brain Barrier Can Be Safely Achieved by Performing PET During Peak Plasma Concentrations of Tariquidar
- Radiation Dose of the P-Glycoprotein Tracer 11C-Laniquidar
- Retrospective Analysis of P-Glycoprotein-Mediated Drug-Drug Interactions at the Blood-Brain Barrier in Humans
- Modeling Cyclosporine A Inhibition of the Distribution of a P-Glycoprotein PET Ligand, 11C-Verapamil, into the Maternal Brain and Fetal Liver of the Pregnant Nonhuman Primate: Impact of Tissue Blood Flow and Site of Inhibition
- Behavioral Effects and Central Nervous System Levels of the Broadly Available {kappa}-Agonist Hallucinogen Salvinorin A Are Affected by P-Glycoprotein Modulation In Vivo
- The controversial role of ABC transporters in clinical oncology
- A Novel Positron Emission Tomography Imaging Protocol Identifies Seizure-Induced Regional Overactivity of P-Glycoprotein at the Blood-Brain Barrier
- Transport of Selected PET Radiotracers by Human P-Glycoprotein (ABCB1) and Breast Cancer Resistance Protein (ABCG2): An In Vitro Screening
- Avoiding Barriers to PET Radioligand Development: Cellular Assays of Brain Efflux Transporters
- Lysosomal trapping of a radiolabeled substrate of P-glycoprotein as a mechanism for signal amplification in PET