


Abstract
Overexpression of the multidrug efflux transport P-glycoprotein may play an important role in pharmacoresistance. 11C-laniquidar is a newly developed tracer of P-glycoprotein expression. The aim of this study was to develop a pharmacokinetic model for quantification of 11C-laniquidar uptake and to assess its test–retest variability. Methods: Two (test–retest) dynamic 11C-laniquidar PET scans were obtained in 8 healthy subjects. Plasma input functions were obtained using online arterial blood sampling with metabolite corrections derived from manual samples. Coregistered T1 MR images were used for region-of-interest definition. Time–activity curves were analyzed using various plasma input compartmental models. Results: 11C-laniquidar was metabolized rapidly, with a parent plasma fraction of 50% at 10 min after tracer injection. In addition, the first-pass extraction of 11C-laniquidar was low. 11C-laniquidar time–activity curves were best fitted to an irreversible single-tissue compartment (1T1K) model using conventional models. Nevertheless, significantly better fits were obtained using 2 parallel single-tissue compartments, one for parent tracer and the other for labeled metabolites (dual-input model). Robust K1 results were also obtained by fitting the first 5 min of PET data to the 1T1K model, at least when 60-min plasma input data were used. For both models, the test–retest variability of 11C-laniquidar rate constant for transfer from arterial plasma to tissue (K1) was approximately 19%. Conclusion: The accurate quantification of 11C-laniquidar kinetics in the brain is hampered by its fast metabolism and the likelihood that labeled metabolites enter the brain. Best fits for the entire 60 min of data were obtained using a dual-input model, accounting for uptake of 11C-laniquidar and its labeled metabolites. Alternatively, K1 could be obtained from a 5-min scan using a standard 1T1K model. In both cases, the test–retest variability of K1 was approximately 19%.
In many central nervous system disorders, patients respond poorly to drug treatment. For example, 30% of all patients with epilepsy are therapy-resistant (1). In epilepsy, pharmacoresistance is attributed, at least in part, to the upregulation of multidrug efflux transporters at the blood–brain barrier, including P-glycoprotein (2). These efflux transporters transport substrates (including many central nervous system drugs) back into the circulation, thereby restricting their build-up in the brain (2). Consequently, cerebral drug levels may be too low for a therapeutic effect.
PET is a noninvasive molecular imaging technique that has the potential to measure distribution and function of P-glycoprotein in the human brain. Several P-glycoprotein tracers have been proposed, but in practice only (R)-11C-verapamil and 11C-N-desmethyl-loperamide have been used to assess P-glycoprotein function (3–7). Because both ligands are substrates of P-glycoprotein, their concentration in the brain is low. In the case of overexpression of P-glycoprotein, cerebral concentrations will be reduced even further. Consequently, noise levels will increase and accurate measurements of P-glycoprotein overexpression will become difficult. At present, the only option to assess P-glycoprotein overexpression is to obtain 2 scans in the same subject, one before and the other after P-glycoprotein inhibition (5), but the statistical limitations mentioned above remain.
Measurement of P-glycoprotein expression should be easier using a P-glycoprotein inhibitor rather than a P-glycoprotein substrate tracer, because such an antagonist should bind in a dose-dependent manner to P-glycoprotein—that is, overexpression of P-glycoprotein should result in an increased signal. Third-generation P-glycoprotein inhibitors, such as laniquidar, elacridar, and tariquidar, have recently been labeled with 11C (8–10). Unfortunately, initial studies on uptake of 11C-laniquidar in the rat brain have been inconclusive (10), and to date only a biodistribution study has been performed in humans (11). The purposes of the present study were to develop a tracer kinetic model for quantification of 11C-laniquidar kinetics in the brain of healthy volunteers and to define test–retest variability of the most appropriate outcome measure.
MATERIALS AND METHODS
Subjects
Healthy subject recruitment, screening, and inclusion and exclusion criteria were identical to those described previously (12). The study was approved by the Medical Ethics Review Committee of the VU University Medical Center, and before inclusion all subjects gave written informed consent after a complete written and verbal description of the study.
MR Imaging
All subjects underwent structural MR imaging using a 3-T MR imaging scanner (Signa HDXt; GE Healthcare) according to a standard protocol including T1-weighted 3-dimensional magnetization-prepared rapid acquisition gradient-echo images covering the whole brain, axial fluid-attenuated inversion recovery images, and T2 axial images. Coronal magnetization-prepared rapid acquisition gradient-echo images were used for coregistration and for region-of-interest (ROI) definition.
Synthesis of 11C-Laniquidar
11C-laniquidar was synthesized as described previously (10,11) in a good-manufacturing-practice-compliant manner. 11C-laniquidar was obtained as a sterile and pyrogen-free solution for intravenous injection in a yield of 800–1,700 MBq, a specific activity of 20–135 GBq·μmol−1, and a radiochemical purity greater than 98%. Polysorbate-80 (2.5% w/v) was added to dissolve 11C-laniquidar in a solution of 10% (v/v) ethanol in 7 mM sodiumphosphate buffer (pH 5.5) in saline.
PET Data Acquisition
In principle, participants underwent 2 identical PET scans on the same day. If this was not possible, the maximum interval between both scans was 1 mo. PET scans were obtained under standard resting conditions using an ECAT EXACT HR+ scanner (Siemens/CTI) (13). All subjects received both indwelling arterial (radial artery) and venous cannulas that were used for arterial blood sampling and tracer injection, respectively. After cannulation, patients were transferred to the scanner room and positioned such that the head was in the center of both the axial and the transaxial fields of view of the scanner. The head was immobilized to reduce movement artifacts and, using laser beams, positioned and checked for movement during scanning.
First, a 10-min transmission scan was obtained in 2-dimensional acquisition mode using 3 retractable rotating line sources. This scan was used to correct the subsequent emission scan for photon attenuation. After this transmission scan, an intravenous injection of approximately 370 MBq of 11C-laniquidar was administered, simultaneously with the start of a dynamic emission scan in 3-dimensional acquisition mode. 11C-laniquidar (in a 2.5-mL vial) was injected at a rate of 0.8 mL·s−1 using an infusion pump (Med-Rad), followed by a flush of 42 mL of saline at a rate of 2.0 mL·s−1. The emission scan consisted of 24 frames with increasing frame duration (1 × 15, 3 × 5, 3 × 10, 2 × 30, 3 × 60, 2 × 150, and 10 × 300 s) and a total scan duration of 60 min. During the emission scan, arterial blood was withdrawn continuously at a rate of 5 mL·min−1 for the first 5 min and 2.5 mL·min−1 thereafter using an automatic online blood sampler (Veenstra Instruments) (14). Continuous withdrawal was interrupted briefly at 2.5, 5, 10, 20, 30, 40, and 60 min after tracer injection for manual collection of 10-mL blood samples. After each manual sample, the arterial line was flushed with a heparinized saline solution. After a resting period of at least 3 h to allow for decay of 11C, the scanning sequence was repeated in exactly the same manner.
Plasma and whole-blood activity concentrations of the manual samples were measured using a Wallac Wizard 1480 gamma counter, which was cross-calibrated against the PET scanner. Manual blood samples were also used to determine plasma fractions of 11C-laniquidar and its radiolabeled metabolites. Metabolite analysis was performed using solid-phase extraction. In brief, 1 mL of plasma was diluted with 2 mL of acidified water (10 μL 6 M HCl) and passed over an activated SepPak tC18 (Waters). After being washed with 3 mL of water, the column was eluted with 3 mL of methanol. The first 2 fractions consisted of polar metabolites. Further analysis of the nonpolar methanol fraction showed only 1 compound (i.e., 11C-laniquidar).
PET Data Analysis
PET sinograms were corrected for dead time, scatter, randoms, decay, and tissue attenuation. Images were reconstructed using a standard filtered backprojection algorithm and an image matrix size of 256 × 256 × 63, resulting in a voxel size of 1.2 × 1.2 × 2.4 mm and a spatial resolution of approximately 7 mm in the center of the field of view. Next, PET and MR images were spatially coregistered using a mutual information registration algorithm incorporated within Vinci software (Max Planck Institute) (15). Structural T1 MR images were segmented in probability maps of gray matter, white matter, and cerebrospinal fluid using statistical parametric mapping (SPM5; Wellcome Trust Centre for Neuroimaging) (16). Thirty-eight ROIs were defined on the segmented MR image using a probabilistic template as implemented within PVElab software (17). Gray matter voxels that were not included in any of these spatially localized ROIs were assigned to a rest-of-gray-matter ROI, so that an additional analysis for total gray matter could be performed. All ROIs were mapped onto the coregistered dynamic PET images, thus generating corresponding time–activity curves.
The following ROIs were used for further analysis: frontal (volume-weighted average of orbital frontal, medial inferior frontal, and superior frontal), parietal, temporal (volume-weighted average of superior temporal and medial inferior temporal), medial temporal lobe (volume-weighted average of hippocampus and enthorinal), posterior cingulate and anterior cingulate, occipital, and cerebellum. Finally, a global brain ROI was defined as the volume-weighted average of all 38 original gray matter ROIs.
Kinetic Analysis
Whole-blood radioactivity concentrations derived from the manual arterial blood samples (excluding the 2.5-min-after-injection sample) were used to individually calibrate each online (whole-blood) sampler curve. Next, this calibrated whole-blood curve was transferred into a total plasma curve by multiplying it with a 3-exponential function that was fitted to the plasma–to–whole-blood ratios derived from all manual samples. Finally, the resulting total plasma curve was multiplied with a Hill function fitted to the time course of the parent fractions (18), resulting in a metabolite-corrected arterial plasma input function.
Tissue time–activity curves were fitted to irreversible and reversible 1- (1T1K: rate constant for transfer from arterial plasma to tissue [K1]; 1T2K: K1, k2, which are in- and efflux rate constants, respectively) and 2- (2T3K: K1, k2, k3; 2T4K: K1, k2, k3, k4; these are all rate constants for transfer between tissue compartments) tissue-compartment models using the metabolite-corrected plasma curve as input function. In all these models, blood volume VB was included as a fit parameter (using the calibrated whole-blood curve as its input function). In addition, a dual-input model with parallel parent and metabolite plasma input functions (Fig. 1) was investigated. The Akaike information criterion was used to select the best model (19). Finally, the possibility of reducing scan duration was investigated by removing an increasing number of frames from the end of each scan. Resulting outcome parameters were compared with those obtained from the full scan using correlation analysis and Bland–Altman plots (20).
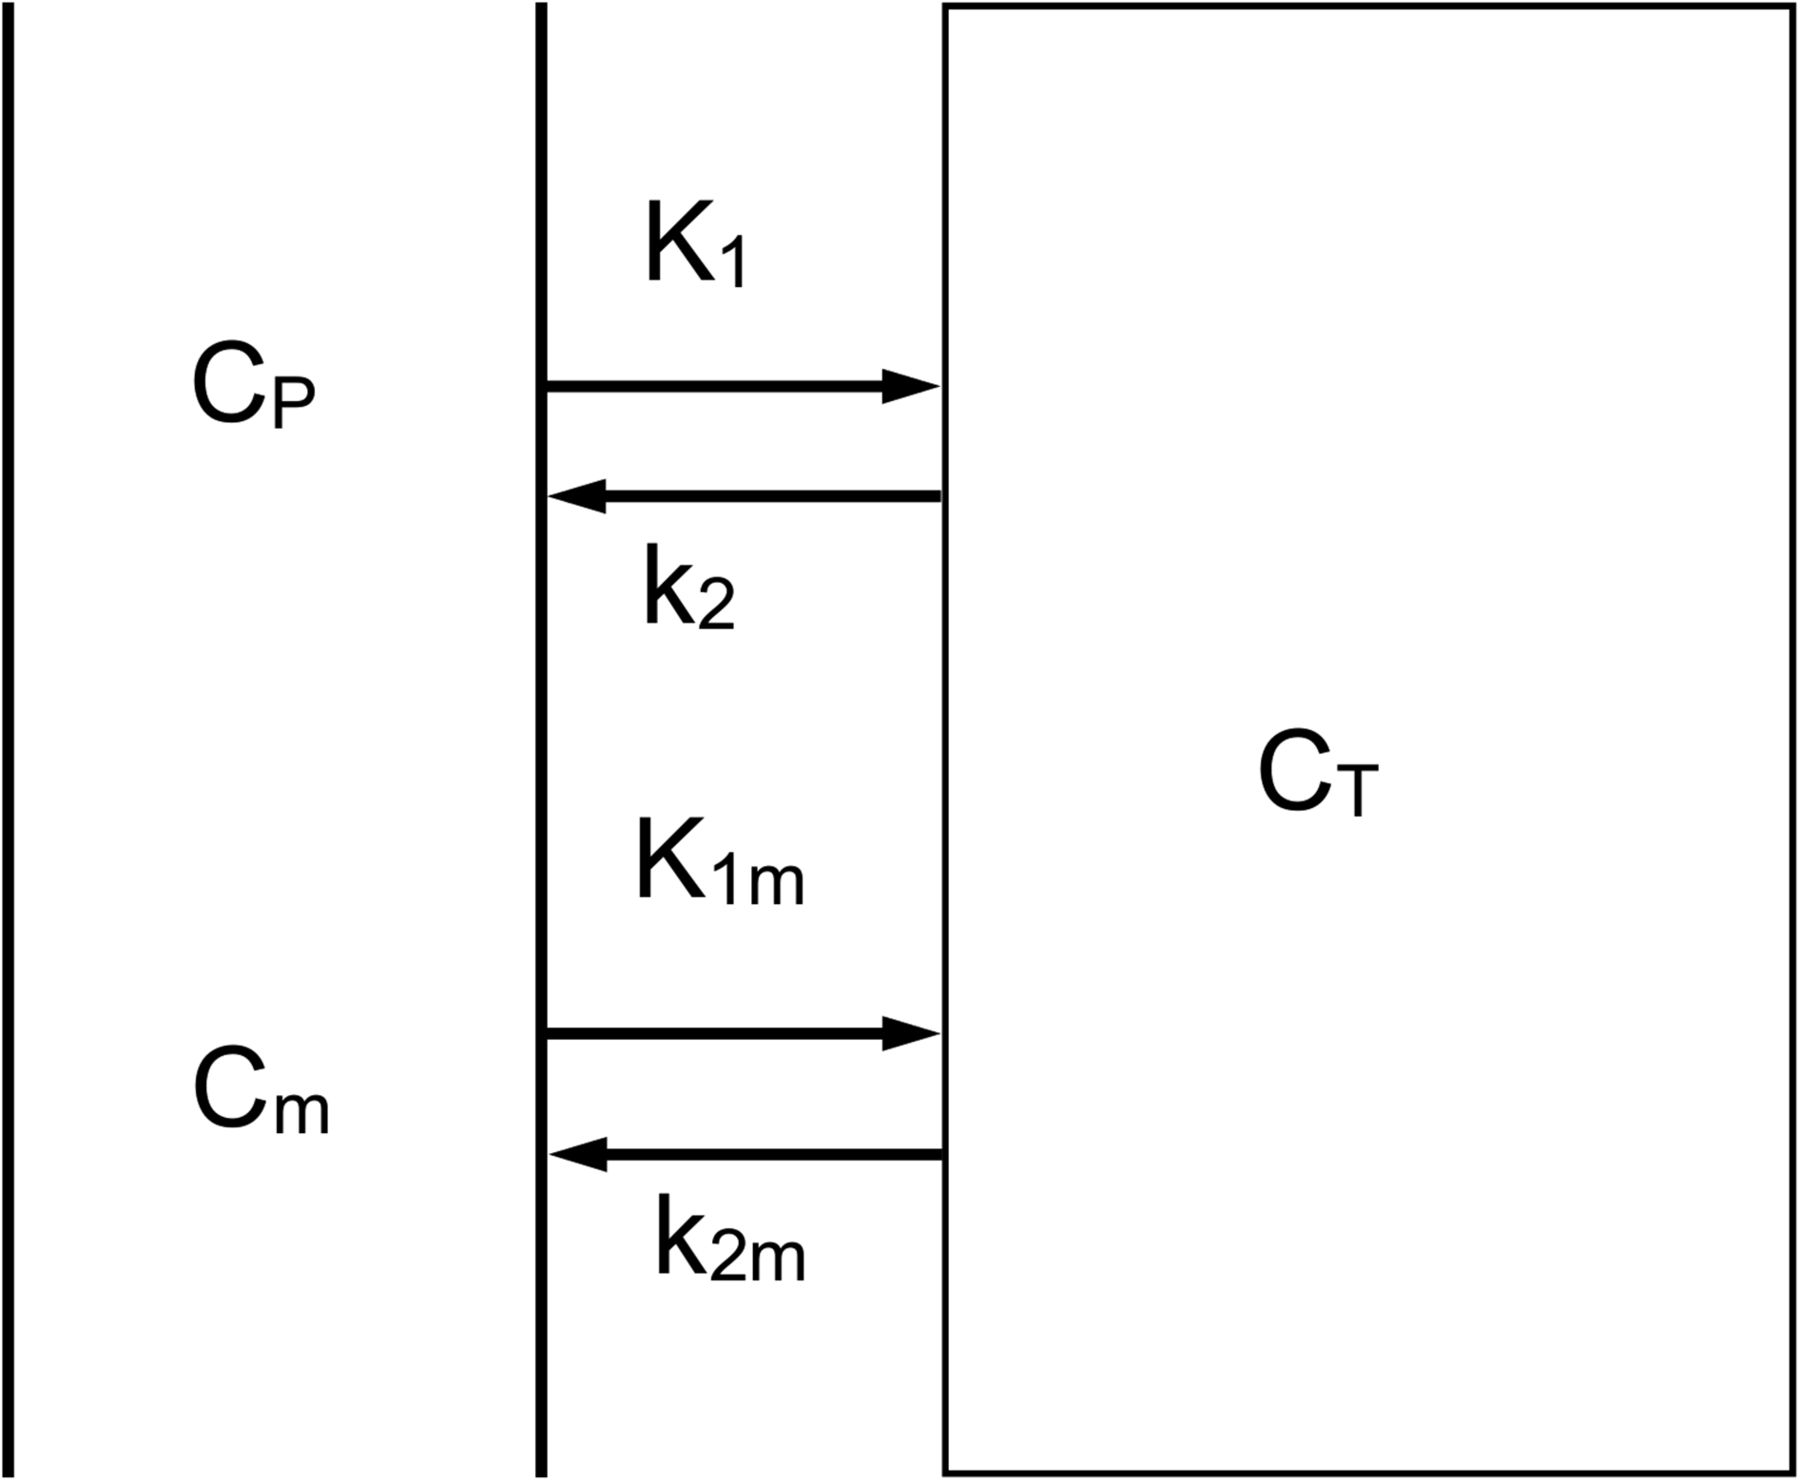
Dual-input model. CP and Cm represent plasma concentrations of parent tracer and labeled metabolites, respectively, and CT the concentration in tissue; K1 and k2 represent influx and efflux rate constants for parent tracer, respectively, and K1m and k2m influx and efflux rate constants for labeled metabolites, respectively.
Statistical Analysis
Test–retest variability was calculated as the absolute difference between test and retest scan values divided by their mean (12). P values for assessing differences in characteristics between test and retest scans were obtained using nonparametric Wilcoxon signed-rank tests. Data are presented as mean ± SD, unless otherwise stated.
RESULTS
Twelve healthy subjects were included (6 men; mean age, 32 y; age range, 19–63 y). As a result of technical problems (occlusion arterial line, tracer production failure), test–retest data of 8 subjects (5 men; mean age, 30 y; age range, 19–43 y) were available for analysis. Seven underwent 2 identical PET scans on the same day, and in 1 subject the second scan was obtained 1 mo after the first.
Blood Analysis
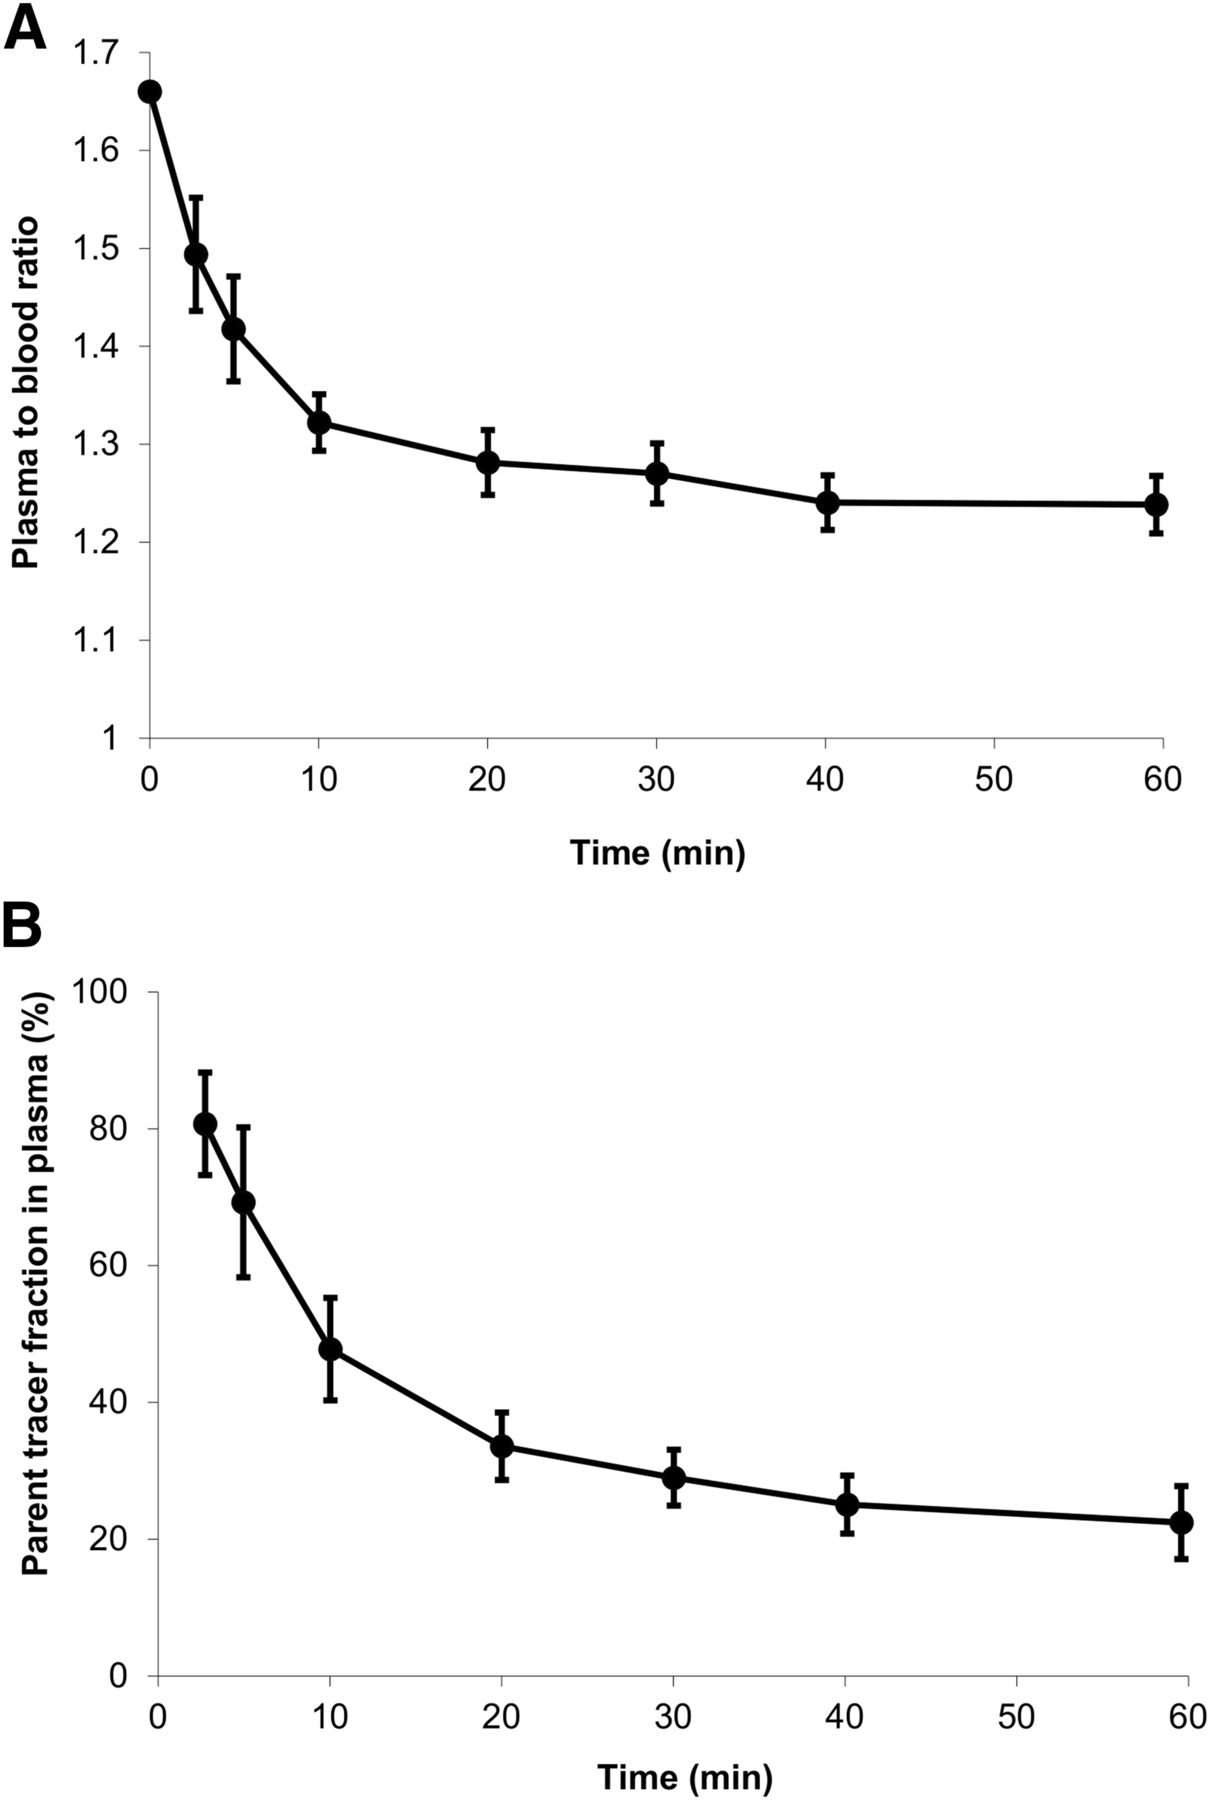
Plasma–to–whole-blood ratios and average parent fractions in plasma derived from the manual blood samples are shown in Figure 2. The plasma–to–whole-blood ratio decreased from 1.66 at the beginning of the scan to 1.23 at 60 min after tracer injection (Fig. 2A). The metabolism of 11C-laniquidar was relatively fast, with only 50% and 20% of parent tracer left at 10 and 60 min after tracer injection, respectively (Fig. 2B). No nonpolar metabolites were detected.

Plasma–to–whole-blood ratio (A) and parent tracer fraction in plasma (B) derived from manually collected blood samples as function of time averaged over all scans (vertical lines indicate SDs).
Kinetic Analysis
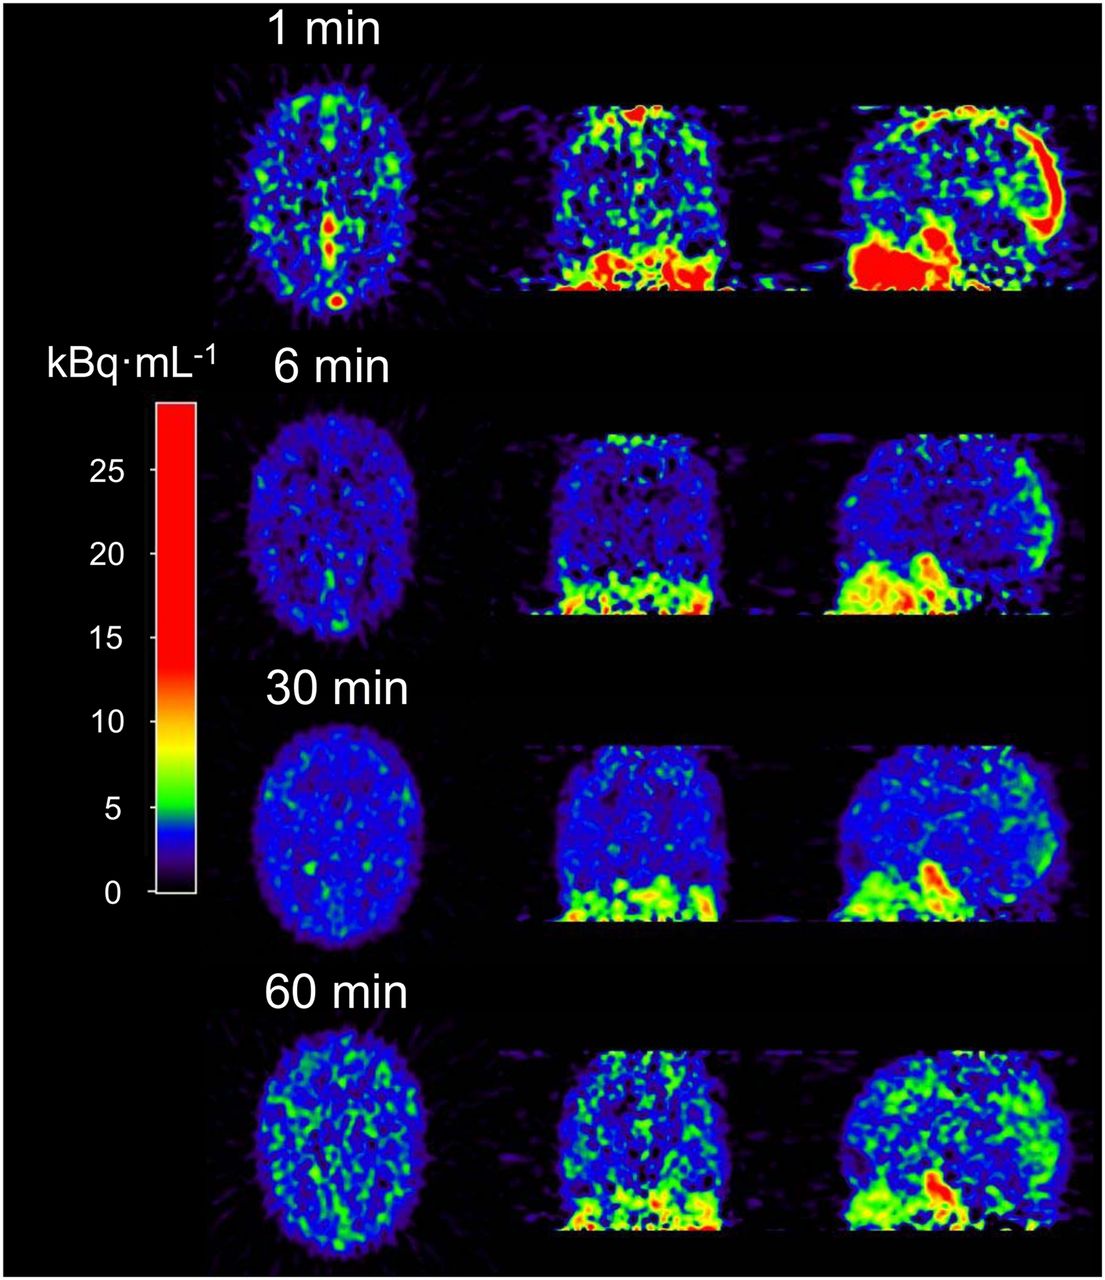
Kinetic analysis (n = 8) of 11C-laniquidar was complicated by low cerebral uptake and fast plasma clearance. Typical images at different time points after tracer injection are shown in Figure 3. Cerebral 11C-laniquidar uptake slowly increased over time (Fig. 4), suggesting irreversible or at least very slow binding. According to the Akaike information criterion, the 1T1K model was preferred over all standard plasma input models for 15 of the 16 scans, primarily because k2 was close to zero, and therefore additional kinetic parameters did not improve the quality of the fits.

Example of cerebral 11C-laniquidar images (kBq·mL−1) showing increased uptake at later times.
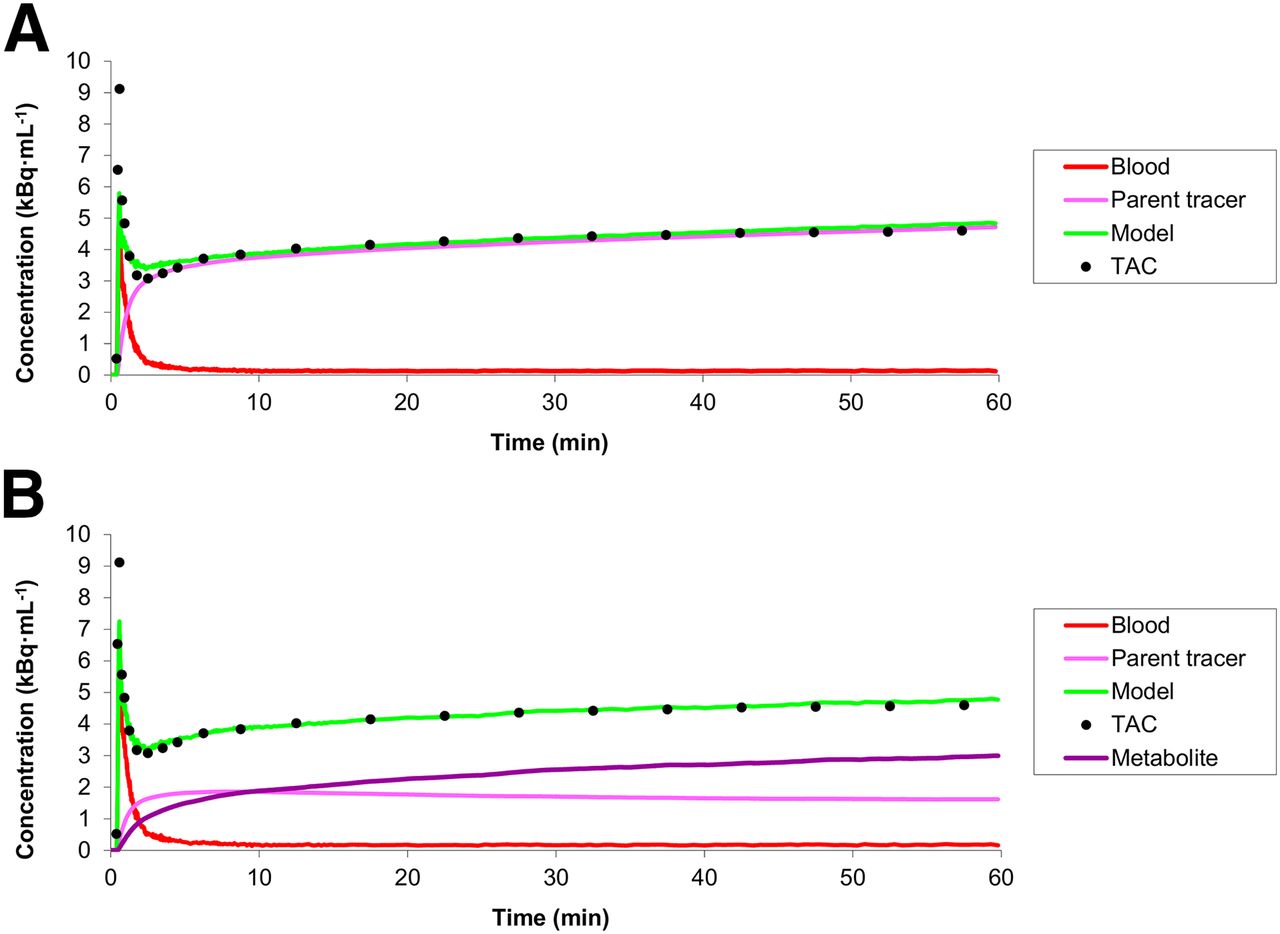
Example of fits to total gray matter 11C-laniquidar time–activity curves (TAC) using standard irreversible single-tissue-compartment model (A) and reversible dual-input model (B).
Although the 1T1K model provided the best fits to the 60-min time–activity curves, there were systematic differences between fits and measured data at early time points (Fig. 4A). Taking into account that radiolabeled metabolites of 11C-laniquidar, probably 11C-methanol resulting from hydrolysis of the methyl ester, may enter the brain, a dual-input model (Fig. 1) was evaluated. This dual-input model, indicating reversible tracer kinetics, provided better fits (Fig. 4B) than the standard 1T1K model (14 of the 16 scans provided lower Akaike information criterion scores). Unfortunately, fitted values for the volumes of distribution (VTs) with this dual-input model showed poor precision, especially for parent 11C-laniquidar (Table 1). In contrast, fitted values for parent K1 showed good precision (Table 1) and were close to those of the 1T1K model.
Kinetic Parameters of 11C-Laniquidar Obtained for Global Brain Using Dual-Input Model
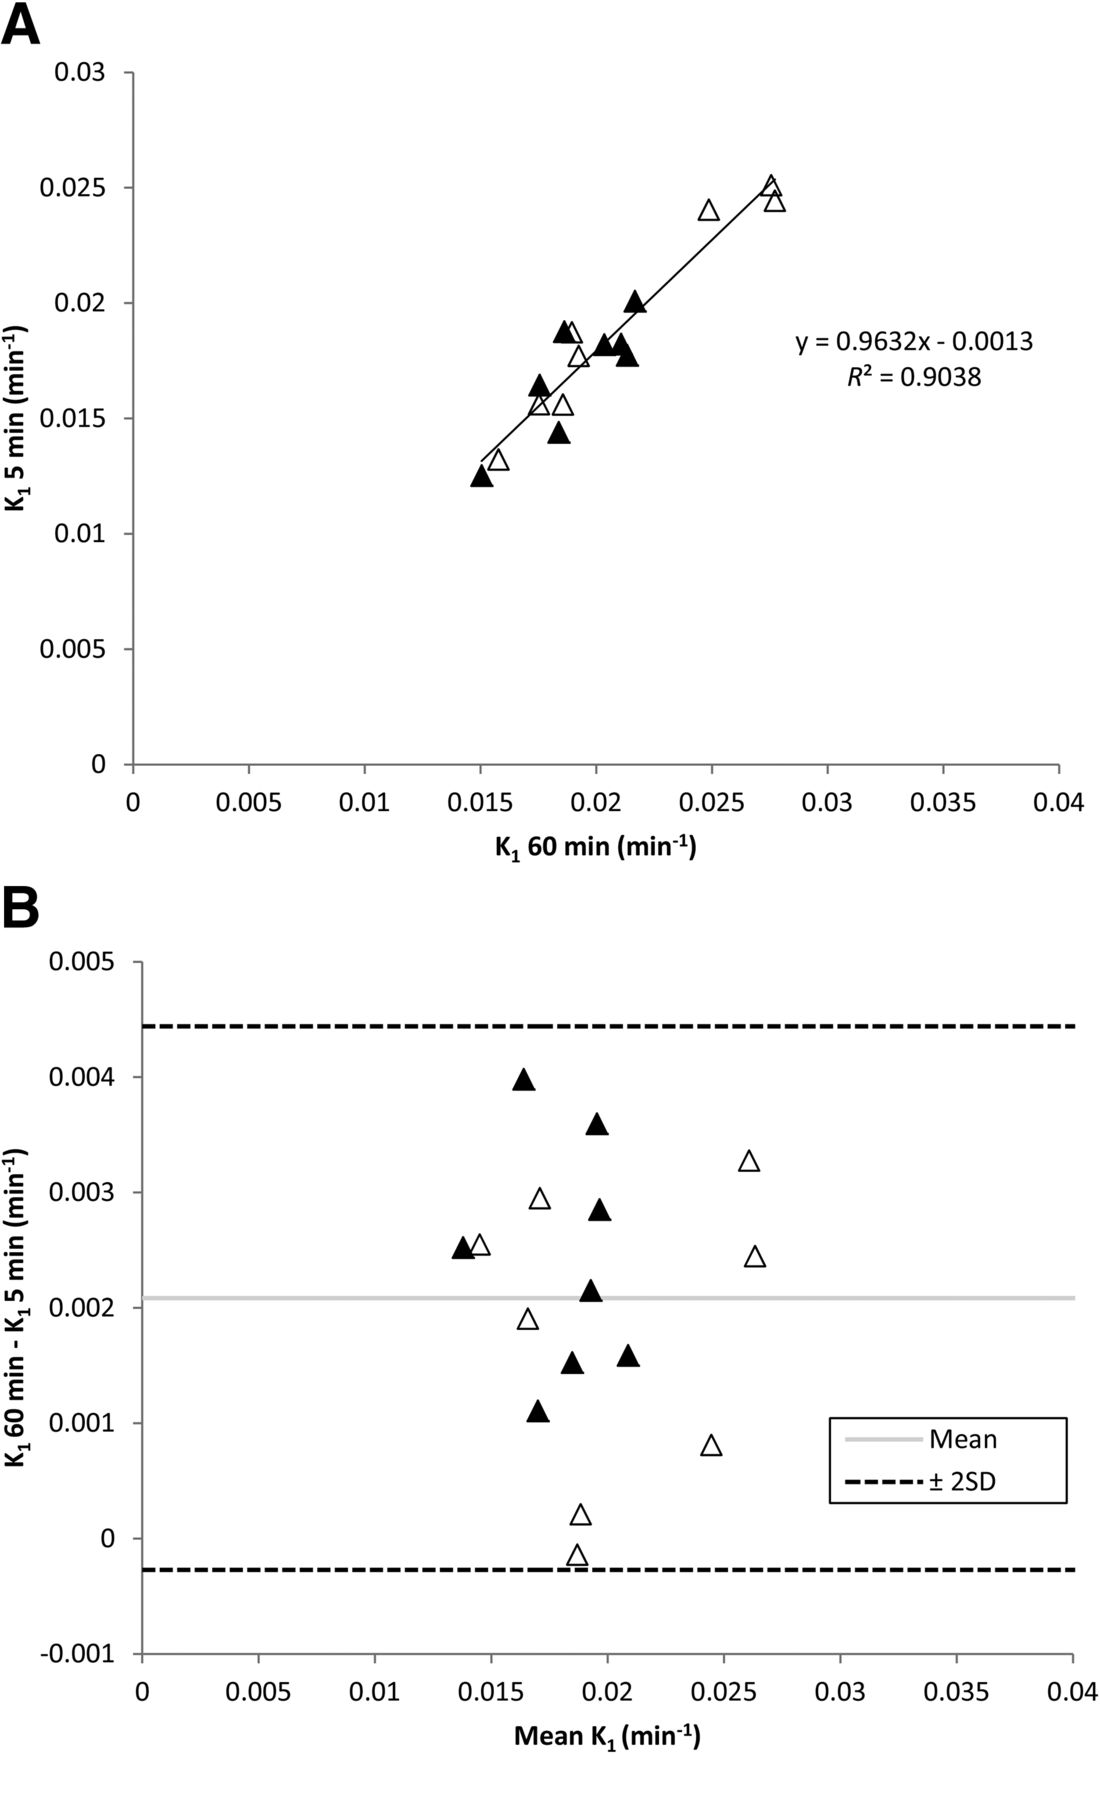
Given the simplicity of the 1T1K model, it seemed likely that scan duration could be shortened to simplify the scanning procedure, possibly enabling more patients to be scanned from a single tracer production. Several scan durations were investigated, indicating that a 5-min scan was sufficient for stable estimates of K1. Global brain K1 values were approximately 10% lower when only the first 5 rather than the full 60 min of scan data were used. This difference of approximately 10% was also observed at a regional level, with the exception of small ROIs (medial temporal lobe and anterior cingulate, both < 15 mL) in which on average up to 17% differences were observed. Global brain K1 values for test and retest were 0.019 ± 0.002 and 0.021 ± 0.005, respectively, for 60-min tissue data (1T1K model). Corresponding values for just the first 5 min of data were 0.017 ± 0.002 and 0.019 ± 0.005, respectively. Figure 5 shows the relationship between K1 values derived from 5 and 60 min of tissue data.

Correlation between 5- and 60-min scan duration for K1 (A) and Bland–Altman plot of global K1 values for 5- and 60-min scan duration (B). ▲ = test data; △ = retest data.
Test–Retest Variability
There were no differences between baseline and retest scans with respect to injected dose (347 ± 59 and 366 ± 27 MBq, respectively; P = 0.48) and specific activity (46 ± 26 and 71 ± 47 GBq·μmol−1, respectively; P = 0.093) of 11C-laniquidar. The injected mass of laniquidar, however, was significantly different between baseline and retest scans (11.35 ± 4.42 and 8.34 ± 3.40 nmol, respectively; P = 0.036), although the difference between test and retest scans was small, compared with the range of masses in either test or retest conditions.
Global brain test–retest variability of fitted 11C-laniquidar K1 values was 17.7 ± 15.0 (1T1K model), 19.6 ± 13.5 (1T1K model for first 5 min of tissue data), and 19.8 ± 12.7 (dual-input model). This variability was similar at the regional level when the 1T1K model was applied. However, regional fits using the dual-input model were unstable. Table 1 shows global brain test and retest values of fitted 11C-laniquidar rate constants and VT values (dual-input model).
DISCUSSION
This is the first study, to our knowledge, in which kinetics and uptake of the third-generation P-glycoprotein inhibitor 11C-laniquidar in the human brain were investigated. Several tracer kinetic models were assessed, but given the fact that k2 was close to zero, the best model was a single-tissue-compartment model with a single parameter (K1) for which 5 min of data collection was sufficient. This reduced scanning time was investigated, as it is patient friendly, and in principle several patients could be scanned using a single 11C-laniquidar production. Clearly, for reliable estimation of K1, online continuous blood sampling is essential, as an arterial input function with high temporal resolution is needed. However, K1 itself has limitations as a measure of P-glycoprotein expression, as in general K1 is flow-dependent, and even in the same subject day-to-day variations in cerebral blood flow do exist (21). In the case of 11C-laniquidar, however, K1 not necessarily is the product of cerebral blood flow and extraction fraction, as its main target is located on the capillary wall. Probably K1 represents a combination of P-glycoprotein expression and affinity for P-glycoprotein and possibly perfusion. Studies using combined 15O-water and 11C-laniquidar scans will be needed to determine the role of perfusion. Theoretically, a single-tissue-compartment model with k2 = 0 would be consistent with an irreversible inhibitor of P-glycoprotein. To conclusively determine whether 11C-laniquidar indeed acts as an inhibitor rather than as a substrate tracer in humans needs to be derived from future blocking studies.
For the 1T1K model, K1 values reduced by about 10% when only the first 5 min of tissue data were used for analysis, indicating that later time points still affected K1. One possible explanation could be an increasing effect of (uptake of) radiolabeled metabolites with increasing scanning duration, Nevertheless, the correlation between K1 values derived from 5- and 60-min datasets was good (Fig. 5). The analysis using 5 min of tissue data was performed using the entire plasma curve (60 min). To shorten study duration in future studies, the acquisition time of plasma data should also be shortened. Unfortunately, the present study protocol was not optimized for 5-min acquisition of plasma data. Nevertheless, the 5-min tissue data were reanalyzed using only information from the first 5 min of plasma data. Resulting K1 values were, on average, essentially the same as those derived from the analysis using all plasma data, although there was somewhat more spread in individual values. This indicates that, after optimizing, it should be feasible to shorten acquisition of plasma data to 5 min.
As mentioned above, metabolism of 11C-laniquidar was fast, with only 50% and 20% of intact 11C-laniquidar left at 10 and 60 min after tracer injection, respectively. This metabolic profile of 11C-laniquidar in humans is different from that in rats, for which 68% of parent 11C-laniquidar was still present at 30 min after tracer injection (10). The present findings, however, were not completely unexpected, as laniquidar is radiolabeled at the ester moiety, and methyl esters are known to be unstable in vivo (10) due to esterases in the blood. In fact, it is not clear why 11C-laniquidar metabolism in the rat is so low. A potential radiolabeled metabolite of 11C-laniquidar is 11C-methanol, which would result from hydrolysis of the methyl ester. Because this metabolite is likely to enter the brain and plasma levels of labeled metabolites were high, a dual-input model was evaluated. This model, accounting for uptake of both 11C-laniquidar and its labeled metabolites, provided good fits with reversible kinetics. Unfortunately, fitted parameters, especially VT, suffered from high variability (Table 1).
Although there are limitations in the use of K1 for assessing P-glycoprotein expression in the case of reversible inhibitors, the use of VT for reversible inhibitors also is not clear-cut. VT reflects the ratio of K1 and k2, which traditionally reflect rate constants for transport into and out of the brain, respectively. For P-glycoprotein, being located at the capillary wall, VT would only reflect P-glycoprotein expression if K1 and k2 reflect P-glycoprotein on and off rates, respectively. If the tracer also enters brain tissue, both these parameters will represent a mixture of binding characteristics to P-glycoprotein in the capillary wall, and transport in and out of the brain, complicating interpretation of measured VT values.
It has been suggested that, at tracer doses, laniquidar may act as a P-glycoprotein substrate rather than as a P-glycoprotein inhibitor, because cerebral 11C-laniquidar uptake was significantly higher in the presence of dose of 60 mg·kg−1 of laniquidar in wild-type mice (22). Furthermore, significantly increased cerebral uptake of 11C-laniquidar has been observed in rats pretreated with the P-glycoprotein inhibitor cyclosporine A (10). Being a P-glycoprotein substrate would provide a plausible explanation for low cerebral uptake in the present study. Another explanation for low cerebral 11C-laniquidar uptake could be that interaction between 11C-laniquidar and P-glycoprotein takes place at the blood–brain barrier, which only constitutes 0.1% of the total brain weight (23,24). In other words, the physical space for tracer accumulation is limited, compared with that of a tracer that enters the brain. Recently it has been postulated that not only very low P-glycoprotein density in the brain but also high protein binding of highly lipophilic P-glycoprotein inhibitors such as laniquidar, which in turn results in locally reduced plasma concentrations of the tracer of approximately 0.05%, account for the low cerebral 11C-laniquidar uptake (25).
Unfortunately, in the present study a significant difference in injected mass of laniquidar between test and retest scans was observed. Nevertheless, specific activity was 20 GBq·μmol−1 or higher, and therefore no pharmacologic effects would be expected. In addition, test–retest variability for both dual-input and 1T1K models was approximately 19% and no significant differences in K1 between test and retest 11C-laniquidar scans were found. Thus, the pharmacologic effect (if any) is negligible compared with test–retest variability.
CONCLUSION
Accurate quantification of 11C-laniquidar kinetics is hampered by its fast metabolism and the likelihood that labeled metabolites enter the brain. For the 60-min scan interval, best fits were obtained using a kinetic model consisting of 2 parallel single-tissue-compartment models, one for parent 11C-laniquidar and the other for labeled metabolites. A potential alternative could be the use of a single-tissue-compartment model applied to the first 5 min of data, which provided K1 values similar to the dual-input model. Reproducibility of 11C-laniquidar K1 values derived from both models was approximately 19%.
DISCLOSURE
The costs of publication of this article were defrayed in part by the payment of page charges. Therefore, and solely to indicate this fact, this article is hereby marked “advertisement” in accordance with 18 USC section 1734. The research leading to these results has received funding from the European Community's Seventh Framework Program (FP7/2007-2013) under grant agreement no. 201380. Johnson & Johnson Beerse Belgium is acknowledged for their kind gift of laniquidar. No other potential conflict of interest relevant to this article was reported.
Acknowledgments
We thank our colleagues for acquisition of MRI and PET data and for tracer production.
Footnotes
Published online Aug. 20, 2015.
- © 2015 by the Society of Nuclear Medicine and Molecular Imaging, Inc.
REFERENCES
- Received for publication March 16, 2015.
- Accepted for publication August 3, 2015.


