


Abstract
P-glycoprotein (P-gp) plays a pivotal role in limiting the penetration of xenobiotic compounds into the brain at the blood–brain barrier (BBB), where its expression increases with maturation in rats. We investigated developmental changes in P-gp function in the BBB of nonhuman primates using PET with R-11C-verapamil, a PET radiotracer useful for evaluating P-gp function. In addition, developmental changes in the brain penetration of 11C-oseltamivir, a substrate for P-gp, was investigated as practical examples. Methods: PET studies in infant (age, 9 mo), adolescent (age, 24–27 mo), and adult (age, 5.6–6.6 y) rhesus monkeys (Macaca mulatta) were performed with R-11C-verapamil and also with 11C-oseltamivir. Arterial blood samples and PET images were obtained at frequent intervals up to 60 min after administration of the PET tracer. Dynamic imaging data were evaluated by integration plots using data collected within the first 2.5 min after tracer administration. Results: R-11C-verapamil rapidly penetrated the brain, whereas the blood concentration of intact R-11C-verapamil decreased rapidly in all subjects. The maximum brain uptake in infant (0.033% ± 0.007% dose/g of brain) and adolescent (0.020% ± 0.002% dose/g) monkeys was 4.1- and 2.5-fold greater, respectively, than uptake in adults (0.0082% ± 0.0007% dose/g). The clearance of brain R-11C-verapamil uptake in adult monkeys was 0.056 ± 0.010 mL/min/g, significantly lower than that in infants (0.11 ± 0.04 mL/min/g) and adolescents (0.075 ± 0.023 mL/min/g). 11C-oseltamivir showed little brain penetration in adult monkeys, with a clearance of R-11C-verapamil uptake of 0.0072 and 0.0079 mL/min/g, slightly lower than that in infant (0.0097 and 0.0104 mL/min/g) and adolescent (0.0097 and 0.0098 mL/min/g) monkeys. Conclusion: These results suggest that P-gp function in the BBB changes with development in rhesus monkeys, and this change may be closely related to the observed difference in drug responses in the brains of children and adult humans.
Drug dosage regimen design and toxicologic assessment in children remain significant challenges in clinical care and environmental risk assessment because of the influence of ontogeny on drug disposition (1). Some drug-metabolizing enzymes display ontogeny (2,3) in humans, but the ontogeny of drug transporters has been described only in murine models.
The blood–brain barrier (BBB) restricts the entry of circulating drugs and xenobiotics into the brain, and thus the action of drugs in the central nervous system (CNS) depends on their systemic circulation and their ability to permeate the BBB. In the BBB, highly developed tight junctions between adjacent brain capillary endothelial cells act as a diffusion barrier. Metabolic enzymes and active efflux transporters for specific compounds are also located here (4,5). The formation of tight junctions is completed before birth, and mice lacking the tight junction protein claudin-5 die within 10 h of birth (6). Expression of the efflux transporter P-glycoprotein (P-gp) in the BBB, however, increases with age in rats (7,8).
P-gp is a 170-kDa membrane adenosine triphosphate–binding cassette efflux transporter encoded by the multidrug resistance 1 (rodents, Mdr1a or Mdr1b; humans, MDR1) gene (9,10). Numerous studies have revealed that P-gp limits the penetration of a variety of compounds into the brain by extruding them into the blood on the luminal membrane of brain capillary endothelial cells, thereby attenuating the pharmacologic action of drugs in the brain (11,12). Impairment of P-gp by gene mutation or inhibition of P-gp by drug–drug interaction sensitizes mice to ivermectin, morphine-6-glucuronide, and dasatinib and also sensitizes dogs to ivermectin, vincristine, vinblastine, and doxorubicin (13–15). Loperamide coadministered with the P-gp inhibitor quinidine reportedly causes respiratory depression, a CNS effect of opioids, presumably because of P-gp inhibition by quinidine (16). Thus, the changes in P-gp expression level in the brain may affect the brain concentration of P-gp substrates such as cyclosporine A and digoxin. Brain expression of Mdr1a P-gp, a predominant isoform in the BBB, is lower at the messenger RNA level in newborn rats on postnatal days 1–11 and lower at the protein level in newborn rats (postnatal days 1–7) and infant rodents (postnatal day 14) than in adult rats (postnatal days 42 and beyond) (7,8). It was reported that when loperamide, a P-gp substrate, was administered to young children as a drug for diarrhea, opiatelike side effects in the CNS were observed (17). Therefore, there is growing interest in how P-gp is expressed in the BBB during human development; a more thorough understanding of developmental changes in P-gp function in the BBB would greatly improve the ability to predict therapeutic benefits and potential risks associated with drug treatments in children.
The present study investigated P-gp function in the BBB in infant, adolescent, and adult nonhuman primates using PET. PET allows direct measurement of the brain concentration of administered radiotracer at multiple time points, with high sensitivity and spatial-temporal resolution, and has already been used for in vivo functional analysis of BBB-associated P-gp.
Among numerous 11C-labeled P-gp substrates, 11C-verapamil has been well characterized (18–20). Cyclosporine A and its analog significantly increase clearance of 11C-verapamil in the brain of monkeys and healthy humans (19,21). 11C-verapamil has been used to investigate variations in P-gp function at the BBB caused by single-nucleotide polymorphisms (22) and by Parkinson disease (23). We used R-11C-verapamil, an enantiomer of 11C-verapamil, as a probe for P-gp. Although there are no stereoselectivity effects in the transport of R- and S-verapamil by P-gp (18), R-11C-verapamil has several advantages over S-11C-verapamil, including a lower affinity for calcium channels and a lower metabolism in humans (24). Several reports showed that 11C-verapamil is also a sensitive probe for BBB P-gp activity in nonhuman primates (19,25–27).
Oseltamivir, an antiviral drug, has been reported to be a substrate of P-gp. Although the brain penetration of oseltamivir in primates has not been elucidated yet, its abnormal behavior in children is suspected to be due to CNS effects (28). Recently, Morita et al. (29) have reported on a procedure for the synthesis of 11C-oseltamivir for the application to 11C-oseltamivir PET in higher animals such as monkeys. Understanding of developmental changes in brain penetration of oseltamivir together with that in P-gp function would explain one of the causes of suspected aversive central effects in children. Therefore, in the present study, we also examined changes in brain penetration of 11C-oseltamivir during development as practical examples with the same monkeys used in 11C-verapamil study, to better understand the age-dependent adverse effects of 11C-oseltamivir.
MATERIALS AND METHODS
Radiolabeled Probes
11C-labeled R-verapamil was prepared from R-norverapamil (Advanced Biochemical Compounds), with slight modifications of previously described procedures for preparing racemic 11C-verapamil (30). 11C-labeled oseltamivir was prepared from its deacetylated derivative according to previously described procedures (29). Purified fractions of each compound were evaporated and reconstituted with approximately 5 mL of saline solution. The specific radioactivity was 55 ± 34 GBq/μmol and 46 ± 6 GBq/μmol for R-11C-verapamil and 11C-oseltamivir, respectively. The radiochemical purity and chemical purity of both compounds was higher than 98% at the time of synthesis.
Animals
Male rhesus monkeys (Macaca mulatta) weighing 1.4–1.9 kg (infant; age, 9 mo, n = 5), 2.0–2.6 kg (adolescent; age, 24–27 mo, n = 5), and 5.7–7.8 kg (adult; age, 5.6–6.6 y, n = 5) were used for the R-11C-verapamil study. Two of the 5 animals from each age group were also used in the 11C-oseltamivir PET study. Monkeys were maintained and handled in accordance with recommendations of the Center for Molecular Imaging Science, RIKEN Ethics Committee on Animal Care and Use. PET experiments were performed in accordance with the Guide for the Care and Use of Laboratory Animals (31).
PET
All PET scans were obtained using a microPET Focus 220 (Siemens) scanner designed for laboratory animals. Monkeys were sedated with ketamine (5 mg/kg, intramuscularly) combined with atropine hydrosulfate (0.08 mg/kg) and anesthetized with a continuous intravenous infusion of propofol (10 mg/kg/h). Monkeys were immobilized with a head-fixation device to ensure the accuracy of repositioning throughout PET scanning. During anesthesia, heart rate (electrocardiogram), body temperature, and oxygen saturation were monitored. Oxygen gas was administered through the nasal cannula throughout the study to maintain oxygen saturation. Before emission scans, the animal's head was placed near the center of the PET camera's field of view, and transmission scans with a rotating 68Ge/68Ga pin source were acquired for 30 min for reproduction of the brain positioning and attenuation correction.
At the start of the emission scan, R-11C-verapamil or 11C-oseltamivir was administered via the saphenous vein as a single bolus, and then saline was flushed into the catheter line to prevent radiotracer adsorption or retention. The injected doses of R-11C-verapamil and 11C-oseltamivir were 66 ± 19 and 77 ± 13 MBq/kg, respectively. Both PET scans were obtained in the same day. A dynamic emission scan in 3-dimensional list-mode was obtained for 60 min, and a total of 25 frames were collected in the following manner: 12 × 10, 6 × 30, 3 × 300, and 4 × 600 s. A matched MR image of the brain was obtained before or after the PET scan within 2 wk for infant and adolescent monkeys and within 4 wk for adult monkeys. After drug administration, arterial blood (∼0.5–1.5 mL) was sampled via an indwelling arterial port in the saphenous artery at the following times: 0.5, 1, 1.5, 2, 2.5, 4, 10, 20, 40, and 60 min (for infant and adolescent animals), and 8, 16, 24, 32, 40, 48, and 56 s and 1.1, 1.5, 2.5, 4, 10, 20, 30, and 60 min (for adults). The different blood sampling intervals for the younger and adult animals were used to limit the total volume of blood collected to no more than 5.6 mL/kg of body weight. Sampling intervals were designed so they did not influence the outcome parameter of integration plot analysis. Blood radioactivity was counted in a 1470 Wizard Automatic γ-Counter (PerkinElmer), and the radioactivity in each sample was corrected for time decay from the point of radiotracer administration.
Metabolite Analysis
R-11C-verapamil blood metabolites were analyzed at 1, 4, and 20 min. Arterial blood was deproteinized by adding an equivalent volume of acetonitrile, followed by centrifugation at 12,000 rpm for 2 min at 4°C. R-11C-verapamil and its metabolites were analyzed in the supernatant using a high-performance liquid chromatograph (Shimadzu Corp.) coupled to a NaI(Tl) positron detector (UG-SCA30; Universal Giken). Components were separated on a Luna C18 column (30 mm × 4.6 mm, 5 μm; Phenomenex Inc.) at a flow rate of 2.5 mL/min. The initial solvent conditions were acetonitrile:water (31:69, v/v) containing 10 mM ammonium acetate (pH 7.2). After a 0.2-min sample injection, the ratio of acetonitrile:water was changed to 80:20 (v/v) in a linear fashion over 2.3 min and maintained at 80:20 for 0.4 min. The column was then washed using initial solvent conditions. The amount of intact R-11C-verapamil was calculated as a percentage of the total amount of radioactivity.
Blood metabolites were analyzed at 1, 4, 10, 20, and 30 min after administration of 11C-oseltamivir. Arterial blood was deproteinized by adding an equivalent volume of acetonitrile, followed by centrifugation at 12,000 rpm for 2 min at 4°C. Each supernatant was applied to a RP-8 thin-layer chromatography plate (Merck), which was developed with an acetonitrile:water:formic acid (10:10:0.1) mobile phase. After migration, each plate was dried and exposed to BAS TR2040 imaging plates (Fuji Film). The distribution of radioactivity on the imaging plates was determined by digital photostimulated luminescence autoradiography using a FLA-7000 analyzer (Fuji Film).
Analysis of PET Data
PET images were reconstructed using microPET Manager (Siemens) and the following parameters: standard 2-dimensional filtered backprojection using a Hanning filter with cutoff of 0.4 cycles per pixel. A volume of interest was made from related regions of interest, which were delineated in 1 slice on the basis of the corresponding brain MR image using the PMOD 3.0 program (PMOD Technologies Inc.). For each volume of interest, the decay-corrected time-radioactivity was normalized to the injected dose (% dose) to construct time–radioactivity curves.
Kinetic Analysis
Initial uptake rates for each brain region were calculated by the integration plot method (32), identical to Patlak plot method (33,34), using time–radioactivity curves for short periods (0.5–2.5 min after administration), during which the effect of R-11C-verapamil or 11C-oseltamivir metabolism was negligible. The radiotracer uptake rate was obtained using Equation 1:
Statistical Analysis
Data are presented as the mean ± SD for 5 monkeys in the R-11C-verapamil study and the individual data for 2 monkeys in the 11C-oseltamivir study. When appropriate, significant differences between groups were identified using the Student 2-tailed unpaired t test and 1-way ANOVA, followed by Bonferroni's multiple-comparison procedure. Two-way ANOVA was used to test for differences in the ratio of brain concentration to blood concentration (Kp,brain) among the groups. Statistical significance was set at a p value less than 0.05.
RESULTS
Distribution of R-11C-Verapamil and 11C-Oseltamivir Radioactivity in Infant, Adolescent, and Adult Monkey Brains
Figure 1 shows typical PET brain images of the distribution of R-11C-verapamil or 11C-oseltamivir and corresponding morphologic MR images of infant (age, 9 mo) and adult (age, 6.5 y) monkeys. The uptake of 11C radioactivity after R-11C-verapamil or 11C-oseltamivir administration was higher in the brain of infants than in adults, although no adverse event was observed during and after the PET studies using both radiotracers. The highest uptake of both radiotracers was observed in the lateral and third ventricles, including the choroid plexus, of both infants and adults.

Color-coded fusion images of horizontal slices of summated PET images from 0.5 to 2.5 min and corresponding brain MRI scans for infant and adult monkey after administration of R-11C-verapamil or 11C-oseltamivir.
Time–radioactivity curves for R-11C-verapamil in the brain of infant, adolescent, and adult monkeys are shown in Figure 2A. In all animals, the amount of 11C radioactivity in the brain peaked at 0.25–4.3 min after intravenous administration of R-11C-verapamil. The maximum brain concentration (Cmax,brain) in infants, adolescents, and adults was 0.033 ± 0.007, 0.020 ± 0.002, and 0.0082% ± 0.0007% dose/g of brain, respectively. The Cmax,brain was significantly higher in the infant and adolescent groups than in the adult group (4.1-fold higher in infants and 2.5-fold higher in adolescents, Table 1, p < 0.05). The 11C radioactivity in the brain of adults remained constant at approximately 0.0077% dose/g until 60 min, whereas 11C radioactivity in the brain of infants and adolescents gradually decreased for 60 min. The brain area under the curve (AUCbrain) from 0 to 2.5 min was 0.081% ± 0.017% dose × min/g for the infant group, 0.049% ± 0.007% dose × min/g for the adolescent group, and 0.020% ± 0.002% dose × min/g for the adult group (Table 1).

Time–radioactivity curves for monkey brains after intravenous administration of R-11C-verapamil (A) or 11C-oseltamivir (B). Time profiles of radioactivity distribution in brains of rhesus monkeys were determined using PET during a 60-min period after radiotracer administration. Insets show curve detail in early time period (up to 2.5 min). Each data point represents mean ± SD (n = 5) for R-11C-verapamil–administered group and individual data of two 11C-oseltamivir–administered monkeys.
Pharmacokinetic Parameters of R-11C-Verapamil and 11C-Oseltamivir After Intravenous Administration.
Time–radioactivity curves for 11C-oseltamivir in the brains of infant, adolescent, and adult monkeys revealed that 11C radioactivity peaked in all groups within 0.25 min, rapidly decreased for 10 min, then gradually decreased until 60 min after intravenous administration (Fig. 2B). The Cmax,brain was 0.024% and 0.031% for infants, 0.017% and 0.022% for adolescents, and 0.0062% and 0.0086% dose/g for adults (Table 1). The AUCbrain from 0 to 2.5 min was 0.030% and 0.034% dose × min/g in the infant group, 0.021% and 0.026% dose × min/g in the adolescent group, and 0.0082% and 0.012% dose × min/g in the adult group (Table 1). There was a tendency toward a lower Cmax,brain and AUCbrain in the adult group; however, the differences were smaller than those observed in the R-11C-verapamil study.
Metabolism and Time–Radioactivity Profiles for R-11C-Verapamil and 11C-Oseltamivir in Arterial Blood
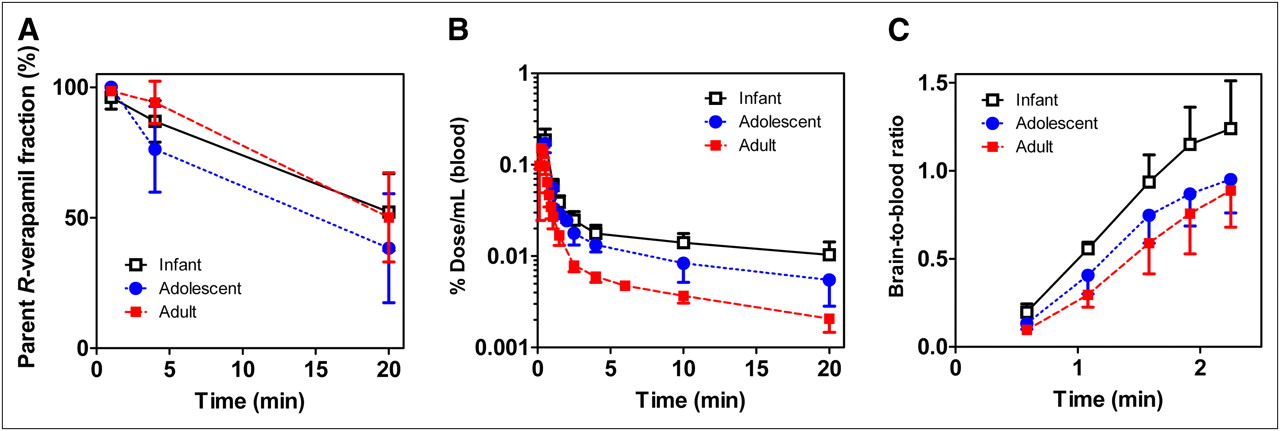
A radiochromatogram high-performance liquid chromatography analysis of R-11C-verapamil in arterial blood was performed to determine the plasma concentration of intact R-11C-verapamil. The retention time of intact R-11C-verapamil was approximately 2.4 min, and that of its major metabolite was 0.5 min (Supplemental Fig. 1A; supplemental materials are available online only at http://jnm.snmjournals.org). By 4 min after R-11C-verapamil administration, radioactivity associated with the R-11C-verapamil metabolite in the arterial plasma of infants, adolescents, and adults was approximately 15%, 30%, and 10% of the total radioactivity, respectively (Fig. 3A). Approximately 80% of plasma radioactivity was associated with the R-11C-verapamil metabolite by 30 min after administration.

Intact radiotracer time–activity curves for monkey blood and ratio of brain radioactivity to blood radioactivity after intravenous administration of R-11C-verapamil. (A) Fraction of blood radioactivity associated with intact R-11C-verapamil. (B) Temporal distribution of intact R-verapamil in monkey blood determined by sampling blood at various intervals after administration of R-11C-verapamil. (C) Ratio of brain radioactivity to blood intact R-verapamil activity was determined after administration of R-11C-verapamil. Each data point represents mean ± SD (n = 5).
Figure 3B shows time–radioactivity curves for intact R-11C-verapamil in blood. In all groups, R-11C-verapamil radioactivity fell sharply during the first 4 min after administration and then decreased gradually until 20 min. At all time points, blood radioactivity associated with intact R-11C-verapamil was significantly higher in the infant and adolescent groups than in the adult group. The AUC of intact R-11C-verapamil in blood from 0 to 2.5 min was 0.23% ± 0.10% dose × min/mL for the infant group, 0.20% ± 0.07% dose × min/mL for the adolescent group, and 0.10% ± 0.01% dose × min/mL for the adult group (Table 1).
Profiles of the ratio of brain concentration to blood concentration after administration of R-11C-verapamil are shown in Figure 3C. The Kp,brain for the infant group through 2.2 min was significantly higher than the Kp,brain for both the adolescent and the adult groups (2-way ANOVA, p < 0.05). In addition, the AUCbrain-to-AUCblood ratio was 2.3 ± 0.8-fold and 1.6 ± 0.5-fold higher in the infant and adolescent groups, respectively, than in the adult group.
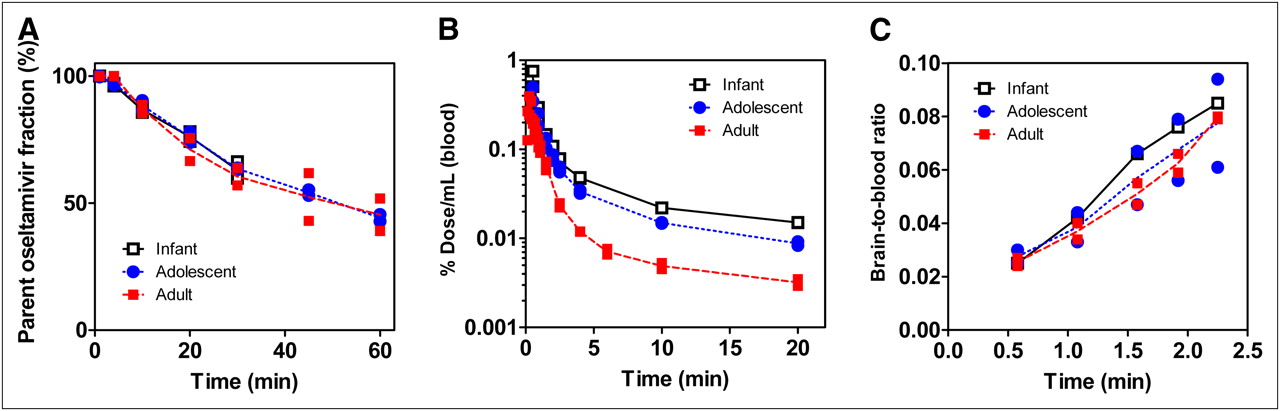
Analysis of the thin-layer chromatography autoradiograms showed that a metabolite of 11C-oseltamivir (11C-Ro 64-0802) was found in the blood (Supplemental Fig. 1B). At 4 min after administration of 11C-oseltamivir, radioactivity associated with 11C-Ro 64-0802 was less than 3% of the total radioactivity in the arterial blood in all animals (Fig. 4A). 11C-Ro 64-0802 radioactivity constituted approximately 30% of blood radioactivity by 20 min after administration. Radioactivity associated with intact 11C-oseltamivir was higher in the infant and adolescent groups than in the adult group at all time points (Fig. 4B), and the Kp,brain in the infant group through 2.2 min was slightly higher than in the adult group (Fig. 4C). The AUCbrain-to-AUCblood ratios for the infant and adolescent groups were 1.4- to 1.7-fold and 1.4- to 1.6-fold higher, respectively, than for the adult group.

Metabolite analysis of monkey plasma, intact radiotracer time–activity curves for monkey blood, and ratio of brain radioactivity to blood radioactivity after intravenous administration of 11C-oseltamivir. (A) Fraction of blood radioactivity associated with intact 11C-oseltamivir. (B) Temporal distribution of intact oseltamivir in monkey blood determined by sampling blood at various intervals after administration of 11C-oseltamivir. (C) Ratio of brain radioactivity to blood intact oseltamivir activity was determined after administration of 11C-oseltamivir. Each data point represents individual data of 2 monkeys.
Brain Uptake Clearance of R-11C-Verapamil or 11C-Oseltamivir in Infant, Adolescent, and Adult Monkeys
Individual integration plots of R-11C-verapamil or 11C-oseltamivir brain uptake are shown in Figure 5. The plots showed a clear linearity from 0.5 to 2.5 min after R-11C-verapamil or 11C-oseltamivir administration for all 3 groups. During this initial period, intact radiotracer and a small amount of metabolites accounted for more than 82% of 11C radioactivity in the blood. To obtain a more accurate analysis, the AUC0-t and Ct_blood were calculated from the concentration of intact radiotracer in the blood. Because the brain volume per body weight for individual monkeys differed among age groups (44 ± 8 g/kg in infants, 32 ± 3 g/kg in adolescents, and 13 ± 4 g/kg in adults), we calculated the brain uptake clearance (CLuptake,brain) on the basis of brain volume. The CLuptake,brain of R-11C-verapamil (mL/min/g) was 0.061 ± 0.011 in the adult group, significantly lower than the CLuptake,brain in the infant (0.14 ± 0.04, p < 0.01) and adolescent (0.087 ± 0.023, p = 0.06) groups (Table 1). VE,brain values for R-11C-verapamil (mL/g brain) in the infant, adolescent, and adult groups were 0.12 ± 0.03, 0.069 ± 0.019, and 0.048 ± 0.008, respectively. The 11C-oseltamivir CLuptake,brain was 0.0072 and 0.0079 mL/min/g in the adult group, slightly lower than the CLuptake,brain in the infant (0.0097 and 0.0104 mL/min/g) and adolescent (0.0097 and 0.0098 mL/min/g) groups (Table 1). 11C-oseltamivir VE,brain values (mL/g brain) were similar in the infant (0.024 and 0.031), adolescent (0.026 and 0.030), and adult (0.019 and 0.024) groups.

Individual integration plot of R-11C-verapamil (A) or 11C-oseltamivir (B) brain uptake in infant, adolescent, and adult monkeys.
DISCUSSION
We examined developmental changes in P-gp function in the BBB of nonhuman primates by comparing the CLuptake,brain of R-11C-verapamil and 11C-oseltamivir to determine whether there were age-related differences in drug response in the CNS.
The R-11C-verapamil AUCbrain and Cmax,brain were significantly higher in infants and adolescents than in adults (AUCbrain, 4.0- and 2.5-fold higher, respectively; Cmax,brain, 4.1- and 2.5-fold higher, respectively). The 11C-oseltamivir AUCbrain and Cmax,brain were also higher in infants and adolescents than in adults (AUCbrain, 4.1- and 2.3-fold higher, respectively; Cmax,brain, 3.7- and 2.7-fold higher, respectively). However, because the infant and adolescent AUCblood values were also higher than the adult AUCblood values (2.1- and 1.8-fold higher for verapamil and 1.6- and 1.5-fold higher for oseltamivir, respectively) (Fig. 4A), the greater AUCbrain and Cmax,brain values can be partially explained by greater systemic exposure. To exclude the effect of systemic exposure, we determined the CLuptake,brain for intact R-11C-verapamil and 11C-oseltamivir (the parameter disproportional to P-gp activity in the BBB (21)) using integration plot analysis. The initial slope of the plot was higher in the infant and adolescent groups than in the adult group after R-11C-verapamil administration. Therefore, it is most likely that P-gp expression increases with age in rhesus monkeys, as has been demonstrated in rats (8). Though the constant K1 (influx rate constant from blood to brain) or Vd (the volume of distribution in the brain) value calculated by a simple 1-tissue-compartment model has been used for measuring P-gp function at the BBB, it required several time points for a longer term to get the reliable nonlinear fitting. In our study, we used integration plot analysis, which needs the data only in the initial periods (0.5–2.5 min), during which the amounts of the metabolites in plasma were small; the influence of the metabolites might be negligible. The additional study with P-gp inhibitors may further confirm P-gp function at the BBB; however, the study could not be performed in this case because of the risk for exposure to high doses of P-gp inhibitors in younger monkeys.
Consistent with results of the R-11C-verapamil study, the 11C-oseltamivir CLuptake,brain was higher in the infant and adolescent groups than in the adult group. The age-related differences in CLuptake,brain for 11C-oseltamivir were unremarkable, compared with those for R-11C-verapamil, presumably because of 11C-oseltamivir's low BBB permeability derived from its low lipophilicity. To our knowledge, this study demonstrates for the first time age-associated developmental changes in P-gp function in the BBB in rhesus monkeys, using a noninvasive in vivo brain imaging technique. Using immunohistochemical analyses of infant and adult human postmortem brain samples, Daood et al. (35) reported that CNS P-gp expression increases during development. Combined with R-11C-verapamil PET analyses that showed that cerebral P-gp function decreases in older adults, these results suggested that human P-gp function in the BBB should also change with age (36). Therefore, it is possible that infant and adolescent brains are more sensitive to the pharmacologic and adverse effects of P-gp substrates than are adult brains, even though the systemic exposure is similar.
Ours is also the first study examining the brain penetration of 11C-oseltamivir in nonhuman primates. Hatori et al. (37) examined the disposition of 11C-oseltamivir in adult mice, but the brain concentration of 11C-oseltamivir was below the limit of detection. Conversion of 11C-oseltamivir to 11C-Ro 64-0802 by carboxy esterase occurs more rapidly in adult mice than in adult monkeys, primarily because of differences in carboxy esterase activity in mouse and monkey serum. Therefore, the lower brain to blood concentration ratio of 11C-oseltamivir in mice than in primates makes the nonhuman primate a better model for predicting how developmental changes affect the penetration of oseltamivir into the brain of humans.
The differences in 11C-oseltamivir CLuptake,brain and blood concentration between younger and adult animals in our study may partially explain the safety data in oseltamivir medication. We focused on oseltamivir; however, Ro 64-0802 is the major metabolite and is an active form of the drug that also penetrates the brain in mice with a low permeability, due to active efflux mediated by MRP4 (37,38). Ro 64-0802 is more potent than oseltamivir and causes neuronal excitability in rat hippocampal slices (39). Therefore, developmental changes in MRP4 activity should also be investigated.
The plasma concentrations of intact R-11C-verapamil and 11C-oseltamivir were slightly higher in younger monkeys than in adults. Because verapamil and oseltamivir systemic exposure depends on the activity of cytochrome P-450 and carboxy esterase, these data indicate that metabolic enzymes may show developmental changes. Strolin et al. (40) reported that age-related differences in the expression of some phase I and phase II enzymes do exist in humans, and Ose et al. (8) reported that conversion activity in newborn rat plasma and S9 specimens is lower than in adults. Developmental changes in metabolism may have a greater impact on the response to drugs in younger subjects. Because P-gp is also expressed in the liver and small intestine, developmental changes in P-gp expression in these organs will cause age-related differences in the systemic exposure of P-gp substrates. Schuetz et al. (41) reported that MDR1 messenger RNA in human pediatric livers is undetectable and suggested that P-gp expression appears to be developmentally regulated in the liver. However, such information is not available regarding P-gp expression in the small intestine.
CONCLUSION
This study examined age-related developmental changes in P-gp function in the BBB in nonhuman primates using in vivo R-11C-verapamil PET. The clearance of brain R-11C-verapamil uptake was significantly greater in younger monkeys than in adults, indicating that P-gp function in the BBB is immature in infant and adolescent monkeys. In addition, the PET study showed that brain penetration of 11C-oseltamivir changed with development and was slightly higher in younger monkeys.
DISCLOSURE STATEMENT
The costs of publication of this article were defrayed in part by the payment of page charges. Therefore, and solely to indicate this fact, this article is hereby marked “advertisement” in accordance with 18 USC section 1734.
Acknowledgments
We are indebted to Akihiro Kawasaki, Chiho Takeda, Yumiko Katayama, and Emi Hayashinaka for their expert technical assistance. This study was supported in part by a consignment expense from the Molecular Imaging Program on “Research Base for Exploring New Drugs” from the Ministry of Education, Culture, Sports, Science, and Technology (MEXT), Government of Japan.
- © 2011 by Society of Nuclear Medicine
REFERENCES
- 1.
- 2.
- 3.
- 4.
- 5.
- 6.
- 7.
- 8.
- 9.
- 10.
- 11.
- 12.
- 13.
- 14.
- 15.
- 16.
- 17.
- 18.
- 19.
- 20.
- 21.
- 22.
- 23.
- 24.
- 25.
- 26.
- 27.
- 28.
- 29.
- 30.
- 31.
- 32.
- 33.
- 34.
- 35.
- 36.
- 37.
- 38.
- 39.
- 40.
- 41.
- Received for publication October 12, 2010.
- Accepted for publication February 16, 2011.


Jump to section
Related Articles
Cited By...
- Evaluation of Oatp and Mrp2 Activities in Hepatobiliary Excretion Using Newly Developed Positron Emission Tomography Tracer [11C]Dehydropravastatin in Rats
- Species-Dependent Uptake of Glycylsarcosine but Not Oseltamivir in Pichia pastoris Expressing the Rat, Mouse, and Human Intestinal Peptide Transporter PEPT1