


Abstract
This study assessed the process of gastrointestinal drug absorption in vivo using PET. Methods: 18F-FDG was used as a model probe and was orally administered to rats as a solution. PET scans were obtained of the whole body and abdominal region under conscious and anesthetized conditions. Blood samples were routinely taken from the femoral vein during scanning. The rate of gastric emptying and intestinal absorption of 18F-FDG was estimated from the time profiles of radioactivity in the stomach and small intestine. In addition, nonradiolabeled 2-fluoro-2-deoxy-d-glucose (2-FDG) was used in an intestinal closed-loop experiment to compare the intestinal permeability of 2-FDG with that of d-glucose. Results: In conscious rats, gastrointestinal absorption of 18F-FDG was rate-limited by the process of intestinal membrane permeation, because the permeability of 2-FDG through the intestinal membrane was low compared with that of d-glucose. In anesthetized rats, the gastric emptying rate of 18F-FDG decreased dramatically whereas the intestinal absorption rate constant was not significantly different from that in conscious rats. As a result, the rate-limiting step of gastrointestinal absorption of 18F-FDG was shifted to the gastric emptying process by anesthesia. Conclusion: PET technology is a powerful tool for in vivo analysis of the gastrointestinal absorption of orally administered drugs.
Gastrointestinal absorption of orally administered drugs involves many processes that occur in parallel or sequentially, starting with the disintegration and dissolution of drugs in the gastrointestinal fluid and continuing to the transit of drugs in the gastrointestinal tract, permeation of drug molecules through the intestinal membrane, and metabolism in the intestine or liver. The rate and amount of drug absorption into systemic circulation are defined as total outputs of these processes. Except for first-pass metabolism, the rate and amount of drug absorption are expressed by the following equations,
The Peff of drugs can be estimated by in vitro or in situ experiments (1,2). At pharmaceutical companies, in vitro permeation assays with cultured cell systems such as Caco2 or Madin-Darby canine kidney cell monolayers are widely used to determine drug permeability (3,4). Luminal concentration is affected by various factors, including drug solubility, dissolution rate, and the volume of gastrointestinal fluid. Among these factors, drug solubility and dissolution profiles can be evaluated by in vitro experiments. Recently, the use of simulated intestinal fluid under fasting or fed conditions has enabled the estimation of drug dissolution in the gastrointestinal tract in vivo (5,6). The gastrointestinal transit of drugs also concerns time profiles of drug concentration in the gastrointestinal tract and has been investigated extensively, usually from time profiles of the blood concentration of orally administered marker drugs such as acetaminophen, sulfasalazine, or polyethylene glycol 4000 (7–9).
However, the transit of drugs in the gastrointestinal tract may not be constant, as represented by parameters such as gastric emptying rate and intestinal transit rate or residence time, but drugs may move dynamically in the gastrointestinal tract according to its peristaltic movement. To predict the absorption profile and then the blood concentration–time profile of orally administered drugs, therefore, one needs more detailed information on the drug disposition in the gastrointestinal tract in vivo.
PET is a powerful and noninvasive technology for molecular imaging in living systems. Its high sensitivity and high spatial–temporal resolution make this technology particularly useful for analyzing the disposition of drugs in the body. In this study, PET technology was applied to analyze the process of oral drug absorption based on the time profiles of drug disposition in the gastrointestinal tract in vivo. As a model compound, 18F-FDG was used, and the radioactivity in the whole body and abdominal regions was scanned after oral administration to rats.
18F-FDG is a well-known PET probe for diagnosis of cancer (10–12). Because 18F-FDG is an analog of glucose, some glucose transporters might be involved in its absorption from the intestinal tract. To clarify the mechanisms of oral absorption of 18F-FDG, in situ intestinal loop experiments were also performed.
The results obtained here will bring a new understanding of the actual process of oral drug absorption in vivo. Furthermore, because PET technology is noninvasive and can be applied to human clinical studies, drug absorption processes in humans are expected to be fully clarified in the future through the methods and findings of this study.
MATERIALS AND METHODS
All experimental protocols were approved—for the PET study, by the Ethics Committee on Animal Care and Use of the Center for Molecular Imaging Science in RIKEN, and for the permeation study, by the Ethical Review Committee of Setsunan University—and were performed in accordance with the principles of laboratory animal care (13).
Chemicals
18F-FDG was provided by the Division of Molecular Imaging at the Institute of Biomedical Research and Innovation. [UL-13C6]-d-glucose, in which all carbon atoms of glucose were substituted to 13C, was obtained from WAKO Pure Chemical Industries, Ltd. Isoflurane (Escain) was purchased from Mylan-Japan, and propofol (Hospira) was purchased from Hospira Inc.
Animals
Male Sprague–Dawley rats weighing 200–250 g (7–8 wk old) were kept fasting for 24 h before the end of the experiment and had free access to water before the experiments that followed (n = 3 for each set of experiments).
PET Scans
All PET scans were obtained using a microPET Focus220 (Siemens). For the experiment under anesthetic conditions, the rats were anesthetized and maintained with a mixture of 1.5% isoflurane and nitrous oxide:oxygen (7:3) or with a solution of propofol (20 mg/mL) in saline (priming dose: 20 mg/kg; infusion rate: 20 mg/h/kg), and then the femoral vein was cannulated with a polyurethane tube. For the experiment under conscious conditions, the femoral vein was cannulated with a polyurethane tube while the rats were under isoflurane anesthesia, and after recovery from the anesthesia, the rats were placed in a small-animal retainer (Molecular Imaging Laboratory Inc.). During the experiments, the body temperature of the rats was kept at 37°C using a temperature controller (CMA 150; CMA Microdialysis AB). Before the PET scan, rats were placed in the center of the camera, and a 25-min transmission scan with a rotating 68Ge–68Ga point source was performed for abdomen positioning and attenuation correction.
18F-FDG was diluted with an appropriate volume of saline to produce a 50 MBq/mL concentration of 18F for administration to rats. At the start of the PET scan, 18F-FDG was administered orally in doses of 100 MBq/2 mL/kg. PET data were acquired in 4 parts: an emission scan of the abdominal region from 0 to 30 min, a static scan of the whole body from 35 to 40 min, an emission scan of the abdominal region from 45 to 75 min; and a static scan of the whole body from 80 to 85 min. All emission scans were performed in 3-dimensional list mode. The data of the first emission scan were sorted into a sinogram according to the following sequence: 20 × 15 s, 25 × 60 s. The data of the second emission scan were sorted into sinograms for every 300 s. The data of the 2 whole-body scans with continuous bed motion were sorted into static sinograms. Blood was sampled via the cannulated femoral vein at 5, 10, 20, 30, 45, 60, and 90 min after administration of 18F-FDG. The volume of the blood sample at each time point was 150 μL, and the total volume of sampled blood from each rat did not exceed 1.6 mL (∼10% of total blood volume in rats).
Intestinal Permeability Studies
The permeability of 2-fluoro-2-deoxy-d-glucose (2-FDG) (nonlabeled) and d-glucose through rat intestinal membrane was measured by an in situ closed-loop method. The anesthetic pentobarbital was chosen because it can induce a long period of anesthesia through a single intraperitoneal injection and is easy to use in an in situ experiment involving surgical opening of the abdomen. After the abdominal cavity had been opened, an intestinal loop (10 cm long) was made at the proximal jejunum by cannulating a silicone tube (internal diameter, 3 mm), and the intestinal contents were then removed by a slow infusion of saline and air. One milliliter of test solution containing 2-FDG (0.1 mM) or [UL-13C6]-d-glucose (0.1 mM) was introduced into the intestinal loop, and both ends of the loop were ligated. To investigate the contribution of transporter, phlorizin (1.0 mM) or a high concentration of d-glucose (20 mM) was used as an inhibitor. Five minutes after each solution had been applied, the luminal solution in the loop was collected. The permeability of compounds was evaluated by determining the percentage of dose absorbed, which was calculated by subtracting the remaining amount of compound from the administered amount.
Analytic Methods
The radioactivity in the blood samples was counted by an automatic γ-counter (1470 Wizard; PerkinElmer) and corrected for time decay from the point of 18F-FDG administration.
The amounts of compounds in residual solution in the loop were determined by an ultraperformance liquid chromatography system (Acquity UPLC; Waters) equipped with a tandem mass spectrometer (Acquity tandem quadrupole detector; Waters). The normal-phase column (Asahipak NH2P-50 2D, 5 μm, 150 × 2.0 mm internal diameter; Shodex) was used with a mobile phase consisting of purified water and acetonitrile (10/90 for 2-FDG, 20/80 for [UL-13C6]-d-glucose) containing 0.1% (v/v) ammonia. The flow rate and injection volume were 0.25 mL/min and 5 μL, respectively. Ionization conditions for analysis of both compounds were as follows: electrospray ionization, negative mode; source temperature, 150°C; desolvation temperature, 400°C; cone voltage, 20 V; and collision energy, 10 eV. Precursor and production ions (m/z) of 2-FDG are 181.06 and 103.04, respectively, and those of [UL-13C6]-d-glucose are 185.00 and 91.88, respectively.
PET Image Analysis
All emission data were reconstructed with microPET manager 2.4.1.1 (Siemens) by Fourier rebinning and 2-dimensional filtered backprojection using a ramp filter with a cutoff at the Nyquist frequency (0.5 cycle/pixel, defined as an upper frequency limit for the reconstruction filter in this study) or by Fourier rebinning and maximum likelihood expectation maximization. Compared with filtered backprojection, maximum likelihood expectation maximization provides images with better spatial resolution and better statistical noise properties, which are advantageous for image registration. On the other hand, filtered backprojection–reconstructed images were used for quantification. Regions of interest (ROI) were delineated in 1 slice for the stomach and small intestine, which were visually identifiable, using the PMOD 3.0 program (PMOD Technologies Inc.). For the stomach, ROIs were manually defined on images obtained soon after 18F-FDG administration in which the stomach could easily be identified and its border drawn around an area with a standardized uptake value of 10. For the intestine, ROIs were manually defined as slightly larger than the imaged intestine on each slice, with the border drawn around an area with a standardized uptake value of 3 that did not include stomach, liver, kidney, spleen, and urinary bladder. The defined ROIs were then corrected by fitting the images of each tissue slice and time frame. All ROIs were combined and changed to volumetric regions of interest (VOIs). For calculating the total amount of radioactivity distributed in the tissues, the stomach and intestine ROIs were defined on images that did not include the liver, kidney, spleen, and urinary bladder and were drawn slightly larger than the stomach and intestine seen on those images. Defined VOIs for each tissue were applied to the images reconstructed with filtered backprojection, and then the radioactivity in each tissue was calculated and was normalized to the administered dose (% of dose/tissue).
Rate Constants
Assuming that gastric emptying follows the first-order rate kinetic and disappearance from the intestinal tract corresponds to absorption into the blood circulation (also first-order), rate constants of gastric emptying and intestinal absorption were obtained by fitting the data to the simple absorption kinetic model using a nonlinear least-squares program (MULTI) (14).
Pharmacokinetic Parameter from 18F-FDG Blood Profile
The area under the blood concentration–time curve from 0 to 90 min was calculated according to a linear trapezoidal formula. The maximum concentration (Cmax) and the time to reach Cmax (Tmax) were also obtained from the blood concentration–time profile of individual rats. The absorption rate constant (ka) was calculated by a deconvolution method using the time course of the blood concentration of radioactivity after oral and intravenous administration of 18F-FDG to rats (intravenous data are not shown).
Intestinal Permeability Calculations
The following equation was used to calculate the permeability.
Statistical Analysis
Data are presented as means with SDs for individual groups. Statistical significance was assessed with 1-way ANOVA for in vitro studies and with the unpaired Student t test for in situ studies, and P values of 0.05 or less were considered significant.
RESULTS
PET Images of 18F-FDG
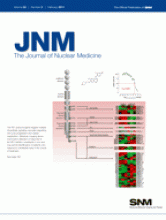
At 40 min after oral administration of 18F-FDG to conscious rats, the radioactivity was distributed in the entire body and was highly accumulated in the skeletal muscle, urinary bladder, Harderian glands, salivary glands, and brain (Fig. 1A). Then, the radioactivity in those tissues declined gradually with time. Finally, most of radioactivity was observed in the urinary bladder through excretion into urine (Fig. 1B). In anesthetized rats, the radioactivity in the esophagus, stomach, and small intestine was higher than that in conscious rats at both 40 and 85 min after administration. Distribution to the whole body and urinary excretion of radioactivity was much lower in anesthetized rats than in conscious rats (Fig. 1).

Coronal maximum-intensity-projection whole-body PET images after oral administration of 18F-FDG to conscious and anesthetized rats: 40 min (A) and 85 min (B).
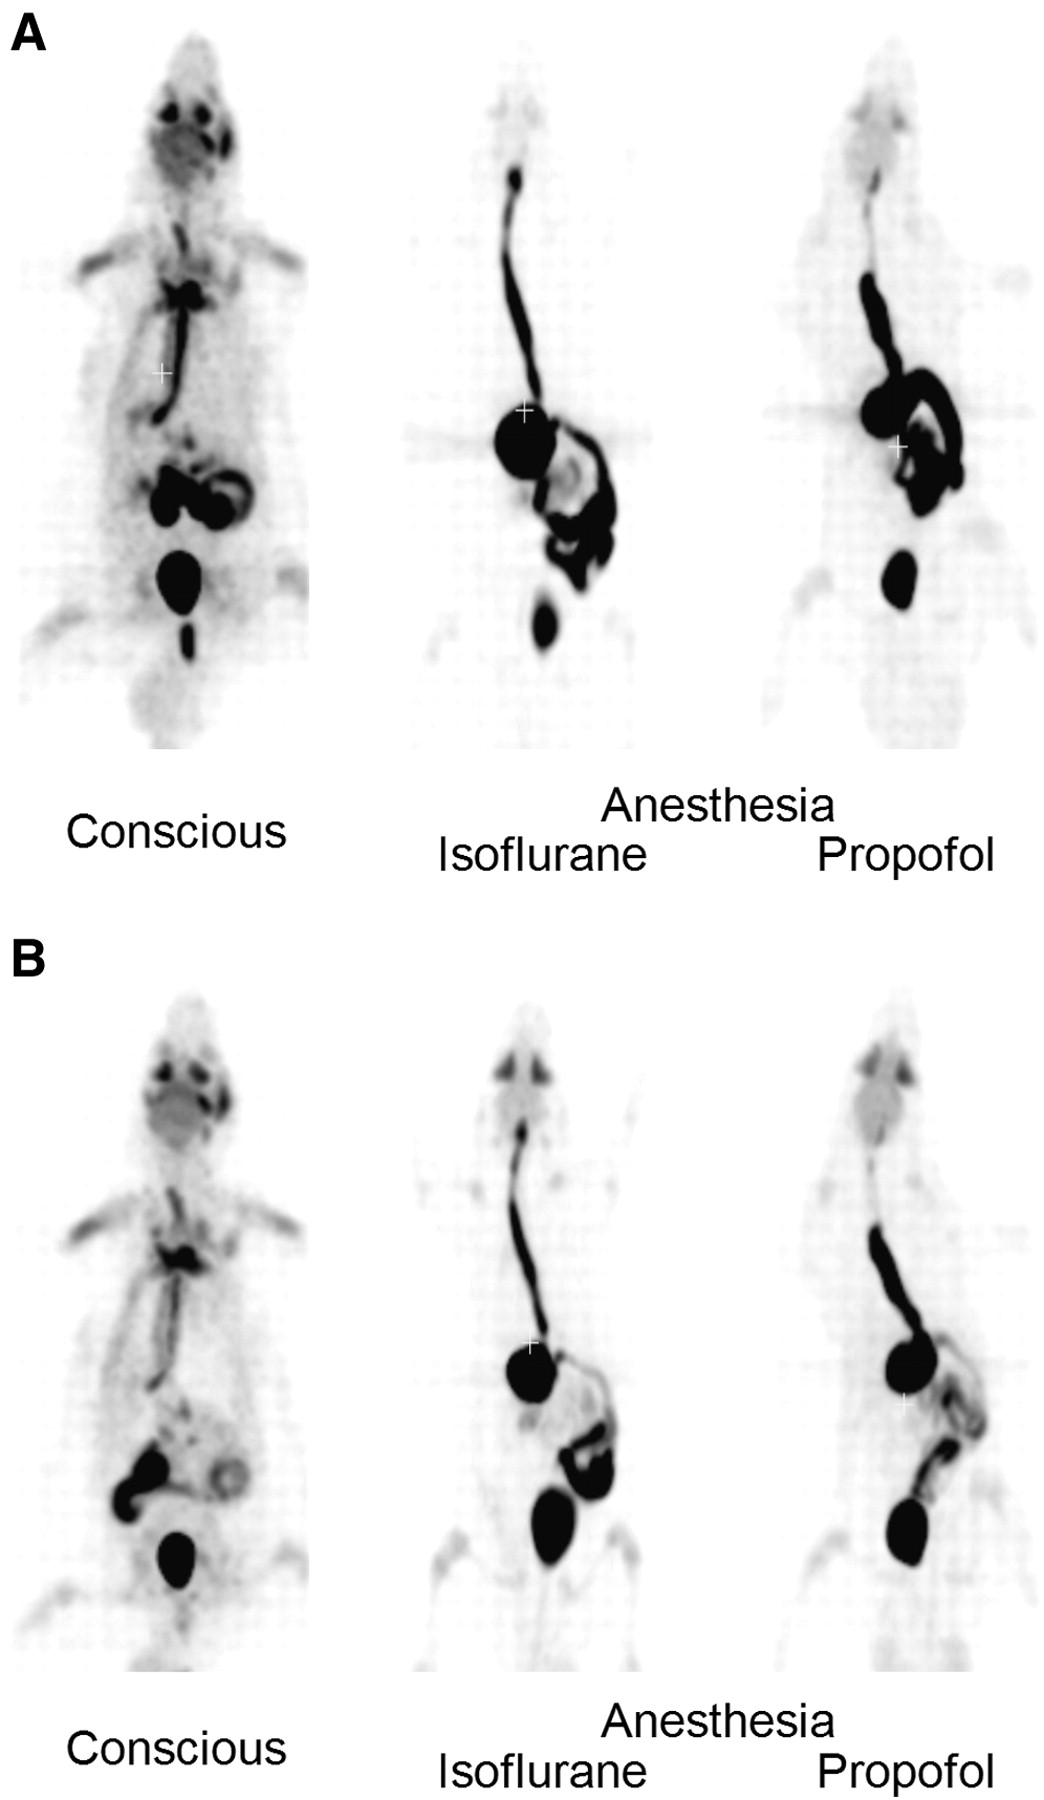
Figure 2 shows the distribution of radioactivity in the abdominal region at 0.1, 0.4, 0.6, 1, 2, 3, 4, 5, 7.5, 10, 20, 45, and 75 min after oral administration of 18F-FDG. In conscious rats, radioactivity was found in the entire gastrointestinal tract at 2 min after administration, and then that in the stomach region disappeared rapidly within 10 min. Also, radioactivity in the small intestine declined gradually, and at 10 and 20 min a misty outline of the liver was observed behind the stomach. At 45 min, most of the radioactivity in the abdominal region had disappeared and been excreted into the urinary bladder (for the rat shown in Fig. 2A, the urine was discharged at 20 min after administration). In contrast, in anesthetized rats, radioactivity was retained in the stomach during the PET scans and moved to the small intestine slowly (Figs. 2B and 2C). Transit of radioactivity in the small intestine was also slow in anesthetized rats, compared with that in conscious rats.

Coronal maximum-intensity-projection abdominal PET images obtained serially after oral administration of 18F-FDG to conscious rat (A) and rats anesthetized with isoflurane (B) or propofol (C).
Time Course of Radioactivity
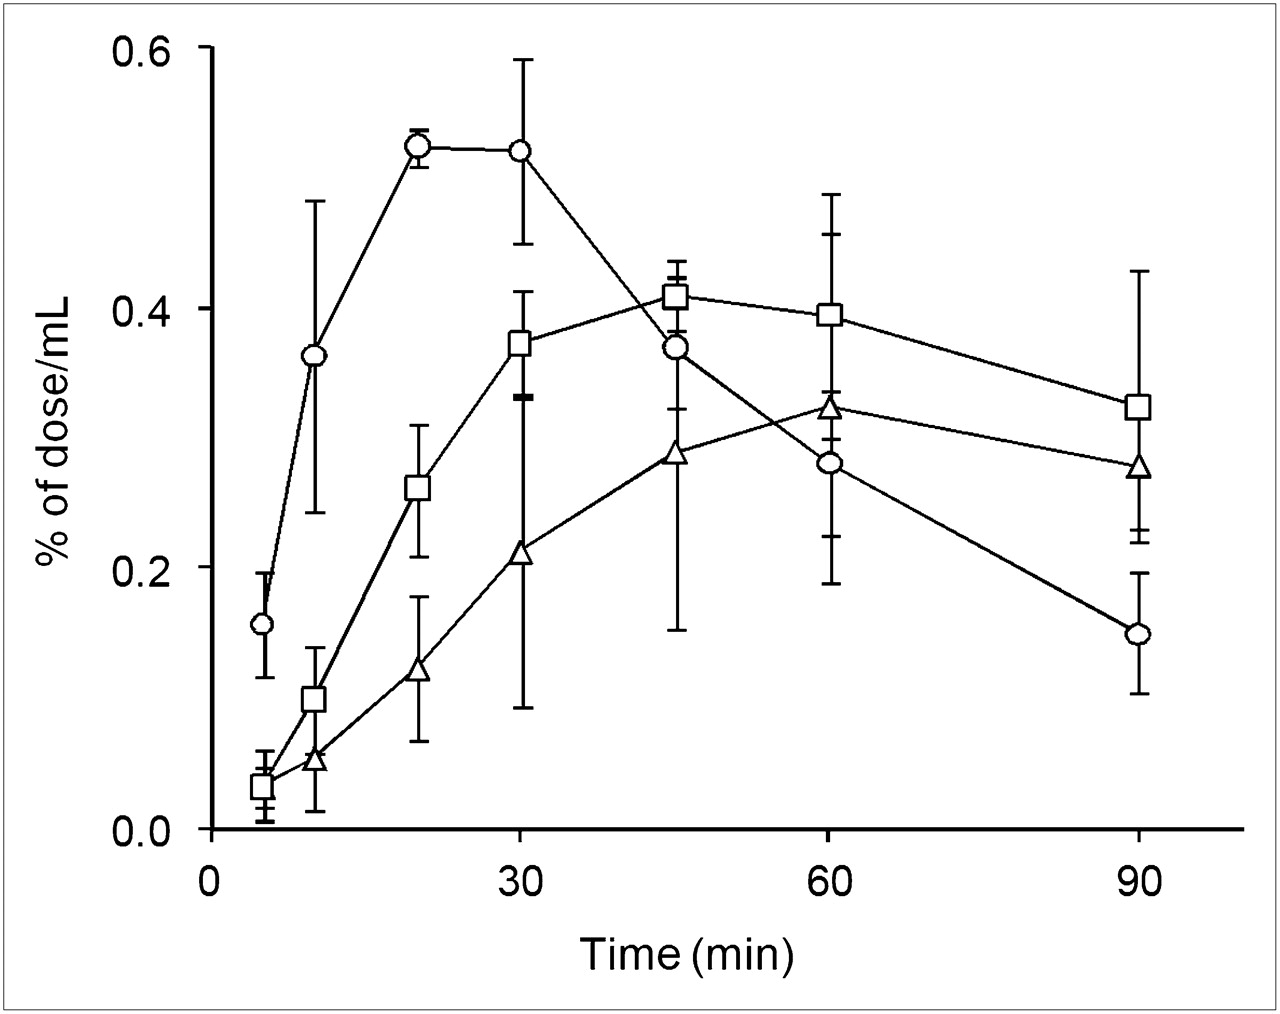
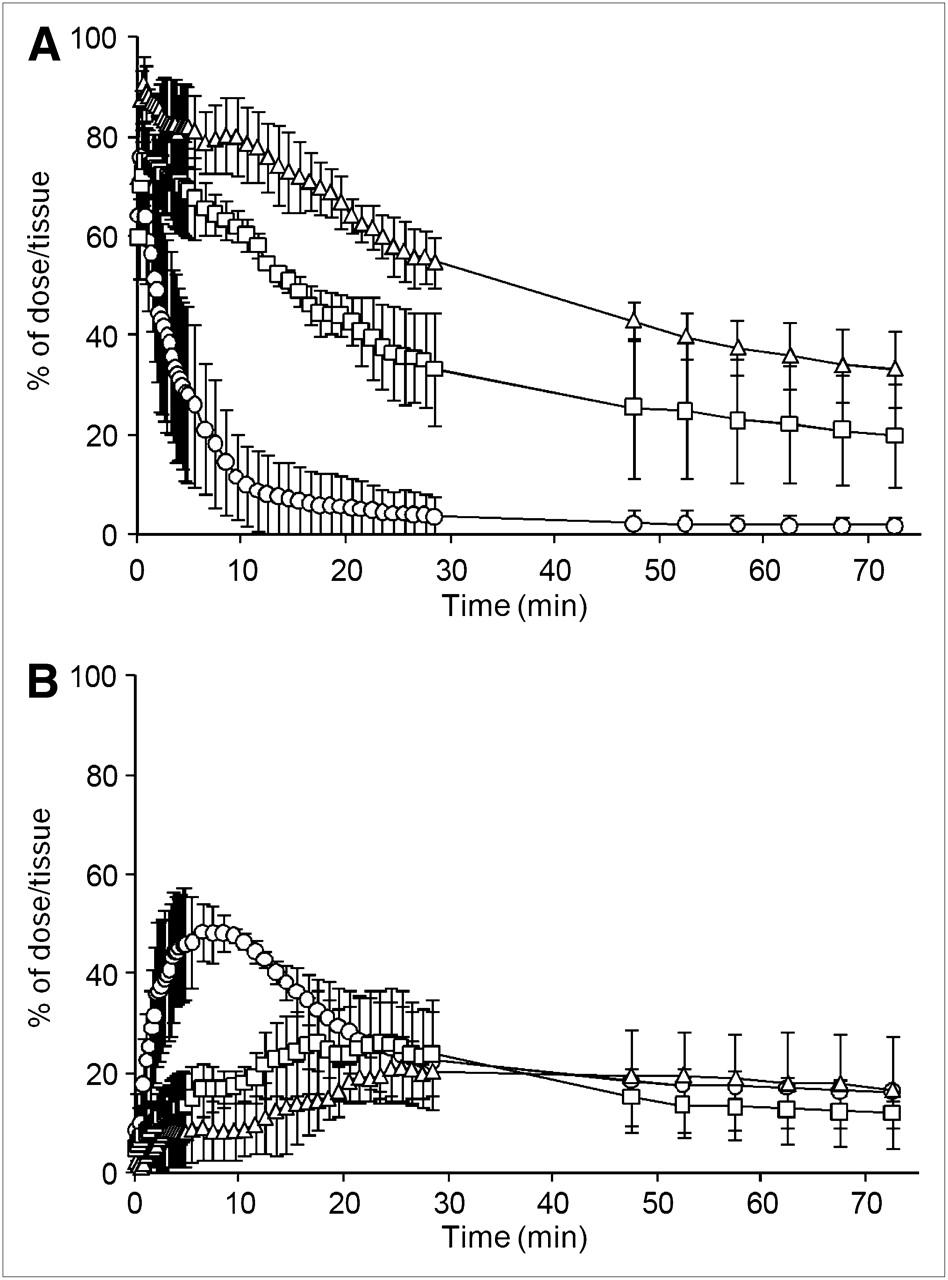
The radioactivity in the stomach and small intestine was calculated from defined VOIs. Figure 3A shows the time–radioactivity curves for 18F-FDG (% of dose/tissue) in the stomach after oral administration. At 15 min after oral administration, approximately 90% of administered radioactivity in the stomach had disappeared in conscious rats, whereas 70% and 50% remained in the stomach in isoflurane- and propofol-anesthetized rats, respectively. Time–radioactivity curves for the small intestine are shown in Figure 3B. In conscious rats, intestinal radioactivity clearly peaked at 7.0 ± 2.4 min (Tmax) after administration and then gradually declined until the end of the scan. In contrast, the time course of intestinal radioactivity was broad in anesthetized rats, and a clear peak was not observed (Tmax, 41.8 ± 14.4 min for isoflurane and 18.2 ± 6.4 min for propofol).

Time courses of radioactivity in stomach (A) and small intestine (B) after oral administration of 18F-FDG to conscious rats (○) and rats anesthetized with isoflurane (□) or propofol (▵). Data are mean ± SD of 3 experiments.
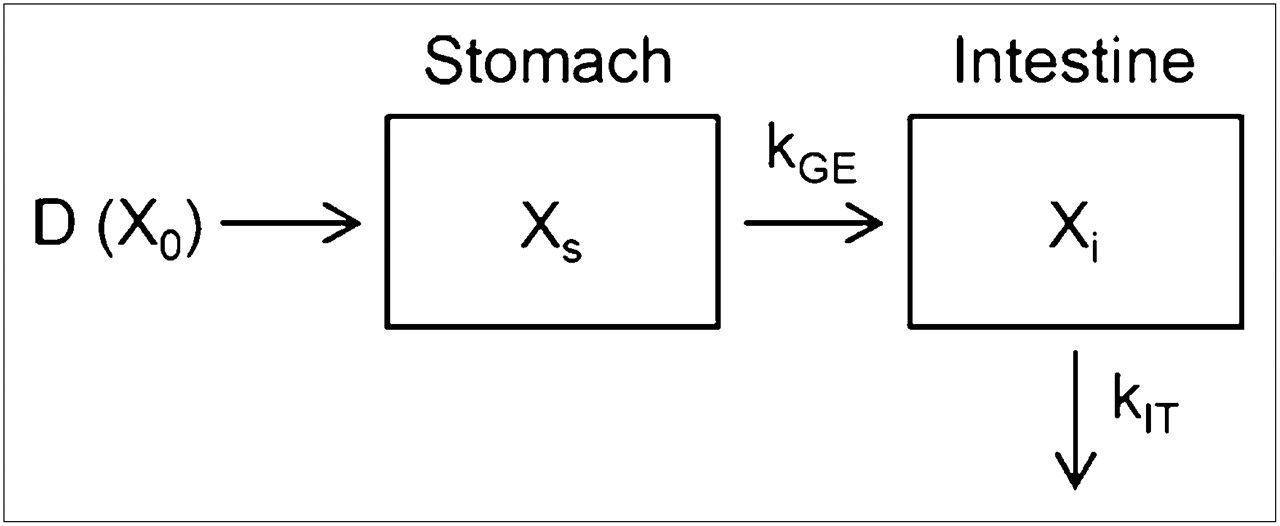
Assuming that gastric emptying follows the first-order rate kinetic and that disappearance from the intestinal tract corresponds to absorption into the blood circulation (also first-order), rate constants for gastric emptying (kGE) and absorption from the intestinal tract (kIT) were obtained by fitting the data in Figures 3A and 3B to the simple absorption kinetic model (Fig. 4). Table 1 shows kGE and kIT in conscious and anesthetized rats. In conscious rats, the half-life of gastric emptying (calculated from kGE) was only 3.7 ± 1.9 min, indicating fast emptying of solution from the stomach. In anesthetized rats, although the rate of stomach emptying was significantly less than that in conscious rats, no significant difference was noted in intestinal absorption rate.
Parameters of Gastric Emptying and Intestinal Absorption

Compartment model for gastric emptying and intestinal absorption. D (X0) represents dose of 18F-FDG. Xs and Xi represent amount of 18F-FDG in stomach and intestine, respectively, at time t.
Blood Concentration of Radioactivity
Figure 5 shows the time course of the blood concentration of radioactivity (% of dose/mL) after oral administration of 18F-FDG. Absorption of 18F-FDG was fast in conscious rats, and the blood concentration of radioactivity maximized (Cmax) at 23.3 ± 5.8 min (Tmax) after administration. Cmax was lowered and Tmax was prolonged by anesthesia, because of the delayed absorption from the gastrointestinal tract (Table 2). In Table 2, the effect of anesthesia was most evident on Tmax (50.0 ± 8.7 min for both anesthetic agents), whereas the decrease in the area under the curve was slight and was detected only in propofol-anesthetized rats.
Pharmacokinetic Parameters from Blood Profile after Oral Administration of 18F-FDG to Rats
Time courses of radioactivity in whole blood after oral administration of 18F-FDG to conscious rats (○) and rats anesthetized with isoflurane (▵) or propofol (□). Data are mean ± SD of 3 experiments.
We additionally performed a radiometabolite analysis of blood samples using thin-layer chromatography separation followed by detection with autoradiography. It was confirmed that most of the radioactivity (>99%) in the blood was derived from intact 18F-FDG (data not shown).
ka was calculated by deconvolution analysis of the blood concentration of radioactivity after oral and intravenous administration of 18F-FDG. In conscious rats, ka was smaller than the gastric emptying rate (kGE in Table 1) and was close to kIT. In contrast, ka in anesthetized rats corresponded well to kGE, suggesting that gastric emptying limited the absorption of 18F-FDG.
Intestinal Absorption of 2-FDG
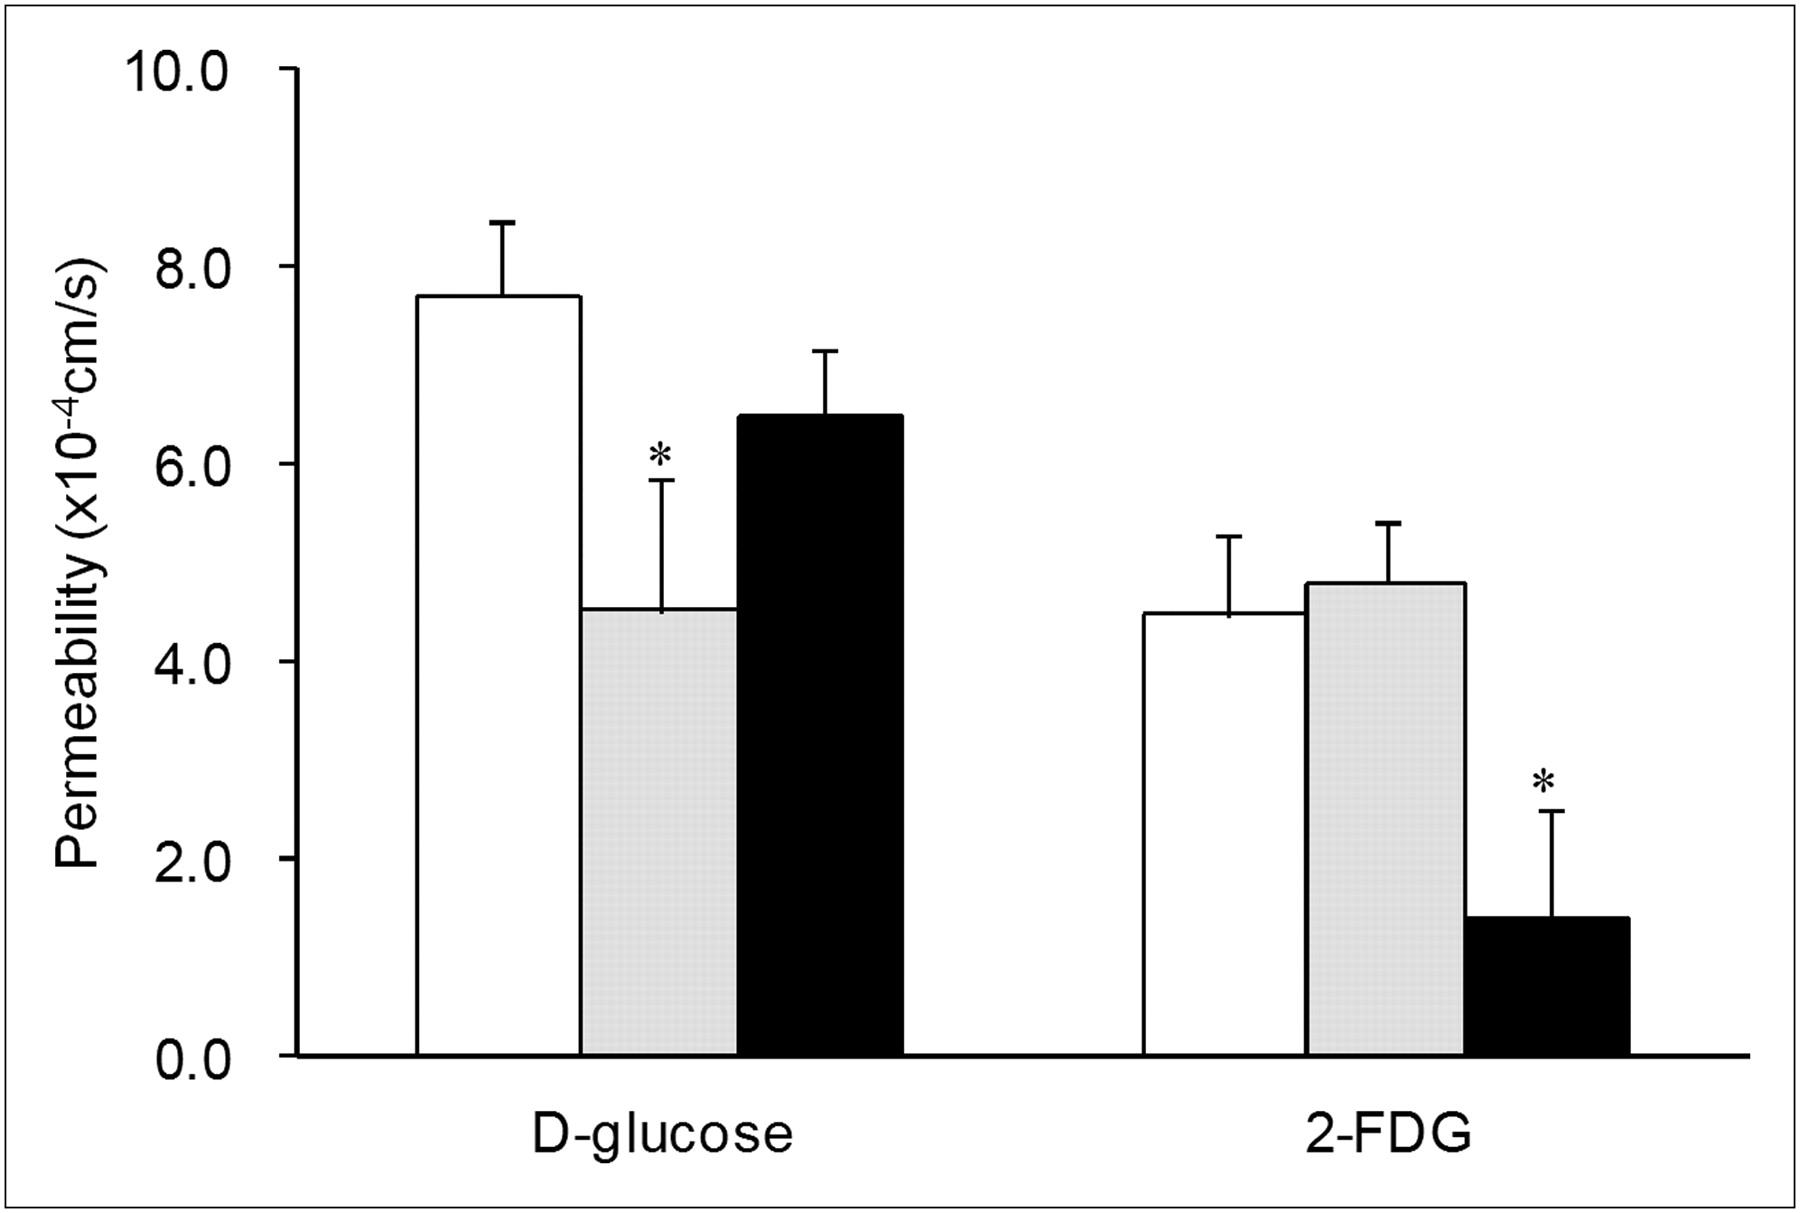
Mechanisms for the intestinal absorption of 2-FDG from rat proximal jejunum were investigated by an intestinal closed-loop method in situ. The permeability of 2-FDG through the intestinal membrane was calculated from its absorbed amount from the loop during the defined period by assuming a first-order rate absorption. As a reference, the permeability of d-glucose was also evaluated, using a stable isotope of glucose ([UL-13C6]-d-glucose) to neglect the effect of endogenous glucose. As shown in Figure 6, the permeability of 2-FDG through the proximal jejunum was calculated as 4.49 ± 0.83 × 10⁻⁴ cm/s and was significantly lower than that of d-glucose (7.71 ± 0.75 × 10⁻⁴ cm/s).

Intestinal permeability of d-glucose and 2-FDG in absence or presence of glucose transporter inhibitors. As inhibitor, phlorizin (1.0 mM, gray bar) or d-glucose (20 mM, black bar) was added in luminal solution with [UL-13C6]-d-glucose or 2-FDG (0.1 mM, white bar). Data are mean ± SD of 3 experiments. *P < 0.05 compared with respective inhibitor-free experiment by unpaired Student t test.
The role of transporters on the intestinal absorption of 2-FDG was investigated by estimating the effect of glucose transporters on the permeability of 2-FDG. Phlorizin was used to inhibit sodium-dependent glucose transporter (SGLT) (mainly SGLT1 in the intestine) (16). An excess of d-glucose was added to inhibit both sodium-dependent and sodium-independent glucose transporters (GLUTs). The permeability of d-glucose was significantly decreased by the presence of phlorizin in the luminal solution, although the effect of an excess of d-glucose was not significant. In contrast, phlorizin showed no effect on the permeability of 2-FDG, whereas permeability was markedly decreased by an excess of d-glucose.
DISCUSSION
There are high expectations that PET will contribute to drug discovery and development through investigation of the pharmacokinetics of new drug candidates. So far, the distribution of drugs into the brain has been visualized in vivo in human PET studies that quantitatively evaluated the roles of drug transporters (such as P-glycoprotein) in the blood–brain barrier (17,18).
The development of potent drugs for oral use requires information on their pharmacokinetic and pharmacodynamic properties after oral administration. Also, to verify the absorbability of drugs and create appropriate oral formulations, one needs to understand the process by which drugs are absorbed in the gastrointestinal tract. In this study, we successfully demonstrated that PET is highly capable of visualizing and kinetically analyzing the gastrointestinal absorption of drugs in vivo. Most PET studies have been performed by intravenous injection of radiolabeled probes in animals or humans; ours appears to be the first report in which PET technique was applied to the study of gastrointestinal drug absorption.
Dynamic scanning of the abdominal regions of conscious rats showed that orally administered 18F-FDG (as a solution) quickly passed through the stomach and moved into the small intestine. The half-life of gastric emptying was only 3–4 min. This was significantly faster than that in another report (∼10 min) (19). After emptying from the stomach, 18F-FDG immediately spread into the entire small intestine and then was gradually absorbed into the blood circulation. Generally, drugs are considered to move down the intestine sequentially from the duodenum to the ileum after they leave the stomach. In drug absorption models, then, the intestinal tract is divided into several compartments and drugs are assumed to move from the upper compartments to the lower ones, with the defined rate constant of drug transit. In rats, the intestinal transit time of dissolved drugs has been reported to be 2–3 h (20,21), and calculation of the rate constant of drug transit in each compartment is based on this value. Also, in each compartment, drug absorption is considered to occur in parallel with transit. Therefore, the rate and amount of drug absorption are calculated from both transit and absorption rate in each compartment. However, PET scanning of the abdominal region showed that, after gastric emptying, 18F-FDG was absorbed from all compartments of the small intestine concurrently. This result suggests the possibility of simulating drug absorption using a simple mixing-tank model for the small intestine. The adequacy of this simple process of drug absorption should be investigated in more detail through modeling of the absorption profiles of various drugs.
In addition, the gastrointestinal tract VOIs obtained from PET data are considered to be a parameter that may relate to the volume of fluid present—in which a significant amount of drug (18F-FDG) is dissolved. The adequacy of this parameter to evaluate the fluid volume in the gastrointestinal tract will be discussed in a future report after we confirm the relationship between VOIs and this fluid volume.
In conscious rats, the absorption rate constant obtained by kinetic analysis of blood concentration–time profiles of radioactivity (ka) was much smaller than kGE but not significantly different from kIT (Tables 1 and 2). This result indicates that the rate of absorption of 18F-FDG in the conscious rat was rate-limited by the process of intestinal membrane permeation but not by gastric emptying. The rate of absorption of d-glucose from the small intestine was found to be quite fast and rate-limited by gastric emptying because d-glucose absorption was mediated by various transporters in the intestinal membrane, such as SGLTs and GLUTs (22). Among these transporters, SGLT1 is considered to play a main role in d-glucose absorption. Intestinal loop experiments revealed that the absorption of 2-FDG is significantly slower than that of d-glucose and is not mediated by SGLT1. Previous studies, in which removal of the hydroxyl group at the 2-position of d-glucose reduced the affinity to SGLTs, supported this finding (23,24). Also, because 18F-FDG was rapidly excreted into urine, this molecule would not be a substrate for SGLT2, which mediates the reabsorption of d-glucose from the proximal tubule in the kidney. However, an excess of d-glucose significantly decreased the permeability of 2-FDG in rat jejunum (Fig. 6). This result indicates the possibility that 2-FDG absorption is mediated by some other glucose transporters, maybe the facilitative transporters, GLUTs. The contribution of GLUTs may facilitate the intestinal absorption of 2-FDG despite its very hydrophilic property.
When rats were anesthetized with isoflurane or propofol, kGE was dramatically slowed (Table 1), corresponding well to the report that anesthesia significantly suppressed gastrointestinal peristaltic movement (25). In contrast, the effects of anesthesia on kIT were rather small. As a result, the ka of 18F-FDG in anesthetized rats was comparable to kGE and significantly smaller than kIT, indicating that the rate-limiting step of gastrointestinal absorption of 18F-FDG was shifted to the gastric emptying process by anesthesia.
In preclinical animal studies, in vivo gastrointestinal absorption of drugs is usually assessed by pharmacokinetic analysis of the time course of drug concentration in the blood—an assessment that may give simple and overall parameters such as ka and bioavailability. However, if the in vivo process of gastrointestinal drug absorption is unclear, it will be difficult to understand why changes in the physiologic conditions of the gastrointestinal tract cause absorption to fluctuate. Furthermore, species differences in the physiology of the gastrointestinal tract might make it difficult to predict gastrointestinal absorption in humans from the results of preclinical animal studies. In our study on conscious and anesthetized rats, PET clearly showed what was changed by the anesthesia and how the gastrointestinal absorption of 18F-FDG was affected. PET technique, therefore, is useful for analyzing and understanding the process of gastrointestinal drug absorption.
CONCLUSION
We have demonstrated that PET is highly capable of investigating the process by which oral drugs are absorbed in vivo. A workshop in 2003 on microdose clinical studies to minimize animal testing recommended the use of molecular imaging techniques such as SPECT and PET to determine the tissue distribution of radiolabeled compounds in humans. The present study on rats provides the fundamental methodology, and indicates the feasibility, of using PET to investigate the gastrointestinal absorption of orally administered drugs in humans.
- © 2011 by Society of Nuclear Medicine
REFERENCES
- Received for publication July 20, 2010.
- Accepted for publication November 9, 2010.


