


Abstract
Both calcification and FDG uptake have been advocated as indicators of atheroma. Atheromas calcify as cells in the lesion undergo apoptosis and necrosis during evolution of the lesion and at the end stage of the lesion. FDG concentrates in lesions due to the relatively dense cellularity in regions of inflammation of active atheromas. This investigation examines the geographic relationship of focal vascular 18F-FDG uptake, as a marker of atherosclerotic inflammation, to arterial calcification detected by contemporaneous CT. Methods: We reviewed PET/CT images from 78 patients who were referred for tumor staging for the presence of vascular 18F-FDG uptake and vascular calcification. Arterial wall 18F-FDG accumulation greater than adjacent blood-pool activity was considered inflammation. Arterial attenuation of >130 Hounsfield units was considered calcification. Sites in the ascending and descending aorta, the carotid and iliac arteries, and the coronary territories were examined on the emission, CT, and fusion images on a point-by-point basis. When lesions were seen, we evaluated whether they were overlapping or discrete. Results: The 18F-FDG arterial distribution was consistent with established atherosclerotic topography, with increased uptake in the thoracic aorta, at the carotid bifurcation, and in the proximal coronary vessels. Arteries typically displayed a patchwork of normal vessel, focal inflammation, or calcification; inflammation and calcification overlapped in <2% of cases. Arterial inflammation preceded calcification, in terms of mean patient age. Coronary inflammation was more prevalent in patients with more cardiovascular risk factors. Conclusion: Vascular calcification and vascular metabolic activity rarely overlap, suggesting these findings represent different stages in the evolution of atheroma.
Atherosclerosis is an immune inflammatory disease (1) characterized by subendothelial lipid accumulation, monocyte/macrophage accrual (2), and vascular calcification (3). Using the glucose analog 18F-FDG, PET can image vascular inflammation (4–6), primarily due to increased macrophage metabolism (7–9). Rudd et al. identified increased 18F-FDG uptake in carotid plaques in a small group of patients before cartotid endarterectomy (10). Histopathology of the lesions demonstrated more macrophages in 18F-FDG–positive lesions, whereas calcium and fibrous tissue were more prevalent in the 18F-FDG–negative lesions. 18F-FDG accumulation in the arterial tree of cancer patients who were referred for PET occurs relatively frequently (11,12). Similarly, arterial calcification, another marker of atheroma (13,14), is often observed in the CT studies performed on these patients. This investigation compares the regional distribution of arterial 18F-FDG uptake and calcification on a point-by-point basis in the arterial tree of a series of patients who were referred for PET/CT in the course of tumor staging.
MATERIALS AND METHODS
Patients
PET/CT data of 78 consecutive patients (51 men, 27 women; median age, 67 y; age range, 10–86 y) who were referred for tumor staging were reviewed. The study protocol was approved by the Memorial Sloan-Kettering Cancer Center institutional review board. The patient’s age, medications, and blood sugar at the time of injection were recorded.
PET/CT and Image Reconstruction
PET/CT images were recorded with a Biograph (Siemens/CTI) or Discovery (GE Healthcare) system. Data were recorded from the level of the auditory meatus to the midthigh 72 ± 18 min (mean ± SD) after intravenous injection of 475 ± 59 MBq (mean ± SD) 18F-FDG. Activity was scaled to body surface area for pediatric patients (n = 3). After a scout view, noncontrast spiral CT was performed at 50 mA and 130 kVp (Siemens/CTI) or 80 mA and 140 kVp (GE Healthcare). Emission data were then obtained for 3 min per bed position with each instrument (3-dimensional on the Biograph and 2-dimensional on the Discovery).
Image Analysis
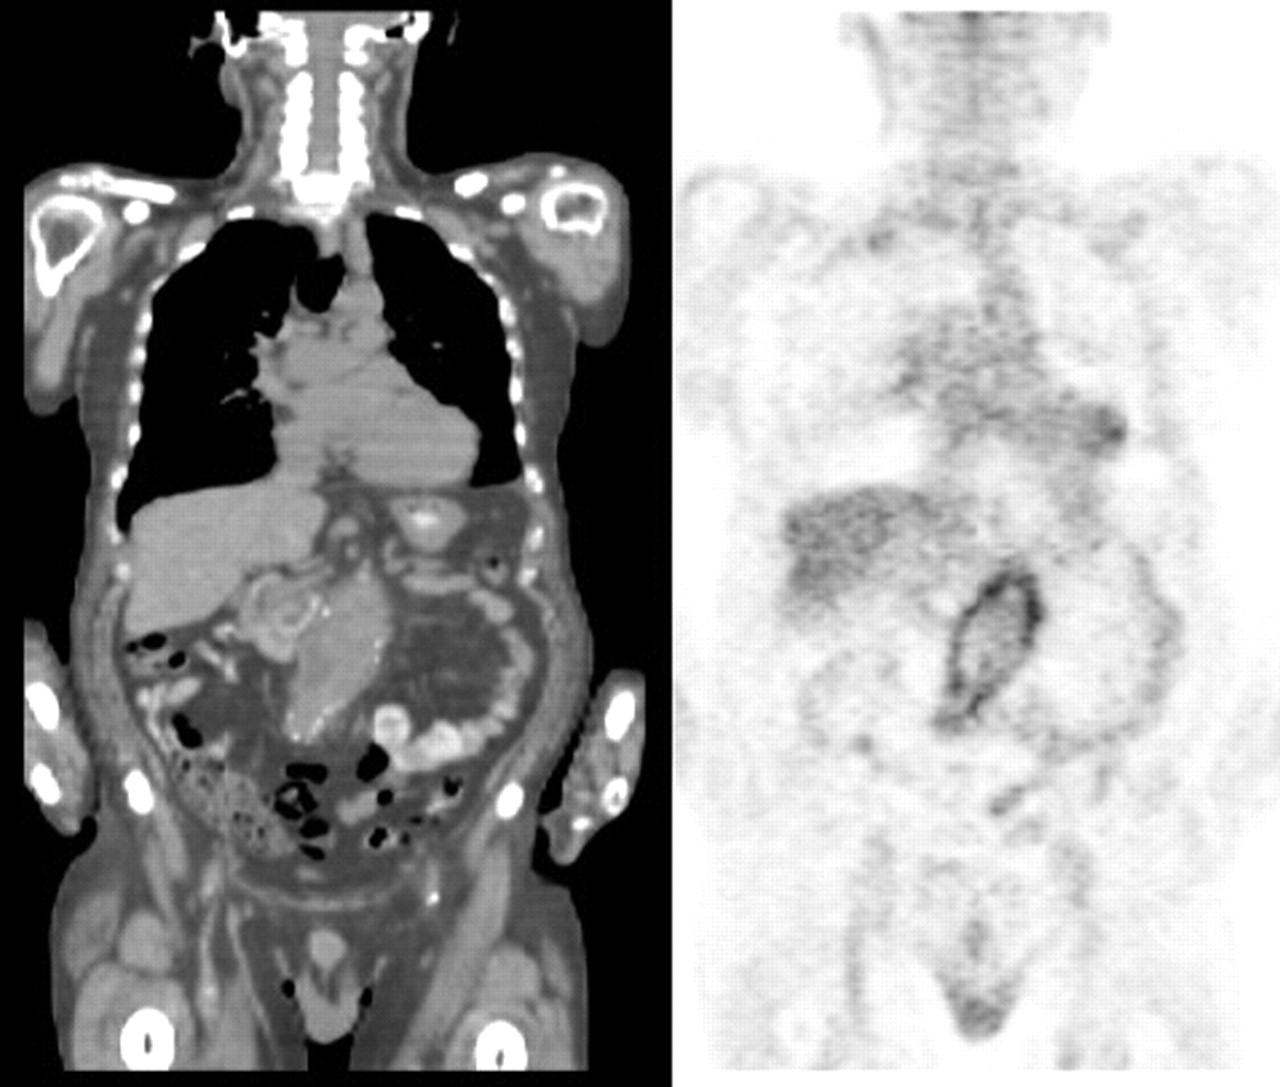
CT images were evaluated for calcification in the carotid, coronary, aortic, and iliac arteries (vascular attenuation of >130 Hounsfield units) (15). To detect overlap of 18F-FDG and calcification, the PET/CT fusion images were used. In addition, the fusion data were also used for anatomic localization of focal 18F-FDG uptake. Attenuation-corrected and uncorrected PET images were evaluated. Regions of interest (ROIs) were drawn at the bifurcation of the pulmonary artery; left atrium; and 3 aortic regions (level with the tracheal bifurcation, diaphragmatic crura, and proximal to the aortic bifurcation). Mean blood-pool activity was calculated. The lower threshold of the PET color scale was raised to exclude blood-pool activity (Fig. 1).

(Left) Coronal 18F-FDG PET image of upper body. (Center) Intensity adjustment based on blood-pool activity. (Right) CT fused with adjusted PET image shows inflammation in wall of ascending aorta (arrow).
18F-FDG activity that followed arterial contours on the fused CT image, in 3 orthogonal views, was considered as possible inflammation. For the coronary arteries, arterial wall activity was defined as 18F-FDG accumulation within the expected anatomic distribution of the coronary arteries in 3 orthogonal views, allowing for cardiac motion artifact (16). When intense myocardial uptake was present (defined as visualization of epi- or endocardial borders of any myocardial segment), coronary vessels were excluded from analysis. After analyzing PET/CT images, medical records were reviewed to determine cardiac risk factors and identify patients with subsequent cardiovascular events.
Myocardial Perfusion Imaging (MPI)
Thirty-two patients also had SPECT gated MPI within 1 mo of PET/CT. MPI was performed by a rest–stress protocol, injecting 370 and 925 MBq 99mTc-tetrofosmin (n = 10) or a combination (n = 22) of 148 MBq 201Tl chloride at rest and 925 MBq 99mTc-tetrofosmin at stress. Stress was induced by Bruce treadmill exercise (n = 12) or adenosine infusion (n = 20). Gated SPECT images were acquired as soon as possible after stress. Perfusion status (i.e., normal, ischemia, infarct) was taken from the original MPI reports.
Statistics
Site-specific blood-pool activities were compared using between-subjects ANOVA. The proportion of cases showing arterial 18F-FDG uptake in each territory was analyzed by confidence intervals (CIs) (modified Wald method) and ANOVA. Using odds ratios (ORs) with CIs, we compared territorial 18F-FDG uptake with calcification and coronary 18F-FDG uptake with (a) history of coronary artery disease (CAD), (b) cardiac risk factors (i.e., hypertension, diabetes, hypercholesterolemia, smoking history, and age >45 y for men and >55 y for women), and (c) MPI. Significance was assessed by the Fisher exact test. Similarly, we compared carotid 18F-FDG uptake and cardiac risk factors. Two-tailed P values of 0.05 were taken as significant, with correction for multiple comparisons.
RESULTS
A summary of the patients’ age and risk factors is presented in Table 1. All patients were euglycemic at the time of 18F-FDG injection. Malignancies were found in 73 patients: 3 breast, 9 endocrine, 28 gastrointestinal, 4 genitourinary, 11 hematologic, 2 musculoskeletal, and 16 respiratory cancers; 5 patients had no cancer. Three patients were treated with potent antiinflammatory agents at the time of 18F-FDG injection: one each with dexamethasone, tacrolimus, and prednisone. All had significant 18F-FDG uptake in their major vessels.
Study Population Characteristics
Blood-Pool Activity
Mean blood-pool activities in the 5 arterial ROIs were not significantly different (P = 0.5), with an average coefficient of variation of 13.5%, most likely due to differences in vessel size at each measured location.
Arterial 18F-FDG Uptake and Calcification
Vessels demonstrated a patchwork of 18F-FDG uptake, calcification, and normal vessel (neither 18F-FDG nor calcium). Arterial 18F-FDG uptake and calcification were common in all examined territories but rarely overlapped (<2% of vascular territories). Table 2 lists the results in the 82 studies performed on 78 patients (4 patients had prior PET scans that are included in the analysis). Calcification was associated with significantly greater odds of adjacent local vascular 18F-FDG uptake, particularly in the abdominal aorta (Table 3).
Prevalence of 18F-FDG Uptake or Calcification in Major Arteries
Odds of 18F-FDG Uptake Depending on Calcification in Major Arteries
18F-FDG accumulation was seen in the aortae of 61 patients (74%), 21 (45%) sets of coronary arteries, and 26 (31%) carotid and 28 (34%) iliac pairs (Fig. 2). Aortic 18F-FDG uptake was most commonly proximal (52%), followed by abdominal (48%), and descending thoracic (31%) segments. Calcification was more common than 18F-FDG uptake in all arterial regions, except the carotids (31% vs. 19% of patients, respectively) and proximal aorta (52% vs. 46%, respectively).

Plot illustrates distribution of 18F-FDG, in arterial tree, as percentage of cases; 95% confidence intervals are shown. PA = proximal aorta; AA = abdominal aorta; DTA = descending thoracic aorta; LMA = left main coronary artery; LCX = circumflex coronary artery; LAD = left anterior descending coronary artery; RCA = right coronary artery.
Patients with arterial 18F-FDG accumulation were younger, on average, than patients with arterial calcification, in most territories. No patient had a history of vasculitis.
Seven patients had abdominal aortic aneurysms (AAA). Three AAA were 18F-FDG avid (Fig. 3). 18F-FDG–positive aneurysms measured 3.0, 5.3, and 5.6 cm in greatest transaxial diameter on CT. The 4 AAA without 18F-FDG uptake were ≤3.4 cm. The patient with the largest AAA had chronic abdominal pain at the time of PET. Three patients had prior surgical repair: the patient with the largest AAA and 2 patients with 18F-FDG–negative aneurysms. Four patients had a follow-up PET/CT to reevaluate their cancer. The vascular calcification and 18F-FDG findings were essentially unchanged.

Coronal CT (left) and PET (right) images show intense mural inflammation in AAA.
Carotid arteries displayed 18F-FDG accumulation more often than arterial calcification (31% vs. 19%). 18F-FDG uptake was often unilateral (61%) and focal. Calcification was often bilateral (62%). No correlation was found between the presence of cardiovascular risk factors and either carotid 18F-FDG uptake (P = 1.0) or calcification (P = 0.1). Of 6 patients with prior carotid endarterectomies, 4 displayed ipsilateral increased carotid 18F-FDG uptake. Five of 6 surgeries were performed >12 mo before PET.
Two patients suffered cerebrovascular accidents, 2 and 39 d after PET/CT, respectively. PET/CT studies of both patients showed 18F-FDG accumulation in the carotid artery perfusing the territory of the cerebrovascular accident (Fig. 4).

(Left to right) PET and PET/CT images show foci of inflammation in right common carotid artery (arrows), from lateral (left) and right oblique (right) projections. Two days later, patient suffered a right-sided cerebrovascular accident.
Thirty-four patients with intense myocardial uptake were excluded from analysis of coronary activity. 18F-FDG was detected most often in the first centimeter-segments of the left main coronary artery (26%), left circumflex artery (LCX) (21%), left anterior descending artery (LAD) (15%), right coronary artery (RCA) (9%), and posterior descending artery (PDA) (4%), involving >1 coronary territory in 47% of cases (Fig. 5). Differences in prevalence were insignificant (P = 0.1). Hepatic 18F-FDG often obscured evaluation of the diaphragmatic aspect of the heart. Coronary calcification was identified in the LAD (42%), followed by LCX (32%), RCA (32%), left main coronary artery (LMA) (23%), and PDA (6%).

Fused PET/CT images show contiguous transaxial slices through heart. Inflammation (arrowheads) present proximal and distal to a calcified LAD (arrow). A tumor sits adjacent to esophagus.
Thirty-two patients had MPI studies available for correlation. The median interval between PET and MPI studies was 31 d. Sixteen MPI studies were reported as abnormal, including 8 that showed evidence of ischemia. Eight patients with abnormal MPI had myocardial 18F-FDG uptake and were excluded from analysis. The Fisher exact test found a significant correlation (P < 0.03) between abnormal MPI and coronary 18F-FDG uptake. Of the 5 cases with both abnormal MPI and coronary 18F-FDG uptake, the same (i.e., concordant) coronary territories were involved in 2 of the pairs of studies.
No cardiac events occurred during follow-up (average, 7 mo). The prevalence of coronary 18F-FDG increased as the number of cardiac risk factors increased (Table 4). Patients with a history of CAD (n = 19) had 4-fold greater odds of coronary 18F-FDG (OR, 4.1; 95% CI, 1.0, 16.2; P = 0.05). Four of 8 post–coronary artery bypass graft patients demonstrated coronary 18F-FDG.
Clinical Characteristics of Patients Displaying Coronary 18F-FDG Uptake (n = 22)
DISCUSSION
Atherosclerosis is an immune inflammatory disease (17) with various postulated triggers (1). Macrophage-secreted metalloproteinases contribute to the medial atrophy of AAA (18) and concentrate in the intimomedial junctions of coronary plaques during positive remodeling (19), with an associated vulnerability to rupture (20).
Calcium deposits in the vasculature, especially in the coronary arteries, are pathognomonic of atherosclerosis (21,22). Although calcification is often considered the end stage of atheroma, it may be found in earlier stages (3). Monocytes, intralesional macrophages, vesicles from apoptotic cells, and the death of vascular smooth muscle cells have been implicated in vascular calcification (23–25).
FDG Imaging
The ability of PET to visualize 18F-FDG uptake by atheroma has been validated by several histopathologic studies, including a recent experimental study by Ogawa et al. (6). 18F-FDG concentrates in inflammatory cells (7), allowing imaging of inflammation by PET (26). Immune cell activation is associated with increased oxidative metabolism, which is reflected by an increased rate of glucose use (27).
Several factors can alter 18F-FDG distribution. Principal among these is hyperglycemia. Blood sugars measured at the time of 18F-FDG injection revealed euglycemia in our patients. In addition, some forms of therapy, such as steroids, may reduce the level of uptake in the vasculature. Three patients in our series were on potent antiinflammatory drugs, one each on dexamethasone, prednisone, and tacrolimus. Each had significant vascular 18F-FDG uptake.
Arterial 18F-FDG accumulation was consistent with atherosclerotic topography (28,29). 18F-FDG uptake was most prevalent in the aorta, followed by the coronary and carotid arteries (P < 0.0001). In the aorta, 18F-FDG uptake was most prevalent in the proximal segment (P = 0.01), which is the earliest site for atherosclerosis (28). Tatsumi et al. (12) found 18F-FDG uptake in 59% of thoracic aortae, whereas we found uptake in 77%. Abdominal aortic 18F-FDG uptake was more diffuse and more prevalent (56%) than uptake in the descending thoracic aorta, where a posterior predilection was observed (28). Meller et al. (30) found no 18F-FDG uptake in the abdominal aorta. Yun et al. (11) found 18F-FDG uptake in 53% of abdominal aortae. The different findings may reflect the contribution of CT fusion in localizing arterial 18F-FDG accumulation.
Territorial calcification and 18F-FDG uptake were associated (Table 3), yet rarely overlapped, in our study. A recent study by Ben-Haim et al. (31) used PET/CT to determine the relationship between arterial 18F-FDG and calcification. On a lesion-by-lesion basis, they found both calcium and 18F-FDG present in 10% of lesions, which is a higher fraction of patients than we observed. However, our methodology corrected for residual circulating 18F-FDG, which may reduce the ability to identify lesions with low levels of 18F-FDG uptake. As observed in the Ben-Haim study, we found no difference in vascular 18F-FDG uptake, at calcified sites, on uncorrected images.
AAA
AAA are characterized by transmural inflammation, with lymphocyte and macrophage aggregation (32). Our data hinted at a possible correlation between AAA size and 18F-FDG uptake, but our sample size was small (n = 6). Sakalihasaan et al. (33) reported that AAA patients with negative PET (16/26) required no urgent aneurysmal surgery, whereas 6 patients with 18F-FDG–avid AAA required vascular surgery within a short period.
Coronary Arteries
Coronary 18F-FDG uptake was most often proximal (34) and multifocal, which agrees with autopsy studies that coronary inflammation occurs at multiple sites simultaneously (35). Patients with coronary 18F-FDG uptake were 4 times more likely to have documented CAD, but larger studies are needed to verify this finding.
The current 4- to 5-mm spatial resolution of PET contributes to the challenge of identifying coronary activity. Yet atherosclerotic inflammation can involve the intima, adventitia, and even underlying myocardium (36), theoretically increasing the signal region of 18F-FDG uptake. With sufficient 18F-FDG accumulation, size becomes less relevant in lesion detection.
The combination of limited PET spatial resolution and cardiac motion reduces the sensitivity of PET in the coronary arteries. Coronary motion is greatest in the RCA, followed in descending order by the circumflex artery, LAD, and LMA (37). Motion artifact, therefore, would be expected to reduce the sensitivity of PET for coronary 18F-FDG activity in that order. Our study found a lower incidence of 18F-FDG in the RCA compared with the LMA.
Subsequent studies might explore enhancing visualization of coronary 18F-FDG accumulation by a combination of gating to reduce motion and pharmacologic methods (38) to either increase 18F-FDG uptake in atherosclerotic coronary lesions or decrease background in normal myocardium (39).
Critique of Methodology and Limitations
By raising the lower threshold of the PET color scale, we probably suppressed some vascular 18F-FDG accumulation. Identification of vascular lesions may be enhanced, if, as suggested by Rudd et al. (10), the interval between injection and imaging was increased beyond the standard 1-h postinjection delay to improve target-to-background ratios. This is also suggested by in vitro studies, where macrophages accumulate 18F-FDG without a plateau for at least 3 h (27).
We could not evaluate coronary uptake in about half of our patients because of intense myocardial uptake. This high frequency of myocardial uptake is similar to the results of Ding et al. (40). Preliminary studies in animals suggest that native myocardial 18F-FDG uptake can be reduced by β-blockade (39). Coronary vessels move 7–23 mm during the cardiac cycle (16), and coronary 18F-FDG visualization likely would be improved by electrocardiographic gating.
CONCLUSION
This study suggests that vascular inflammation, as defined by 18F-FDG uptake, and vascular calcification identify different phases of atherosclerosis. Although both 18F-FDG uptake and calcification often occur in the same vessel, they rarely occur at the same site within the vessel. Combined anatomic and metabolic imaging with 18F-FDG PET/CT offers promise as a noninvasive method of indicating atheromas, because the combination of technologies appears to identify plaque at different phases of the lesion.
Footnotes
Received Feb. 9, 2005; revision accepted Apr. 5, 2005.
For correspondence or reprints contact: Mark P.S. Dunphy, DO, Nuclear Medicine Service, Department of Radiology, Memorial Sloan-Kettering Cancer Center, Room S-212, New York, New York, 10021.
E-mail: dunphym{at}mskcc.org
REFERENCES
In this issue


Jump to section
Related Articles
Cited By...
- 18F-Sodium Fluoride PET Imaging Passes an Important Milestone Toward Noninvasive Prediction of Clinical Events
- Clinical Molecular Imaging of Chemokine Receptor CXCR4 Expression in Atherosclerotic Plaque Using 68Ga-Pentixafor PET: Correlation with Cardiovascular Risk Factors and Calcified Plaque Burden
- Evaluation of 68Ga-Glutamate Carboxypeptidase II Ligand Positron Emission Tomography for Clinical Molecular Imaging of Atherosclerotic Plaque Neovascularization
- Imaging Atherosclerosis
- Calcification and Inflammation in Atherosclerosis: Which Is the Chicken, and Which Is the Egg?
- Positron emission tomography assessment of large vessel inflammation in patients with newly diagnosed, biopsy-proven giant cell arteritis: a prospective, case-control study
- Statin Therapy Resolves Coronary Artery Inflammation
- Histopathologic Characteristics of Atherosclerotic Coronary Disease and Implications of the Findings for the Invasive and Noninvasive Detection of Vulnerable Plaques
- Coronary Arterial 18F-FDG Uptake by Fusion of PET and Coronary CT Angiography at Sites of Percutaneous Stenting for Acute Myocardial Infarction and Stable Coronary Artery Disease
- Correlation Between Arterial FDG Uptake and Biomarkers in Peripheral Artery Disease
- Feasibility of 11C-Acetate PET/CT for Imaging of Fatty Acid Synthesis in the Atherosclerotic Vessel Wall
- Investigating Vulnerable Atheroma Using Combined 18F-FDG PET/CT Angiography of Carotid Plaque with Immunohistochemical Validation
- Hypoxia But Not Inflammation Augments Glucose Uptake in Human Macrophages: Implications for Imaging Atherosclerosis With 18Fluorine-Labeled 2-Deoxy-D-Glucose Positron Emission Tomography
- Correlation of Inflammation Assessed by 18F-FDG PET, Active Mineral Deposition Assessed by 18F-Fluoride PET, and Vascular Calcification in Atherosclerotic Plaque: A Dual-Tracer PET/CT Study
- In Vivo Imaging of Mineral Deposition in Carotid Plaque Using 18F-Sodium Fluoride PET/CT: Correlation with Atherogenic Risk Factors
- Imaging Atherosclerotic Plaque Inflammation by Fluorodeoxyglucose With Positron Emission Tomography: Ready for Prime Time?
- Feasibility of 18F-Sodium Fluoride PET/CT for Imaging of Atherosclerotic Plaque
- Imaging Atherosclerosis and Vulnerable Plaque
- Uptake of 18F-FDG in Acute Aortic Dissection: A Determinant of Unfavorable Outcome
- Molecular Imaging of Coronary Inflammation: Overcoming Hurdles One at a Time...
- Feasibility of FDG Imaging of the Coronary Arteries: Comparison Between Acute Coronary Syndrome and Stable Angina
- Multimodality Imaging of Carotid Artery Plaques: 18F-Fluoro-2-Deoxyglucose Positron Emission Tomography, Computed Tomography, and Magnetic Resonance Imaging
- 18F-FDG PET/CT Identifies Patients at Risk for Future Vascular Events in an Otherwise Asymptomatic Cohort with Neoplastic Disease
- Inflammation Imaging in Atherosclerosis
- Quantification of Inflammation Within Rabbit Atherosclerotic Plaques Using the Macrophage-Specific CT Contrast Agent N1177: A Comparison with 18F-FDG PET/CT and Histology
- One Step Closer to Imaging Vulnerable Plaque in the Coronary Arteries
- Relationships Among Regional Arterial Inflammation, Calcification, Risk Factors, and Biomarkers: A Prospective Fluorodeoxyglucose Positron-Emission Tomography/Computed Tomography Imaging Study
- Prolonged High-Fat Feeding Enhances Aortic 18F-FDG and 99mTc-Annexin A5 Uptake in Apolipoprotein E-Deficient and Wild-Type C57BL/6J Mice
- Reversal of Vascular 18F-FDG Uptake with Plasma High-Density Lipoprotein Elevation by Atherogenic Risk Reduction
- Assessment of Large-Vessel Involvement in Giant Cell Arteritis with 18F-FDG PET: Introducing an ROC-Analysis-Based Cutoff Ratio
- Atherosclerosis Inflammation Imaging with 18F-FDG PET: Carotid, Iliac, and Femoral Uptake Reproducibility, Quantification Methods, and Recommendations
- Noninvasive Detection and Localization of Vulnerable Plaque and Arterial Thrombosis With Computed Tomography Angiography/Positron Emission Tomography
- Radionuclide Techniques for Identifying Vulnerable Plaque
- Radiolabeled Monocyte Chemotactic Protein 1 for the Detection of Inflammation in Experimental Atherosclerosis
- 18Fluorodeoxyglucose Positron Emission Tomography Imaging of Atherosclerotic Plaque Inflammation Is Highly Reproducible: Implications for Atherosclerosis Therapy Trials
- Characterization of Plaques Using 18F-FDG PET/CT in Patients with Carotid Atherosclerosis and Correlation with Matrix Metalloproteinase-1
- Radionuclide Imaging for the Detection of Inflammation in Vulnerable Plaques
- Intravascular Radiation Detectors for the Detection of Vulnerable Atheroma