


Abstract
Formation and progression of atherosclerotic plaque is a dynamic and complex process involving various pathophysiologic steps including inflammation and calcification. The purpose of this study was to compare macrophage activity as determined by 18F-FDG PET and ongoing mineral deposition as measured by 18F-sodium fluoride PET in atherosclerotic plaque and to correlate these findings with calcified plaque burden as assessed by CT. Methods: Forty-five patients were examined by whole-body 18F-FDG PET, 18F-sodium fluoride PET, and CT. Tracer uptake in various arterial segments was analyzed both qualitatively and semiquantitatively by measuring the blood-pool–corrected standardized uptake value (target-to-background ratio [TBR]). The pattern of tracer uptake in atherosclerotic lesions was compared after color-coded multistudy image fusion of PET and CT studies. The Fisher exact test and the Spearman correlation coefficient rs were used for statistical analysis of image-based results and cardiovascular risk factors. Intra- and interrater reproducibility were evaluated using the Cohen κ. Results: 18F-sodium fluoride uptake was observed at 105 sites in 27 (60%) of the 45 study patients, and mean TBR was 2.3 ± 0.7. 18F-FDG uptake was seen at 124 sites in 34 (75.6%) patients, and mean TBR was 1.5 ± 0.3. Calcified atherosclerotic lesions were observed at 503 sites in 34 (75.6%) patients. Eighty-one (77.1%) of the 105 lesions with marked 18F-sodium fluoride uptake and only 18 (14.5%) of the 124 lesions with 18F-FDG accumulation were colocalized with arterial calcification. Coincident uptake of both 18F-sodium fluoride and 18F-FDG was observed in only 14 (6.5%) of the 215 arterial lesions with radiotracer accumulation. Conclusion: PET/CT with 18F-FDG and 18F-sodium fluoride may allow evaluation of distinct pathophysiologic processes in atherosclerotic lesions and might provide information on the complex interactions involved in formation and progression of atherosclerotic plaque.
Atherosclerosis is a progressive inflammatory disorder characterized by the formation of atherosclerotic plaque, which may rupture and lead to atherothrombotic complications such as myocardial infarction and stroke (1–3). The biologic composition and inflammatory state of an atherosclerotic plaque are the major determinants of acute cardiovascular events, rather than the degree of luminal narrowing or the size of the plaque (4,5). Therefore, further functional and biologic characterization of atherosclerotic lesions is critically needed to identify vulnerable plaque, which is particularly prone to rupture.
Various pathophysiologic processes are involved in the formation and progression of atherosclerotic plaque, including inflammation, apoptosis, and mineralization (2,6), and each of them represents a possible target for imaging. Constituents of atherosclerotic lesions encompass an admixture of fatty deposits, macrophages, mineral deposits, and connective tissue. Atheroma containing a large lipid core, a preponderance of inflammatory cells, a thin fibrous cap, or intralesional hemorrhage are particularly prone to rupture (3,7). The complex interactions between these different components during the evolution of atherosclerotic plaque are increasingly understood, underlining that a 1-dimensional imaging approach is of limited usefulness in understanding the dynamic interdependencies of pathophysiologic mechanisms in atherosclerotic lesions (2,3,6).
Molecular imaging technologies such as PET/CT have been applied to further characterize pathophysiologic processes in atherosclerotic plaque. Whole-body 18F-FDG PET/CT has become an established and well-studied method to image and quantify inflammatory processes in atherosclerotic lesions in large arteries (8–12). Other PET tracers for the visualization of macrophage activity in vascular walls have been evaluated in recent years, including 18F-fluorocholine, 11C-choline, and 68Ga-DOTATATE (13–16). The feasibility of 18F-fluoride PET for imaging of active mineral deposition in atherosclerotic plaque has recently been demonstrated by our group (17). Providing molecular information about the activity of the calcification process, 18F-fluoride depicts pathophysiologic aspects of atherosclerotic plaque different from the aforementioned tracers.
Although the use of combined PET/CT to image the relative distribution of 18F-FDG and 18F-fluoride after both simultaneous and separate administration of these tracers has been reported for the evaluation of malignancy (18–20), there are no data concerning a combined approach using these tracers for the functional characterization of atherosclerotic plaque.
Therefore, the purpose of the present study was to analyze detailed spatial and functional information of vascular macrophage activity as determined by 18F-FDG PET relative to active mineral deposition in 18F-fluoride PET and to arterial calcification as assessed by CT in atherosclerotic lesions. To this end, we retrospectively reanalyzed various arterial segments in separate 18F-FDG and 18F-fluoride PET/CT scans that had been obtained for the investigation of malignant tumors.
MATERIALS AND METHODS
Study Population
The study group consisted of 45 oncologic patients (24 women, 21 men; mean age ± SD, 57.7 ± 13.7 y; age range, 21.6–80.6 y) who had been referred to our institution for various clinical indications between December 2008 and August 2010. Patients were selected using the following criteria. Inclusion criteria included image data digitally available for retrospective analysis, clinical assessment of cardiovascular risk factors available, and a time interval between 18F-FDG PET/CT and 18F-sodium fluoride PET/CT less than 6 mo. Exclusion criteria included inability or unwillingness to provide informed consent for the retrospective analysis of the data, history of vasculitis or systemic inflammatory disease, beginning or stopping statin medication within the time interval between the PET/CT scans, and chemotherapy in the preceding 3 wk.
Age, body mass index, sex, and common cardiovascular risk factors including hypertension, hypercholesterolemia, diabetes, smoking habits, and prior vascular events defined as myocardial infarction or cerebrovascular insult were documented for each patient. Treatment with statins was recorded, because statins may affect plaque physiology (21). Risk factors were considered categoric variables. Patients were considered at risk if they were 55 y or older for women or 45 y or older for men, in accordance with a cutoff for age from the Framingham heart study (22). The study protocol had been approved by the local Clinical Institutional Review Board and complied with the Declaration of Helsinki. All subjects had given written informed consent for the retrospective evaluation of their data.
PET/CT Protocols and Image Reconstruction
PET/CT images were obtained in 3-dimensional acquisition mode using a Gemini GXL10 scanner (Philips) consisting of a gadolinium orthosilicate full-ring PET component and a 10-slice high-resolution helical CT component. The prescribed radiotracer doses were 350 ± 50 MBq of 18F-sodium fluoride and 350 ± 50 MBq of 18F-FDG. During the uptake period of about 60 min, the patients were hydrated orally with water. Imaging started with a nonenhanced, low-dose CT scan (120 kV, 80 mA, 5-mm slice thickness, no gap, 0.9 pitch, 0.74-s rotation time, 512 × 512 matrix). Next, PET was performed with 90 s per bed position at the head, thorax, and abdomen and 60 s at the legs. Overlap between consecutive bed positions was 50%. PET data were reconstructed into a 144 × 144 matrix using the iterative 3-dimensional line of response reconstruction algorithm of the system software with standard parameter settings. The low-dose CT scan extrapolated to 511 keV was used for PET attenuation correction. Voxel size was 4 × 4 × 4 mm, and the spatial resolution in the reconstructed PET images was about 8 mm in full width at half maximum. Images were reformatted into axial, coronal, and sagittal views and reviewed by the software provided by the manufacturer (Extended Brilliance Workstation; Philips).
Image Analysis
The 18F-fluoride PET/CT and 18F-FDG PET/CT scans were interpreted by 2 independent nuclear medicine readers masked to the subject's clinical information and the results of the other imaging study both on the basis of lesions and on the basis of arterial segments. In addition to the separate interpretation of the 2 PET scans, 18F-fluoride and 18F-FDG PET/CT scans were evaluated by the same readers in consensus for the presence and distribution of tracer uptake and calcification in individual vessel wall alterations by both side-by-side reading and after color-coded multistudy coregistration of datasets.
For the segment-based analysis, the major arteries were subdivided as follows: right and left common carotid arteries, ascending thoracic aorta, aortic arch, descending thoracic aorta, and abdominal aorta.
Radiotracer Uptake.
PET images were visually evaluated for the presence of focal radiotracer uptake in arterial walls. The localization of these areas in relation to the vascular wall and to calcifications was determined in PET/CT fusion images. Semiquantitative analysis was performed by obtaining the maximum standardized uptake (SUVmax) by manually placing an individual region of interest (ROI) around the lesion on coregistered transaxial PET/CT images. Blood-pool SUV (SUVblood pool) was the mean from 3 ROIs of fixed size placed in the mid lumen of the vena cava superior and the vena cava inferior. The SUVmax of each arterial lesion was divided by the SUVblood pool, yielding an arterial target-to-background ratio (TBR), which is reported subsequently
Calcified Plaque (CP).
CT images of both PET/CT studies were visually evaluated for the presence of CPs in the wall of the studied arteries, defined as high-density mural areas (attenuation > 130 Hounsfield units). The CT images of the 18F-FDG PET/CT portion were used as reference for the statistical analysis. Patients were divided into those with CP and those without discernible CP. Each CP was classified on a scale for grading circumferential extent: 0, absent; 1, less than 25% of arterial wall circumference; 2, 25%–50% of arterial wall circumference; 3, 50%–75% of arterial wall circumference; and 4, greater than 75% of arterial wall circumference. The calcified lesion thickness was the maximum calcification diameter measured in the intimoadventitial direction.
Coregistration of PET Studies
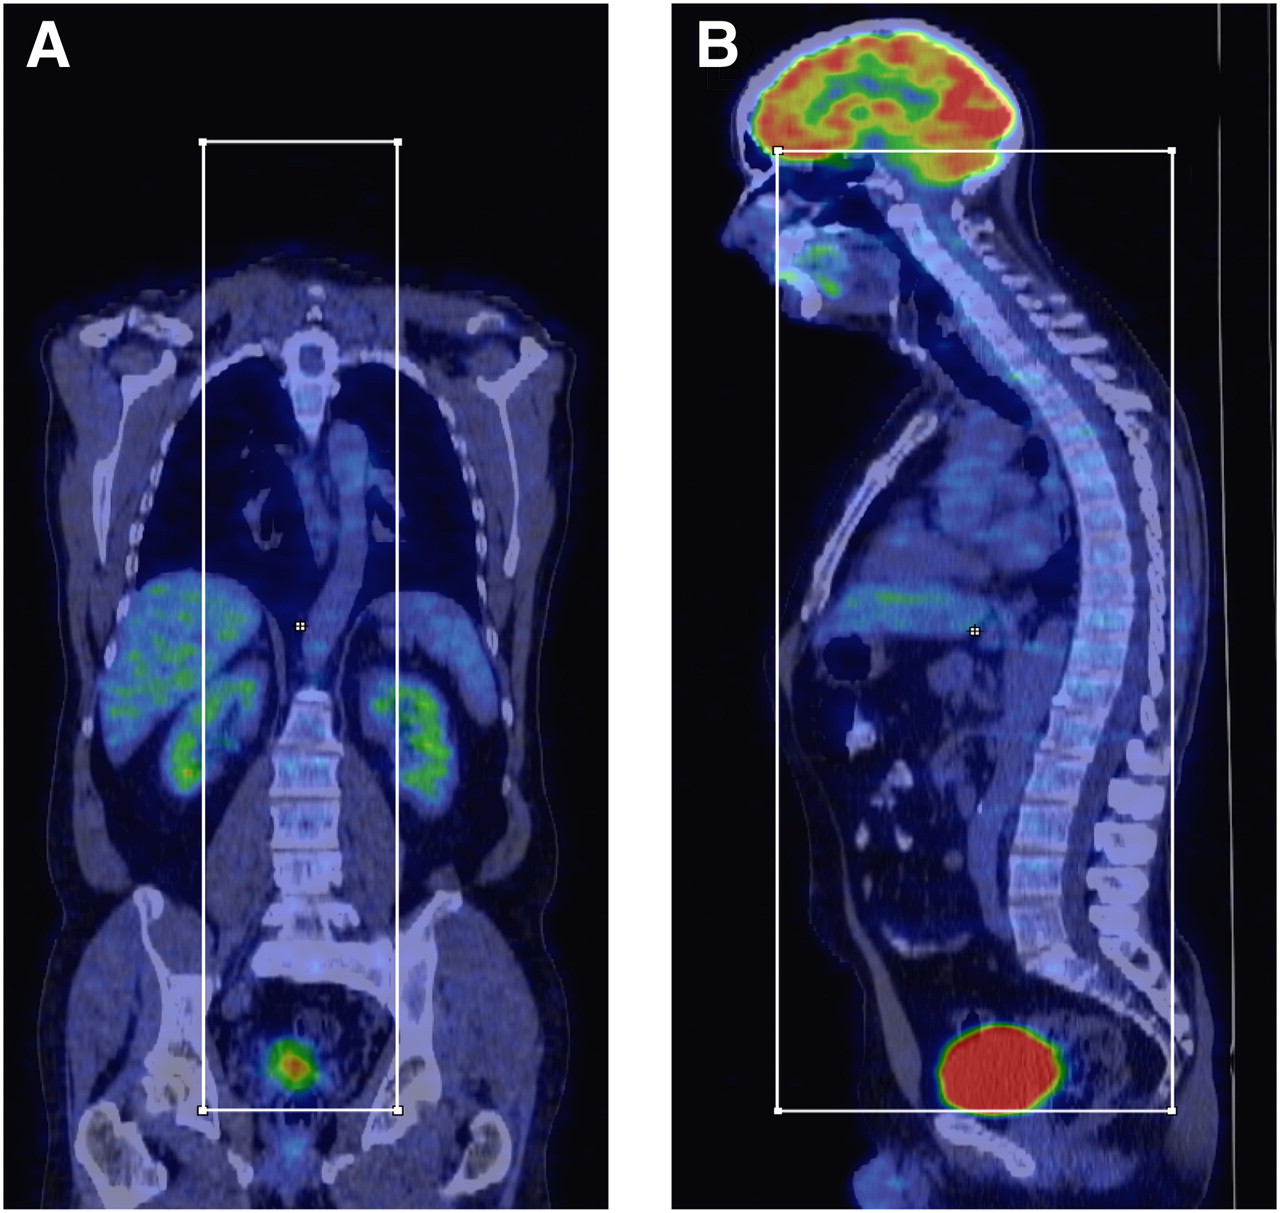
To assess if multistudy image fusion might facilitate evaluation of multitracer vascular PET/CT studies, coregistration and triple fusion of 18F-FDG PET/CT and 18F-fluoride PET/CT examinations were undertaken on a workstation with a commercial software package (InterView Fusion; Mediso Medical Imaging Systems). Before the registration of PET and CT, a volume of interest including the thoracic and abdominal aorta was segmented from the whole-body PET and CT datasets. The corresponding bounding box was defined as follows: superior border, base of the skull; inferior border, coccygeal bone; ventral border, sternum; dorsal border, spinous process of vertebra L5; and lateral borders, sacroiliac joints (Fig. 1). After completion of the segmentation of the datasets, affine registration was performed using the 18F-FDG PET and the corresponding CT series as reference. First, the 18F-fluoride PET/CT was resliced with a sampling rate of 2 mm. Then, fully automated normalized mutual information–based affine registration was performed with Amoeba (Downhill-Simplex Algorithm) optimization methods (23,24). The maximum number of iterations was 500, and the functional tolerance 0.0001 entropy gradient. The registered images were exported in standard DICOM format, fused, and displayed in axial planes.

PET/CT image processing. Example of definition of bounding box used for segmentation of CT data: coronal 18F-FDG PET/CT image (A) and corresponding sagittal PET/CT image (B).
Validation.
The accuracy of the PET/CT coregistration process was evaluated by comparing the alignment of anatomic landmarks as predicted by the algorithm against visual localization of landmarks by 2 clinical experts as a reference. If feasible, 5 calcified arterial lesions were used as anatomic landmarks. The exact localization of lesions with tracer uptake was confirmed by side-by-side reading of the original PET/CT data in all cases.
Statistical Analysis
Continuous variables are expressed as mean ± SD. Categoric variables are presented with absolute and relative frequencies. For between-group comparisons of continuous data, P values were calculated from unpaired t tests for parametric data and from Mann–Whitney U rank sum tests for nonparametric data. For categoric variables, P values were computed from contingency tables using a Fisher exact test. The Spearman correlation coefficient rs was used to correlate imaging findings. Statistical significance was established for P values of less than 0.05. Statistical analysis was performed using GraphPad Prism (version 5.0 for Windows [Microsoft]; GraphPad Software).
Reproducibility.
To test intra- and interrater reproducibility, calcification and radiotracer uptake were assessed 4 wk after the initial review by the same reader and by a second reader. The Cohen κ with 95% confidence interval (CI) was calculated to measure both intra- and interrater reproducibility.
RESULTS
Patient Population
The mean age (±SD) of 45 studied patients was 57.7 ± 13.7 y (age range, 21.6−80.6 y). The mean time interval between the different PET/CT scans was 1.2 ± 1.2 mo (range, 0.1–4.8 mo). Twenty-four patients had lung cancer, 8 melanoma, 6 breast cancer, 3 lymphoma, 2 colorectal cancer, and 2 sarcoma. 18F-FDG and 18F-fluoride uptake measurements and the assessment of CP burden were feasible in all patients. Relevant clinical characteristics of the patients included are reported in Table 1.
Patient Characteristics and Risk Factors of Study Population (n = 45)
Arterial Wall Radiotracer Uptake and CP Burden
18F-sodium fluoride uptake was observed at 105 sites in 27 (60%) of the 45 study patients. The prevalence was highest in the abdominal aorta, followed by the aortic arch. Mean SUVmax was 1.9 ± 0.7, and values ranged from 0.8 to 4.0. Mean TBR was 2.3 ± 0.7, and values ranged from 1.2 to 5.0 (Table 2).
Prevalence, Distribution, and Intensity (TBR) of 18F-Sodium Fluoride Uptake
18F-FDG uptake was seen at 124 sites in 34 (75.6%) of the study patients. Mean SUVmax was 1.9 ± 0.4, and values ranged from 1.1 to 3.5. The prevalence of 18F-FDG accumulation was also highest in the abdominal aorta, followed by the ascending aorta. Mean TBR for vascular 18F-FDG accumulation was 1.5 ± 0.3, and values ranged from 0.9 to 2.6 (Table 3).
Calcified atherosclerotic lesions were observed at 503 sites in 34 (75.6%) of the 45 study patients. The prevalence of arterial calcification was highest in the abdominal aorta, followed by the descending aorta and the aortic arch. The mean thickness of calcified lesions was 3.0 ± 1.2 mm, and the mean calcification score of these lesions was 1.6 ± 1.0 (Table 4). Neither calcification score (P = 0.94) nor lesion thickness (P = 0.80) of vascular calcifications differed significantly between the 2 studies.
Prevalence, Distribution, and Intensity (TBR) of 18F-FDG Uptake
Prevalence, Distribution, and Extent of Calcification in Studied Arterial Walls
Relationship Between 18F-Sodium Fluoride Uptake, 18F-FDG Uptake, CP Burden, and Risk Factors
On a per-lesion basis, 81 (77.1%) of the 105 lesions with marked 18F-sodium fluoride uptake were colocalized with arterial calcification, whereas only 18 (14.5%) of the 124 lesions with 18F-FDG accumulation showed concordant calcification in at least some part of the vessel wall alteration. The presence of 18F-sodium fluoride uptake (P < 0.0001), but not the accumulation of 18F-FDG, was significantly associated with calcification. Coincident uptake of both 18F-sodium fluoride and 18F-FDG was observed in 14 (6.5%) of the 215 arterial lesions with radiotracer accumulation. Only 20.9% of all arterial calcification sites showed increased 18F-sodium fluoride uptake. There was a significant correlation between the intensity of 18F-sodium fluoride uptake and both calcification score (rs = 0.36; P < 0.001) and calcified lesion thickness (rs = 0.22; P = 0.04).
On a per-segment basis, 70 (25.9%) of the 270 studied arterial segments were 18F-sodium fluoride PET–positive, 96 (35.6%) were 18F-FDG PET–positive, and 121 (44.8%) were CT-positive. There were on average 1.5 ± 0.9 sites of 18F-sodium fluoride uptake in an affected segment, 1.3 ± 0.6 sites of 18F-FDG accumulation, and 4.2 ± 3.9 calcified lesions. The results of the analysis of 18F-sodium fluoride uptake, 18F-FDG uptake, and vascular calcification on a per-patient basis are given in Table 5.
18F-Sodium Fluoride Uptake, 18F-FDG Uptake, and Calcification on Per-Patient Basis
The presence of 18F-sodium fluoride accumulation was significantly associated with age (P < 0.0001). There was a statistically significant association between presence of arterial 18F-FDG uptake and age (P = 0.0005), hypertension (P = 0.03), and history of smoking (P = 0.03). Vascular calcification was significantly associated with age (P < 0.0001), hypercholesterolemia (P = 0.04), and history of smoking (P = 0.03). All other risk factors were more common in subjects with vessel wall alterations without reaching statistical significance.
Color-Coded Multistudy Image Fusion of PET and CT Scans
Image coregistration and fusion of 18F-FDG and 18F-fluoride PET/CT studies proved to be feasible in 37 (82.2%) of the 45 patients included. In all other patients, the variability in breathhold positions and minor differences in patient positioning interfered with the coregistration process. The imaging data of these patients were therefore exclusively evaluated by side-by-side reading of PET/CT scans. Example images of atherosclerotic lesions on coregistered PET/CT studies are given in Figures 2 and 3.

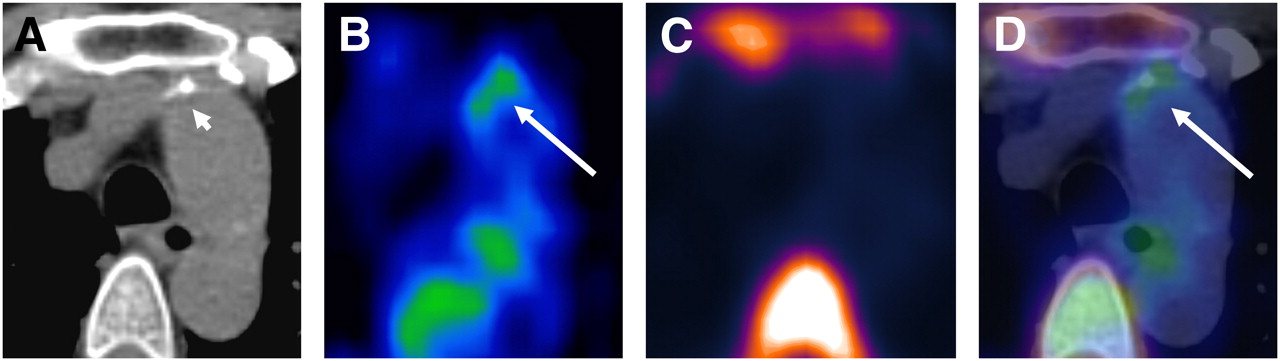
Transaxial PET/CT images of atherosclerotic plaque in ascending aorta: CT image (A), 18F-FDG PET image (B), 18F-fluoride PET image (C), and coregistered and fused 18F-FDG/18F-fluoride PET/CT image (D). Uptake of 18F-FDG coincides with calcification but not with 18F-fluoride accumulation. 18F-FDG activity adjacent to esophagus represents activity spillover from esophageal wall. Short arrow = calcification; long arrow = tracer uptake.

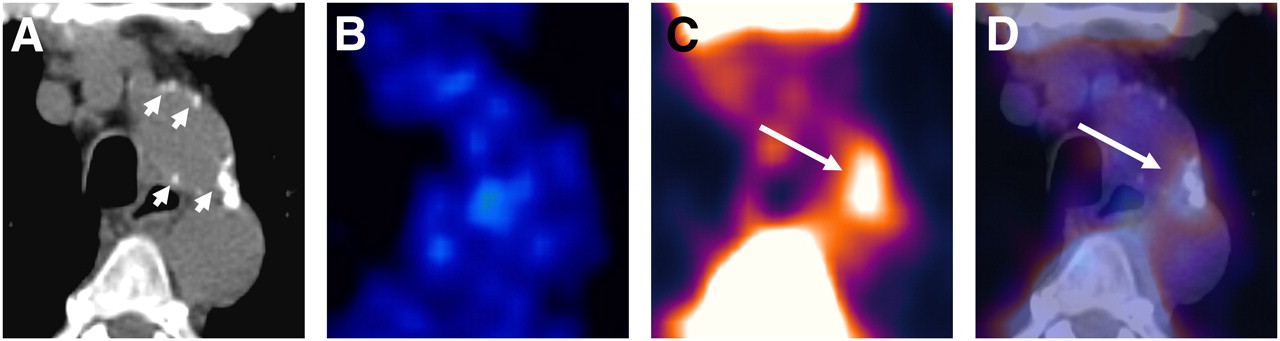
Transaxial PET/CT images of atherosclerotic plaque in aortic arch: CT image (A), 18F-FDG PET image (B), 18F-fluoride PET image (C), and coregistered and fused 18F-FDG/18F-fluoride PET/CT image (D). Accumulation of 18F-fluoride is colocalized with large calcification but not with 18F-FDG uptake. Short arrow = calcifications; long arrow = tracer uptake.
Reproducibility
The interrater Cohen κ was 0.85 (95% CI, 0.78–0.91) for calcification in arterial segments, 0.83 (95% CI, 0.75–0.90) for 18F-sodium fluoride uptake, and 0.81 (95% CI, 0.73–0.88) for 18F-FDG uptake. The intrarater Cohen κ was 0.92 (95% CI, 0.87–0.97) for calcification in arterial segments, 0.87 (95% CI, 0.80–0.93) for 18F-sodium fluoride uptake, and 0.84 (95% CI, 0.77–0.91) for 18F-FDG uptake.
DISCUSSION
We present, to our knowledge, the first study that reports on the correlation of vascular inflammation assessed by 18F-FDG PET with active mineral deposition in atherosclerotic plaque as assessed by 18F-sodium fluoride PET and arterial calcification as determined by CT. This initial analysis provides a rationale for further studies exploring the benefit of combining inflammation and mineral deposition imaging into a more complete evaluation of the complex pathophysiologic phenomena observed in atherosclerotic plaque.
Formation and progression of atherosclerotic plaque is a dynamic and complex process involving various pathophysiologic steps including inflammation and calcification (2,6). Inflammation is mainly mediated by macrophages, which undergo a complex evolution in plaque involving foam cell formation, inflammatory response, and apoptosis. The secretion of metalloproteinases and proinflammatory cytokines such as IL-6 contributes to the instability of these macrophage-rich, vulnerable plaques (25–28). Both passive and active mechanisms may be advocated to explain mineral deposition in atherosclerotic plaque. Passive mineral deposition is associated with areas of necrosis or advanced tissue degeneration that may frequently be encountered in atherosclerotic plaque (29,30). In contrast, active arterial calcification is a regulated process akin to bone formation and involves osteoblast- and osteoclastlike cells and the secretion of several bone-related regulatory peptides (6,31). Combined 18F-sodium fluoride and 18F-FDG PET/CT offers the opportunity to visualize several molecular markers of atherosclerosis.
With regard to the colocalization of tracer uptake and CT-detected calcification in the large arteries, our study confirms findings from previous investigations. In our study, only 18 (14.5%) of the 124 lesions with 18F-FDG accumulation demonstrated coincident calcification in at least some part of the vessel wall alteration. Although existing investigations are difficult to compare because of differences in the studied portion of the arterial system and in the data analysis, congruent 18F-FDG uptake and calcification were reported in 2%–14% of studies (2,11). For example, Ben-Haim et al. found coincident uptake in 7% of sites (8). In the present study, 81 (77.1%) of the 105 arterial lesions with increased 18F-sodium fluoride uptake were colocalized with calcification. In another work examining all major arteries in a larger cohort, colocalization of 18F-sodium fluoride uptake with calcification was noted in 88% of lesions (17). However, only 20.9% of all calcified lesions detected by CT showed increased 18F-sodium fluoride uptake. This might be explained in part by the observation that tracer uptake correlated with both calcification score (P < 0.001) and calcified lesion thickness (P = 0.04), suggesting that the detectability of tracer uptake is higher in larger lesions because of a smaller influence of partial-volume effects. Moreover, one may hypothesize that continuing mineral deposition in plaque might be associated with progressive, growing calcified lesions, whereas plaque without 18F-sodium fluoride uptake might represent nonprogressive disease. In this study, 18F-sodium fluoride PET differentiated between plaque with and without continuing mineral deposition and provided functional information about the activity of the calcification process, whereas CT could only demonstrate the presence of mere calcification.
Interestingly, uptake of 18F-FDG and 18F-sodium fluoride in vessel wall alterations was rarely coincident. We observed colocalization of these tracers in only 6.5% of lesions with tracer accumulation. Therefore one may hypothesize that variations in these patterns reflect differences in the stage of the disease. 18F-FDG and 18F-fluoride might provide different types of information with regard to the age of the atherosclerotic lesion. Inflammation mediated by macrophages is involved in the beginning of the formation of plaque, and calcification is usually considered a sign of advanced atherosclerotic disease (2,6,32). Different PET tracers may therefore allow in vivo differentiation between atherosclerotic lesions with predominant inflammation and those with predominant mineral deposition by visualizing the prevailing pathophysiologic process in the plaque on a molecular level.
Several studies have consistently shown that focal accumulation of 18F-FDG in large arteries is associated with the presence of atherogenic risk factors such as age, hypertension, and hypercholesterolemia (2,8,10). Additionally, another study demonstrated that vascular 18F-FDG uptake is increased in patients with prior cardiovascular events (33). Rudd et al. observed that 18F-FDG accumulation is higher in symptomatic carotid lesions than in asymptomatic contralateral plaques of the same patient (34). Moreover, Rominger et al. found that 18F-FDG PET/CT holds the po-tential to identify patients at risk for future cardiovascular events (12). The prevalence of 18F-sodium fluoride uptake in large arteries is also significantly associated with age and is more frequent in men than in women (17). Further studies are needed to determine whether the arterial accumulation of either 18F-FDG or 18F-sodium fluoride, or the simultaneous uptake of both tracers in atherosclerotic plaque, might indicate the highest risk for the occurrence of atherothrombotic complications.
These findings advocate for the use of both 18F-fluoride and 18F-FDG PET/CT for the characterization of atherosclerotic plaque by exploiting the different functional and morphologic markers obtainable by these imaging procedures. Further prospective studies are needed to define a combination of variables to sensitively predict future cardiovascular events and to eventually target therapeutic interventions.The following limitations of the present study should be mentioned. First, in all patients both 18F-sodium fluoride and 18F-FDG PET/CT had been performed using a routine protocol for oncologic indications without cardiac or respiratory gating. Missing synchronization of PET image acquisition with both the spontaneous respiration rate and the cardiac cycle might have affected the visualization of vascular tracer uptake, particularly in small lesions, and in the ascending aorta and the aortic arch (35). The feasibility of multistudy image fusion was hampered by the variability in breath-holding positions and patient positioning between the different PET/CT scans. Future protocols combining different PET tracers for the evaluation of atherosclerotic plaque should focus on obtaining perfectly equal conditions with regard to breath-holding positions if subsequent image fusion of separate scans is intended. Second, data concerning the exact structure, biologic composition, and inflammatory state of the detected plaques are not available, because histologic evaluation of these plaques was not performed. Autoradiographic studies and histologic evaluation in an animal model of atherosclerosis might contribute to a better understanding of the involved mechanisms and interdependencies. Third, some studies have demonstrated fluctuating 18F-FDG uptake in plaque (36). Although the time interval between the 2 PET/CT scans was less than 1 mo in 30 of the 45 patients, this length might have influenced our analysis. Additionally, 9 patients had prior, but not concurrent, chemotherapy before either 18F-FDG or 18F-sodium fluoride PET. Although the influence of chemotherapy on tracer uptake in plaque is currently unclear, our analysis might have been affected. Finally, another limitation of the present investigation is the relatively limited number of patients included in this pilot-phase study. Larger prospective trials are needed for a better understanding of the precise benefits of the combined 18F-fluoride/18F-FDG PET/CT approach and for refinement of the image-processing algorithm.
CONCLUSION
Complementary use of 18F-FDG and 18F-sodium fluoride PET/CT may allow evaluation of distinct pathophysiologic processes in atherosclerotic lesions and may provide information on interactions involved in formation and progression of atherosclerotic plaque.
DISCLOSURE STATEMENT
The costs of publication of this article were defrayed in part by the payment of page charges. Therefore, and solely to indicate this fact, this article is hereby marked “advertisement” in accordance with 18 USC section 1734.
Acknowledgments
We gratefully acknowledge helpful discussions with Lothar Spies, BBS Medical Services. No potential conflict of interest relevant to this article was reported.
- © 2011 by Society of Nuclear Medicine
REFERENCES
- Received for publication January 6, 2011.
- Accepted for publication April 26, 2011.


Jump to section
Related Articles
Cited By...
- Multimodality Imaging of Aortic Valve Calcification and Function in a Murine Model of Calcific Aortic Valve Disease and Bicuspid Aortic Valve
- Multimodality Imaging of Aortic Valve Calcification and Function in a Murine Model of Calcific Aortic Valve Disease and Bicuspid Aortic Valve
- 18F-NaF PET/CT of Obese Patients on a Lutetium-Yttrium Oxyorthosilicate PET/CT System: Patient Dosimetry, Optimization of Injected Activity, and Acquisition Time
- Imaging Inflammation in Atherosclerosis with CXCR4-Directed 68Ga-Pentixafor PET/CT: Correlation with 18F-FDG PET/CT
- Nanobody-Facilitated Multiparametric PET/MRI Phenotyping of Atherosclerosis
- Three-Hour Delayed Imaging Improves Assessment of Coronary 18F-Sodium Fluoride PET
- Assessment of Physiologic Intracranial Calcification in Healthy Adults Using 18F-NaF PET/CT
- Imaging Cardiovascular Calcification
- Clinical Molecular Imaging of Chemokine Receptor CXCR4 Expression in Atherosclerotic Plaque Using 68Ga-Pentixafor PET: Correlation with Cardiovascular Risk Factors and Calcified Plaque Burden
- 18F-Flurodeoxyglucose and 18F-Sodium Fluoride Positron Emission Tomography/Computed Tomography Imaging of Arterial and Cutaneous Alterations in Pseudoxanthoma Elasticum
- Clinical Relevance of 18F-Sodium Fluoride Positron-Emission Tomography in Noninvasive Identification of High-Risk Plaque in Patients With Coronary Artery Disease
- 18F-Fluoride Imaging and Other Plaque-Seeking Diagnostic Strategies: Understanding the Reality and Setting the Ground Rules...
- Association Between Osteogenesis and Inflammation During the Progression of Calcified Plaque Evaluated by 18F-Fluoride and 18F-FDG
- Coronary Artery Calcification: From Mechanism to Molecular Imaging
- Evaluation of 68Ga-Glutamate Carboxypeptidase II Ligand Positron Emission Tomography for Clinical Molecular Imaging of Atherosclerotic Plaque Neovascularization
- Noninvasive Molecular Imaging of Disease Activity in Atherosclerosis
- Impact of Personal Characteristics and Technical Factors on Quantification of Sodium 18F-Fluoride Uptake in Human Arteries: Prospective Evaluation of Healthy Subjects
- 18F-NaF Uptake by Atherosclerotic Plaque on PET/CT Imaging: Inverse Correlation Between Calcification Density and Mineral Metabolic Activity
- 18F-Sodium Fluoride Uptake Is a Marker of Active Calcification and Disease Progression in Patients With Aortic Stenosis
- The Advancing Clinical Impact of Molecular Imaging in CVD
- Coronary Arterial 18F-Sodium Fluoride Uptake: A Novel Marker of Plaque Biology
- Feasibility of 11C-Acetate PET/CT for Imaging of Fatty Acid Synthesis in the Atherosclerotic Vessel Wall