


Abstract
Coronary 18F-sodium fluoride (18F-NaF) PET identifies ruptured plaques in patients with recent myocardial infarction and localizes to atherosclerotic lesions with active calcification. Most studies to date have performed the PET acquisition 1 h after injection. Although qualitative and semiquantitative analysis is feasible with 1-h images, residual blood-pool activity often makes it difficult to discriminate plaques with 18F-NaF uptake from noise. We aimed to assess whether delayed PET performed 3 h after injection improves image quality and uptake measurements. Methods: Twenty patients (67 ± 7 y old, 55% male) with stable coronary artery disease underwent coronary CT angiography (CTA) and PET/CT both 1 h and 3 h after the injection of 266.2 ± 13.3 MBq of 18F-NaF. We compared the visual pattern of coronary uptake, maximal background (blood pool) activity, noise, SUVmax, corrected SUVmax (cSUVmax), and target-to-background (TBR) ratio in lesions defined by CTA on 1-h versus 3-h 18F-NaF PET. Results: On 1-h PET, 26 CTA lesions with 18F-NaF PET uptake were identified in 12 (60%) patients. On 3-h PET, we detected 18F-NaF PET uptake in 7 lesions that were not identified on 1-h PET. The median cSUVmax and TBRs of these lesions were 0.48 (interquartile range [IQR], 0.44–0.51) and 1.45 (IQR, 1.39–1.52), respectively, compared with −0.01 (IQR, −0.03–0.001) and 0.95 (IQR, 0.90–0.98), respectively, on 1-h PET (both P < 0.001). Across the entire cohort, 3-h PET SUVmax was similar to 1-h PET measurements (1.63 [IQR, 1.37–1.98] vs. 1.55 [IQR, 1.43–1.89], P = 0.30), and the background activity was lower (0.71 [IQR, 0.65–0.81] vs. 1.24 [IQR, 1.05–1.31], P < 0.001). On 3-h PET, TBR, cSUVmax, and noise were significantly higher (respectively: 2.30 [IQR, 1.70–2.68] vs. 1.28 [IQR, 0.98–1.56], P < 0.001; 0.38 [IQR, 0.27–0.70] vs. 0.90 [IQR, 0.64–1.17], P < 0.001; and 0.10 [IQR, 0.09–0.12] vs. 0.07 [IQR, 0.06–0.09], P = 0.02). Median cSUVmax and TBR increased by 92% (range, 33%–225%) and 80% (range, 20%–177%), respectively. Conclusion: Blood-pool activity decreases on delayed imaging, facilitating the assessment of 18F-NaF uptake in coronary plaques. Median TBR increases by 80%, leading to the detection of more plaques with significant uptake than are detected using the standard 1-h protocol. A greater than 1-h delay may improve the detection of 18F-NaF uptake in coronary artery plaques.
Coronary 18F-sodium fluoride (18F-NaF) PET depicts biologic processes involved in plaque formation and rupture in patients with coronary artery disease (1). Hybrid PET/coronary CT angiography (CTA) has shown increased 18F-NaF uptake to localize in regions of recent plaque rupture in patients with acute myocardial infarction, as well as in coronary plaques with high-risk features on intravascular ultrasound in patients with stable coronary artery disease (2). As this promising imaging approach is still in its infancy, several technical aspects regarding 18F-NaF coronary PET remain to be addressed (3,4).
In the 1970s, when 18F-NaF was first used for bone scanning, Blau et al. suggested that the optimal scanning time for 18F-NaF is 2–4 h after tracer injection (5,6). Nevertheless, whole-body 18F-NaF PET is nowadays most often performed with imaging commencing 60 min after injection (7–10). In cardiovascular PET, in most studies to date assessing 18F-NaF uptake in atherosclerotic plaques, acquisition has been performed 1 h after tracer administration (1,2,11–13). Although semiquantitative analysis is feasible with 1-h images, it can be difficult to discriminate plaques with 18F-NaF uptake from noise. Recently, it has been speculated that the optimal time for atherosclerotic plaque imaging with 18F-NaF might differ from the 1-h postinjection time-point used for bone imaging (13). Up to date, only one study has looked at the optimal timing for cardiovascular 18F-NaF imaging, but that study performed the ungated low-count PET acquisition measuring overall uptake in the entire heart rather than in coronary plaques (14). In this study, we aimed to quantitatively assess whether state-of-the-art PET scanning delayed until 3 h after injection improves image quality and coronary 18F-NaF uptake measurements.
MATERIALS AND METHODS
Patients
We analyzed the scans of 20 patients with stable coronary artery disease who underwent coronary CTA and PET/CT both 1 h and 3 h after a single injection of 18F-NaF at Severance Cardiovascular Hospital. All study participants had angiographically proven coronary artery disease (defined as at least one >50% luminal stenosis). Exclusion criteria included renal dysfunction (estimated glomerular filtration rate ≤ 30 mL/min/1.73 m2), contraindication to iodinated contrast agents, significant ventricular or atrial arrhythmia (which could compromise image quality), class III congestive heart failure, and ejection fraction of less than 35%. The study was approved by the investigational review board, and written informed consent was obtained from all enrolled patients.
Imaging Acquisition and Reconstruction
PET
All patients underwent 18F-NaF PET/CT on a hybrid PET/CT scanner (Discovery 710; GE Healthcare). Before imaging, subjects were administered a target dose of 250 MBq of 18F-NaF and rested in a quiet environment for 60 min. After the acquisition of a noncontrast attenuation correction scan, PET data were acquired in list mode for 30 min. The list-mode dataset was reconstructed using a standard ordered expectation-maximization algorithm with resolution recovery (SharpIR; GE Healthcare). Corrections were applied for attenuation, dead time, scatter, and random coincidences. Using 10 cardiac gates, the data were reconstructed on a 256 × 256 matrix (20 × 20 cm field of view) using 24 subsets and applying 4 iterations along with 5-mm gaussian smoothing. For SUV assessment, all analyzed values were decay-corrected to the injection time.
CTA
After the 1-h PET acquisition, contrast-enhanced coronary CTA was performed with prospective electrocardiography triggering if the heart rate was regular and less than 60 beats/min or with electrocardiography-gated helical acquisition if the heart rate was irregular or more than 60 beats/min. All patients received β-blockers and sublingual nitrates. For contrast-enhanced imaging, iodinated contrast (65–130 mL) was power-injected at 5–6 mL/s, followed by a saline flush. Transverse images were reconstructed using filtered backprojection with 0.65-mm slice thickness, a 0.4-mm increment, and a medium-soft convolution kernel.
Delayed PET
A second PET scan with low-dose CT for attenuation correction was performed 3 h after tracer administration using the same protocol for imaging and the same reconstruction of PET datasets as used in the 1-h study.
PET Motion Correction
Cardiac motion was corrected in the 1-h and 3-h 18F-NaF PET/CT data. This technique compensates for coronary artery motion by aligning all gates to the end-diastolic position and has demonstrated its ability to reduce image noise and improve target-to-background ratio (TBR) (15). First, anatomic coronary artery data were extracted from diastolic coronary CTA by applying a vessel-tracking algorithm based on Bayesian maximal paths using dedicated software (Autoplaque, version 2.0; Cedars-Sinai Medical Center). Second, a diffeomorphic mass-preserving image registration algorithm was used to align the 10 gates of PET data to the end-diastolic gate (gate 7 or 8, dependent on the timing of the CTA acquisition). After motion correction, the 10 gates were summed to build a motion-free image containing counts from the entire PET acquisition.
Image Analysis
Coronary CTA
Coronary artery plaques were evaluated in accordance with the Society of Cardiovascular CT guidelines (16). The extent of disease was characterized by lesion maximal stenosis (Autoplaque), plaque composition (noncalcified, partially calcified, or totally calcified), the segment involvement score, and coronary calcium scoring (17,18).
PET
Axial coronary 18F-NaF images were analyzed using FusionQuant Software (Cedars-Sinai Medical Center). PET and CTA reconstructions were reoriented, fused, and systematically coregistered in all 3 planes. Key points of reference were the sternum, vertebrae, blood pool in the ventricles, and great vessels. For each scan, plaque activity was measured by delimiting 3-dimensional volumes of interest on lesions. All segments with coronary plaque (at least a grade 2 stenosis [>25%]) and a lumen diameter of at least 2 mm, as defined by CTA, were interrogated. The SUVmax was recorded from all these segments by delimiting a spheric volume of interest (radius, 5 mm). Background blood-pool activity (SUVmean) was measured by delimiting a cylindric volume of interest (radius, 10 mm; thickness, 5 mm) in the right atrium at the level of the right coronary artery orifice (19). TBRs were calculated by dividing SUVmax by averaged background blood-pool activity. Corrected SUVmax (cSUVmax) was calculated by subtracting the blood-pool activity from SUVmax. Image noise was defined as the coefficient of variance of the blood-pool activity. Coronary plaques were considered clearly positive for 18F-NaF uptake if they presented with focal tracer uptake that arose from the coronary plaque, followed the course of the vessel in 3 dimensions over more than 1 slice, and had a TBR of more than 1.25 (2). In addition to reporting decay-corrected uptake, we also evaluated the raw counts. The PET acquisitions were analyzed independently with at least a 21-d interval between the reading of the 1-h and 3-h postinjection scans.
Statistical Analysis
Continuous data are expressed as mean ± SD or as median and interquartile range (IQR), as appropriate. Parametric data were compared using the Student t test and paired Student t test, and nonparametric data were compared using the Wilcoxon rank sum and Wilcoxon signed-rank test, as appropriate. Categoric variables are presented as absolute numbers and percentages and were compared using a χ2 test or Fisher exact test, as appropriate. A 2-sided P value of less than 0.05 was considered statistically significant. Statistical analyses were performed using SPSS (version 24, IBM) software.
RESULTS
Twenty patients (67 ± 7 y old, 55% male) were recruited into the study. Patient baseline characteristics are shown in Table 1. On CTA, the median segment involvement and coronary calcium scores were 6 (IQR, 3–8) and 413 (IQR, 50–770), respectively. Exact PET tracer injected doses were 266.2 ± 13.3 MBq of 18F-NaF.
The 20 Patients’ Baseline Clinical Characteristics
1-Hour Postinjection Imaging
On 1-h PET (acquisition at 66.5 min [IQR, 64.5–71.8 min] after injection), coronary uptake exceeding the TBR threshold of 1.25 was observed in 12 (60%) patients. Twenty-six CTA segments were considered positive for 18F-NaF uptake. Eleven (41%) were in the left anterior descending, 6 (23%) in the left circumflex, 4 (16%) in the left main, and 5 (20%) in the right coronary artery. The association between patients’ baseline characteristics, risk profiles, and CTA findings are presented in Supplemental Tables 1 and 2 (supplemental materials are available at http://jnm.snmjournals.org).
3-Hour Postinjection Imaging
On visual inspection of delayed PET images (acquisition at 180.5 min [IQR, 177.3–193.0 min] after injection), background 18F-NaF activity was markedly reduced and coronary lesions more conspicuous. We identified all segments that had been detected on 1-h postinjection imaging (Fig. 1). In addition, 7 new segments (median stenosis, 48.6% [IQR, 35.7%–60.2%]) that were previously negative for 18F-NaF uptake demonstrated focal uptake with a TBR of more than 1.25 (Fig. 2). These lesions were found in 2 patients who had uptake elsewhere in the coronary vasculature and in 3 patients classified as negative for 18F-NaF coronary uptake on 1-h postinjection imaging. Although the SUVmax of these 7 new positive lesions was similar on 3-h versus 1-h PET (1.51 [IQR, 1.42–1.60] vs. 1.48 [IQR, 1.40–1.55], P = 0.68), the cSUVmax and TBR were higher on delayed imaging (respectively: 0.48 [IQR, 0.44–0.51] vs. −0.01 [IQR, −0.03–0.001] and 1.45 [IQR, 1.39–1.52] vs. 0.95 [IQR, 0.90–0.98], both P < 0.001).
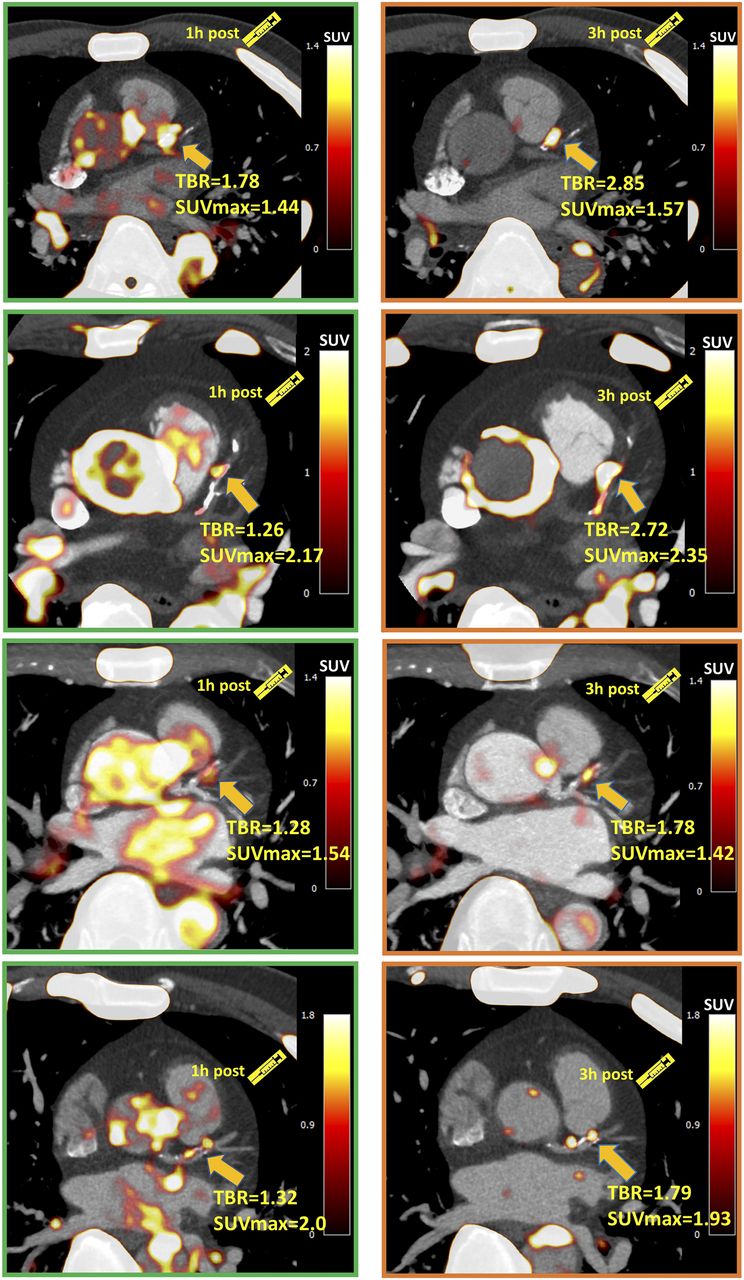
Four patients with significant coronary 18F-NaF uptake (TBR > 1.25) on 1-h PET in left anterior descending artery. Uptake can be difficult to differentiate in this region from blood pool in adjacent pulmonary artery. On 3-h PET, TBR increased significantly, and blood-pool activity reduced, improving image quality.
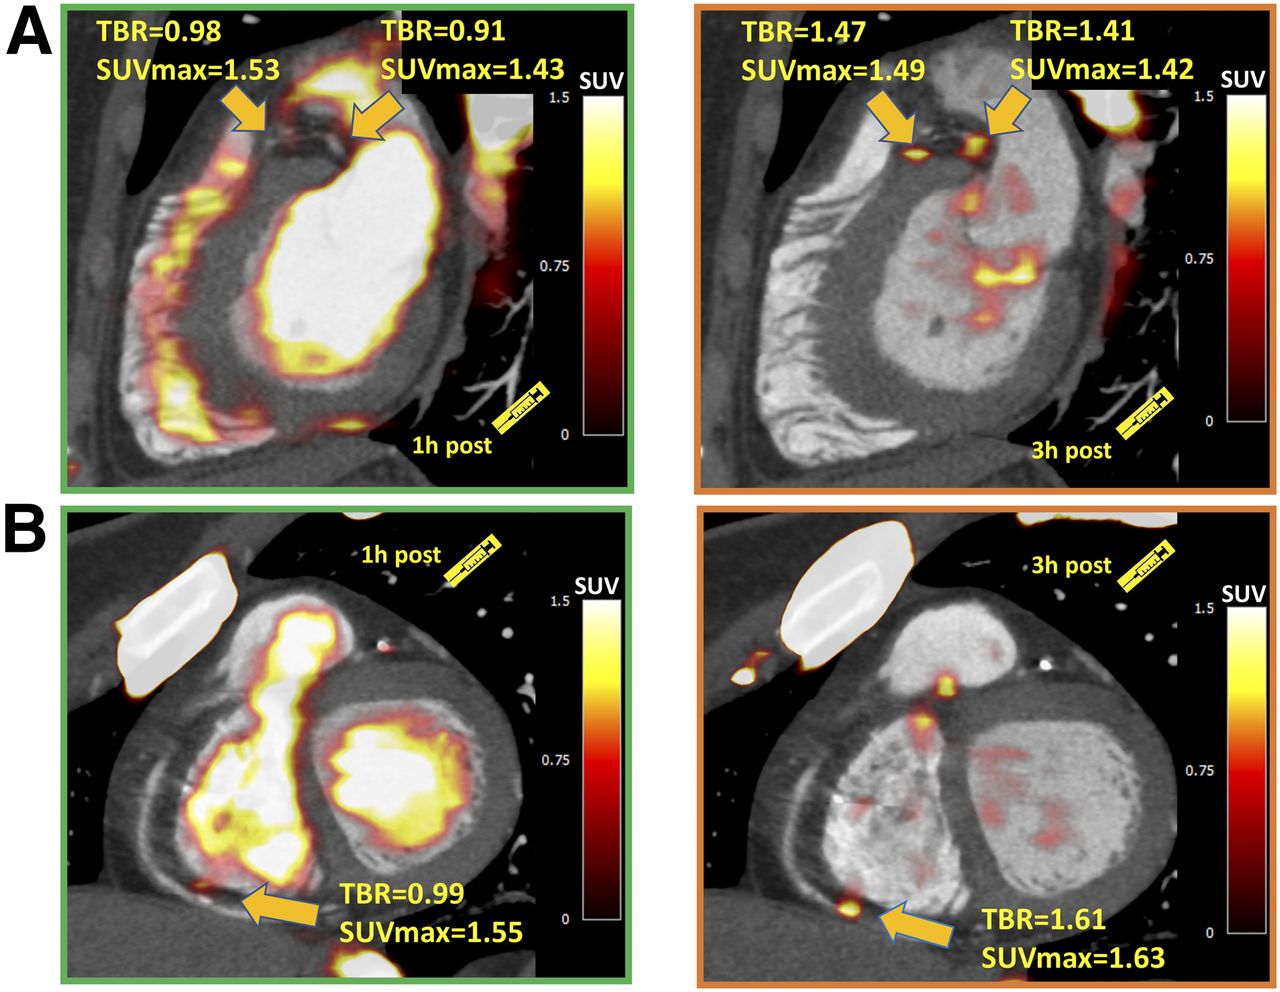
Examples of coronary plaques with significant uptake on 3-h PET and low tracer activity on 1-h PET. These short-axis images of proximal left anterior descending, proximal circumflex (A), and distal right (B) coronary artery plaques show TBR of less than 1.0 on 1-h PET and uptake exceeding 1.25 TBR threshold at 3 h.
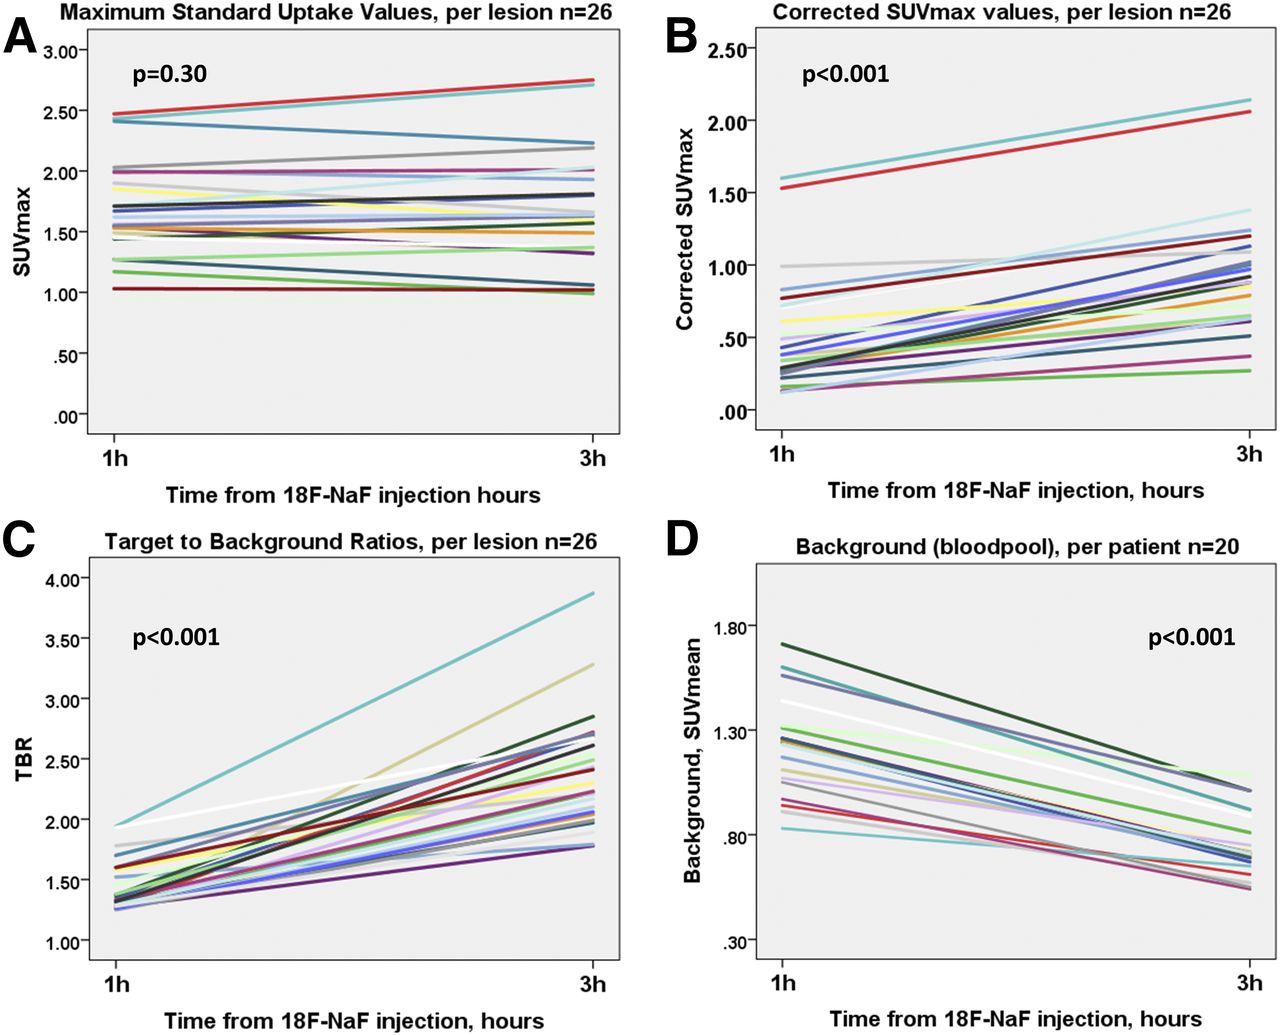
Across the entire cohort on 3-h PET compared with 1-h PET, the SUVmax of the detected lesions remained similar (1.63 [IQR, 1.37–1.98] vs. 1.55 [IQR, 1.43–1.89], P = 0.30). However, the background activity decreased to 0.71 (IQR, 0.65–0.81) versus 1.24 (IQR, 1.05–1.31) (P < 0.001), with a median decrease of 42% (range, 18%–48%). Consequently, TBR was higher (2.30 [IQR, 1.70–2.68] vs 1.28 [IQR, 0.98–1.56], P < 0.001), with a median TBR increase of 80% (range, 20%–177%; Figs. 3 and 4). A similar change was observed in cSUVmax (0.38 [IQR, 0.27–0.70] vs. 0.90 [IQR, 0.64–1.17], P < 0.001); median cSUVmax increased by 92% (range, 33%–225%; Figs. 3 and 4). In accordance with the Poisson distribution, we observed a 49.0% ± 3.8% decrease in counts on delayed imaging compared with 1-h PET. As expected from the fewer counts on 3-h PET, noise increased (0.10 [IQR, 0.09–0.12] vs. 0.07 [IQR, 0.06–0.09], P = 0.02) (Table 2).
Comparison of 18F-NaF Motion-Corrected Measurements on 1-Hour and 3-Hour PET
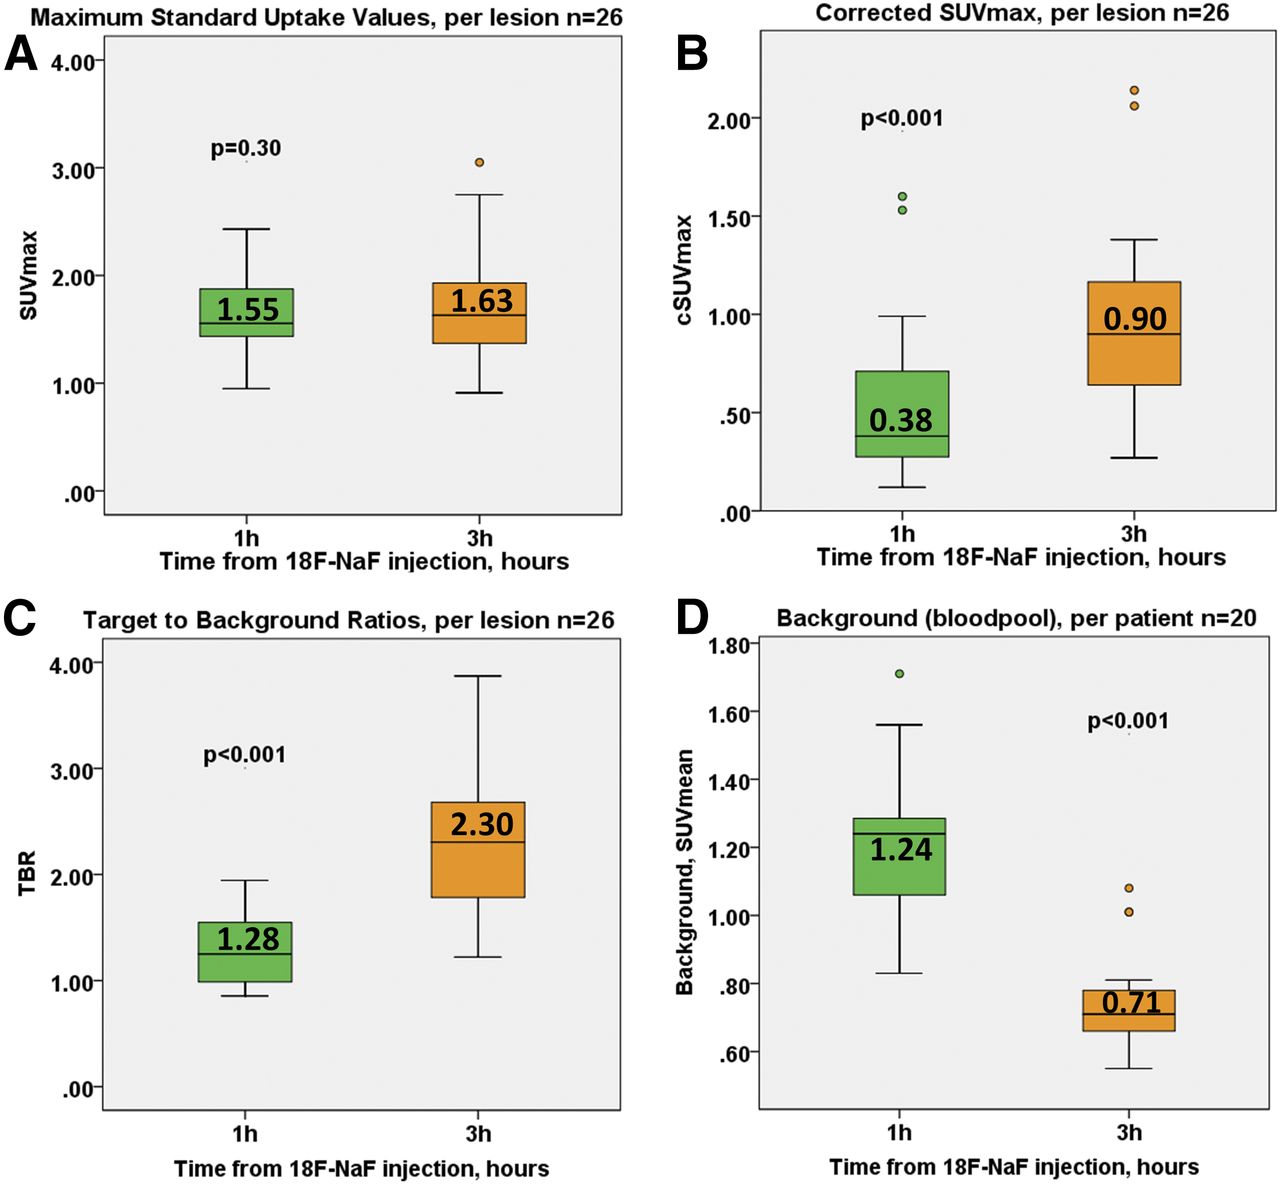
18F-NaF coronary uptake on 1-h and 3-h PET. (A) SUVmax was comparable on both scans. (B and C) cSUVmax and TBR were higher on 3-h PET. (D) Background (right atrium blood pool SUVmean) was lower on 3-h imaging.

Line plots of 18F-NaF coronary uptake on 1-h and 3-h PET. (A) SUVmax was comparable on both scans. (B and C) cSUVmax and TBR were higher on 3-h PET. (D) Background (right atrium blood pool SUVmean) was lower on 3-h imaging.
DISCUSSION
To our knowledge, this is the first study that used a 30-min-acquisition electrocardiography-gated coronary PET protocol to compare image quality and quantitative measures of 18F-NaF coronary uptake on images acquired at 1 h versus 3 h after injection. We hereby show that prolonging the time from tracer injection to PET acquisition can facilitate image analysis and provide lower background activity, higher TBR, and higher cSUVmax than the currently used protocol. We demonstrate that by delaying image acquisition to 3 h, new lesions, categorized as false-negative on the 1-h PET, are readily identified.
When current imaging protocols are used for PET acquisitions (1 h after injection), the reader is often challenged to distinguish true coronary uptake from overspill from the surrounding structures. A large proportion of 18F-NaF–positive plaques present with uptake that equals or is only slightly higher than the background activity. Visualization of these lesion is usually possible because of below–blood-pool activity in the adjacent myocardium. However, analysis can often be difficult, particularly in the proximal and mid portions of the left anterior descending coronary artery, which lies close to blood pool in the pulmonary artery (Fig. 1), and in the proximal circumflex coronary artery, which lies adjacent to the left atrial appendage. Techniques to improve the detection of such lesions are therefore required. To some extent, the blurring of tracer uptake due to cardiorespiratory and patient motion can be mitigated with end-diastolic imaging, improving the conspicuousness of lesions (1). Recently developed cardiac motion correction techniques further improve image quality by coregistering all cardiac gates to the reference one and allowing use of all PET data rather than only the data from a single diastolic gate (15). In this study, we show that delaying 18F-NaF coronary image acquisition further facilitates assessment of coronary uptake, predominantly as a result of a decrease in the background blood-pool activity.
Improved visual identification of lesions on delayed 18F-NaF PET is accompanied by significant improvements in TBR and cSUVmax. Although coronary SUVmax remained unchanged on 3-h PET, TBR improved significantly. We observed an increase in noise on delayed imaging (as expected from the lower count statistic); however, given the favorable decrease in the background activity, the noise level on 3-h PET did not impede image analysis.
The benefit of delayed PET acquisitions for the detection of disease is widely appreciated in oncologic applications with 18F-FDG (20–24). There is good agreement that because background activity decreases on delayed imaging, image quality improves. The lower background activity, by increasing the TBR, is a critical feature and advantage of delayed imaging (25,26). It has been shown that a longer time window from injection to acquisition translates to a higher signal-to-noise ratio and therefore facilitates visual analysis, providing higher diagnostic accuracy (20). For coronary PET, it has been suggested that the optimal timing for acquisition with 18F-FDG is 2.5–3 h after tracer administration (27,28).
In the case of bone 18F-NaF PET, since 18F-NaF has faster blood clearance and higher bone uptake than 99mTc-methylene diphosphonate, the practice guideline of the Society of Nuclear Medicine and Molecular Imaging recommends emission scanning for the axial skeleton as soon as 30–45 min after injection in patients with normal renal function (10) to decrease the overall time of the study. However, a longer waiting time of 90–120 min was recommended to acquire high-quality images of the extremities. Compared with uptake in the bony skeleton, 18F-NaF uptake due to active microcalcification formation in coronary plaque is very slight. Therefore, it is not surprising that a higher TBR in coronary plaques is observed with a longer waiting time from injection to acquisition. Longer delays for cardiovascular 18F-NaF PET have been evaluated by only one study to date (14). Blomberg et al. concluded that delayed 18F-NaF PET does not improve quantification of vascular calcification. However, the authors measured only overall heart 18F-NaF activity (including blood pool) by placing regions of interest around the cardiac silhouette on ungated PET/CT images (excluding 18F-NaF activity originating from bones and cardiac valves) and averaged the SUVs derived from all slices. As a result, identifying additional foci of uptake on delayed imaging was not feasible. Moreover, that study was performed without cardiac gating and motion correction. Further, with a 2.5-min scan time and a 2.2-MBq dose of 18F-NaF per kilogram of body weight, the number of counts was approximately 16 times less than on our coronary scans, which were acquired with an approximately 3.4 MBq dose per kilogram and a 30-min-long acquisition.
The use of coronary CTA in our study enabled measuring 18F-NaF uptake in individual coronary plaques. It also provided an opportunity to evaluate potential predictors of uptake by means of regression modeling (Supplemental Tables 1 and 2). Although our study is slightly underpowered, such analyses revealed that TBR is associated positively with partially calcified plaque and inversely with lipid-lowering drugs (statins). These findings are in line with previously published data showing that active calcification, macrophage infiltration, and partially calcified plaques are associated with 18F-NaF uptake (2,29). In contrast, in our study completely calcified plaques did not attract the PET tracer, supporting the view that 18F-NaF is a marker of active calcification, including the stage before the development of advanced atherosclerotic lesions, rather than established disease (30,31). Interestingly, as shown by the explanatory uni- and multivariate analysis, the associations with clinical and imaging data are stronger when 3-h PET data are used rather than 1-h data (Supplemental Tables 1 and 2).
Our findings have important clinical implications. Given the challenges that 18F-NaF imaging faces, such as small target lesion size and cardiac, respiratory, and gross patient motion, which collectively compromise image quality, a delayed acquisition protocol is an important step in mitigating the modest TBR reported in studies using the 1-h postinjection protocol. A decrease in the background signal not only improves TBR but also more easily identifies lesions that were difficult to detect 1 h after injection. Additionally, the 3-h postinjection approach allows coronary uptake to be assessed more readily by less experienced readers. In our view, such a protocol can facilitate dissemination of this imaging technique beyond academic institutions.
We acknowledge that our study was based on a modest number of patients with stable coronary artery disease. Importantly, despite this limitation, our findings are supported by statistically significant data. The normal limits applied to define an increase in TBR in our population were based on those derived from 1-h data; thus, it is likely that reference values for relevant uptake on 3-h 18F-NaF coronary PET will need to be derived for optimal use of delayed imaging (1,2). The use of TBR as a measure of tracer uptake remains to some degree controversial (32); however, we also evaluated cSUVmax, which has been suggested to be more robust for coronary imaging. The low TBR in our study can be attributed to partial-volume effects, as adjacent myocardium averages 60% of the blood-pool uptake (33). We acknowledge that a 3-h postinjection PET protocol may require reorganization of the workflow within the nuclear medicine department and will prolong the time patients spend in the imaging facility. Nevertheless, the benefits of delayed PET acquisition for the assessment of 18F-NaF coronary uptake undoubtedly outweigh such workflow inconveniences.
CONCLUSION
Blood-pool activity decreases on delayed imaging, facilitating the assessment of 18F-NaF uptake in coronary plaques. Delayed imaging increases cSUVmax and TBR on average by 92% (range, 33%–225%) and 80% (range, 20%–177%), respectively, leading to the detection of more plaques with clear increases in uptake than are detected by the standard 1-h protocol. A delay of more than 1 h may improve the detection of 18F-NaF uptake in coronary artery plaques.
DISCLOSURE
This research was supported in part by grant R01HL135557 from the National Heart, Lung, and Blood Institute/National Institutes of Health (NHLBI/NIH). The content is solely the responsibility of the authors and does not necessarily represent the official views of the National Institutes of Health. The study was also supported by a grant (“Cardiac Imaging Research Initiative”) from the Miriam & Sheldon G. Adelson Medical Research Foundation. No other potential conflict of interest relevant to this article was reported.
Footnotes
Published online Sep. 13, 2018.
- © 2019 by the Society of Nuclear Medicine and Molecular Imaging.
REFERENCES
- Received for publication July 17, 2018.
- Accepted for publication September 5, 2018.


