


Abstract
18F-FDG is the most widely validated PET tracer for the evaluation of atherosclerotic inflammation. Recently, 18F-NaF has also been considered a potential novel biomarker of osteogenesis in atherosclerosis. We aimed to analyze the association between inflammation and osteogenesis at different stages of atherosclerosis, as well as the interrelationship between these 2 processes during disease progression. Methods: Thirty-four myeloma patients underwent 18F-NaF and 18F-FDG PET/CT examinations. Lesions were divided into 3 groups (noncalcified, mildly calcified, and severely calcified lesions) on the basis of calcium density as measured in Hounsfield units by CT. Tissue-to-background ratios were determined from PET for both tracers. The association between inflammation and osteogenesis during atherosclerosis progression was evaluated in 19 patients who had at least 2 examinations with both tracers. Results: There were significant correlations between the maximum tissue-to-background ratios of the 2 tracers (Spearman r = 0.5 [P < 0.01]; Pearson r = 0.4 [P < 0.01]) in the 221 lesions at baseline. The highest uptake of both tracers was observed in noncalcified lesions, but without any correlation between the tracers (Pearson r = 0.06; P = 0.76). Compared with noncalcified plaques, mildly calcified plaques showed concordant significantly lower accumulation, with good correlation between the tracers (Pearson r = 0.7; P < 0.01). In addition, enhanced osteogenesis-derived 18F-NaF uptake and regressive inflammation-derived 18F-FDG uptake were observed in severely calcified lesions (Pearson r = 0.4; P < 0.01). During follow-up, increased calcium density and increased mean 18F-NaF uptake were observed, whereas mean 18F-FDG uptake decreased. Most noncalcified (86%) and mildly calcified (81%) lesions and 47% of severely calcified lesions had concordant development of both vascular inflammation and osteogenesis. Conclusion: The combination of 18F-NaF PET imaging and 18F-FDG PET imaging promotes an understanding of the mechanism of plaque progression, thereby providing new insights into plaque stabilization.
The histopathologic characteristics of vulnerable plaques include spotty calcification, a thin fibrous cap, a large necrotic core, and intraplaque hemorrhage (1). The continuous accumulation of macrophages can be found in all developmental stages of atherosclerotic arteries and can contribute to plaque instability (2). Thus, vascular inflammation, including macrophage density, infiltration, differentiation, and apoptosis rate, is recognized as a prominent predictor of a vulnerable lesion (3). Moreover, as a common complication in atherosclerosis, vascular calcifications in patients with atherosclerosis are more progressive, extensive, and severe than those in people without atherosclerosis because enhanced mineral metabolism during the formation of a plaque involves intensive osteogenic activity and increased volume (4).
Macrophage infiltration and endothelial activation trigger osteogenesis, which initiates atherosclerosis; subsequently, osteogenic activity and calcium density are closely associated with macrophage accumulation (5). It has often been observed that if inflammation continues, thin-cap, inflamed fibroatheromas with high vulnerability include spotty calcium deposits, which might serve as an independent predictor of increased vulnerability (6). Another prominent view is that decreased osteogenic activity is coupled with a reduction in inflammation that drives atherosclerosis to the advanced end stage. In advanced stages, the presence of intensive calcifications with limited inflammation might serve as a stabilizer in fibrous atherosclerotic lesions (4,6,7).
CT quantification of vascular calcification has been extensively validated, and the Hounsfield units (HU) from unenhanced low-dose CT scans were shown to be associated with the extent of calcified atherosclerotic lesions (8), but there is a lack of characterization of early osteogenic activity. Recently, it was discovered that atherosclerotic calcium is histomorphologically indistinguishable from bone and that the formation of vascular calcium is similar to bone development and metabolism. Thus, it was proposed that osteogenesis could be a marker for atherosclerotic disease (9).
18F-NaF has been used as a bone PET tracer to define osteogenic activity, and the feasibility of 18F-NaF PET/CT for identifying increased intraplaque osteogenic activity in vivo was confirmed in the context of atherosclerotic plaque imaging (10–13). This process is dependent on the density of hydroxyapatite, as well as the exposed surface of calcification in the vasculature. In addition, 18F-FDG is trapped intracellularly after phosphorylation by hexokinase to allow intratissue glucose metabolism assessment. It is also the most widely validated PET tracer for the evaluation of inflammation within atherosclerotic plaques on the basis of the glucose metabolism of macrophages (2).
Published studies have also evaluated the association between arterial calcification and the inflammation of vascular disease and demonstrated macrophage/monocyte regulation of vascular calcification through the induction of osteoblastic differentiation and mineralization during the progression of atherosclerosis (14,15).
In the present study, we investigated the arterial uptake of 18F-NaF and 18F-FDG and aimed to analyze the association between tracer accumulation and calcium density at different stages of atherosclerosis. We also aimed to examine the interrelationship between inflammation and osteogenesis during plaque growth.
MATERIALS AND METHODS
Patient Population
Thirty-four myeloma patients were included in this retrospective study. They underwent both 18F-NaF PET/CT to detect the presence of bone metastases and 18F-FDG PET/CT for staging or restaging purposes within 3 d. The relevant baseline characteristics of the patients are shown in Table 1. Nineteen patients were scheduled for follow-up scans with both 18F-NaF PET/CT and 18F-FDG PET/CT at 15 ± 4 (mean ± SD) mo after baseline, and 11 of them underwent another set of follow-up scans with both tracers 12 ± 6 mo later. These scans were used to characterize osteogenesis and inflammation during plaque progression. Patients with a history of systemic inflammatory disease, statin/ezetimibe/PCSK9 medication use, or clinical cardiovascular events (myocardial infarction or stroke) between baseline and follow-up scans were excluded. The clinical institutional review board approved this study, and patients gave written informed consent.
Patient Characteristics at Baseline (n = 34)
Radiotracer Preparation
Both 18F-FDG and 18F-NaF were produced using the fully automated FASTlab platform (GE Healthcare) with good manufacturing practices–compliant single-use cassettes under aseptic conditions in concordance with national health legislature and without any objection from local health authorities. Full radiopharmaceutical quality control, as described in specific monographs of the European Pharmacopoeia, was completed before release of the product for in vivo application. Radiotracers were prepared once per day regardless of patient numbers.
PET/CT Imaging
All patients were imaged on a hybrid PET/CT system (Biograph TPTV 64; Siemens). Patients fasted for at least 6 h before tracer injection (the serum glucose level at baseline was 104 ± 21 mg/dL). Patients received 310–380 MBq of 18F-NaF and 300–450 MBq of 18F-FDG within 3 d. Transmission data were acquired using low-dose CT (18F-NaF) and contrast-enhanced CT (18F-FDG). PET images were acquired using 2 min/bed position and reconstructed by use of an iterative algorithm with point spread function correction (16), including all relevant data corrections. Four iterations and 21 subsects were used in the reconstruction.
Image Analysis
For each patient, 8 segments of the large arteries were assessed: the left and right carotid arteries; the ascending thoracic aorta; the aortic arch; the descending thoracic aorta; the abdominal aorta; and the left and right iliac arteries. As a first step, noncontrast CT images were visually evaluated for the presence of calcified plaques in the 8 arterial segments. The presence of vascular calcifications was defined as a luminal area with a minimum calcium density of 130 HU by region-of-interest measurements (17). In the present study, 3 groups of lesions were defined for vascular calcifications: group 1, noncalcified lesions (calcium density, <130 HU); group 2, mildly calcified lesions (calcium density, 130–399 HU); and group 3, severely calcified lesions (calcium density, ≥400 HU).
The uptake of 18F-NaF and 18F-FDG in the calcified lesions was assessed with commercially available software (Hybrid 3D; Hermes Medical Solutions). The SUVmax of both 18F-FDG uptake and 18F-NaF uptake in all atherosclerotic lesions was determined by region-of-interest measurements. For the calculation of tissue-to-background ratios (TBR), SUVs were corrected for background blood-pool activity, which was calculated as the mean uptake from 3 regions of interest within the lumen of veins (18,19). The mean maximum TBR (TBRmax) of uptake was calculated for both tracers. For analyses of follow-up scans, the same lesions that were detected on baseline scans were considered for both tracers. To evaluate the relationship between the uptake ratios of the 2 tracers, we performed linear regression analyses of the baseline TBRmax for 18F-NaF and the baseline TBRmax for 18F-FDG in the 3 groups individually.
We used a predefined threshold TBR (18F-FDG) of 1.6 to identify increased inflammation (20,21) and a self-defined threshold TBR (18F-NaF) of 1.8 to indicate positive osteogenesis. Relevant calcium density changes were estimated as well. Stabilized/retarded development and progressive/positive development of the 2 processes are shown in Table 2. The interaction between atherosclerotic inflammation and osteogenesis and subsequent calcification evolution was assessed.
Criteria for Classification of Inflammation and Osteogenesis Based on Changes in 18F-FDG and 18F-NaF Uptake
Statistical Analysis
Apart from descriptive statistics at baseline, comparisons among the 3 groups of lesions were performed using one-way ANOVA. A Games–Howell post hoc test was performed to confirm where the differences occurred. For progression assessment as well as for antitumor medication assessment, a paired t test was performed to assess differences in uptake ratios for all lesions over time. The rank correlations of the TBRmax for 18F-NaF and the TBRmax for 18F-FDG in the arteries were assessed using the Spearman correlation. The associations of progressive calcium scores on CT with baseline and progressive uptake data on PET were assessed using Pearson linear regression analysis. P values of less than or equal to 0.05 were considered statistically significant.
RESULTS
Osteogenesis and Macrophage Metabolism in Relation to Plaque Calcification
At baseline, 221 atherosclerotic lesions (26 noncalcified and 195 calcified lesions) were detected within the 8 arterial segments in the 34 patients. The mean TBRmax of 18F-NaF uptake was significantly higher than that of 18F-FDG uptake (2.4 ± 0.8 vs. 1.8 ± 0.5; P < 0.01). The uptake of both tracers correlated significantly, but with a low Spearman rank correlation coefficient (r = 0.5; P < 0.01). In addition, a linear correlation coefficient of 0.4 (P < 0.01) between the TBRmax for 18F-NaF and the TBRmax for 18F-FDG was calculated by the Pearson correlation method for all lesions (Fig. 1); the highest degrees of correlation were shown for mildly calcified lesions (r = 0.7; P < 0.01) and then for severely calcified lesions (r = 0.4; P < 0.01). There was no correlation between the 2 tracers for noncalcified lesions (r = 0.06; P = 0.76) (Fig. 1).
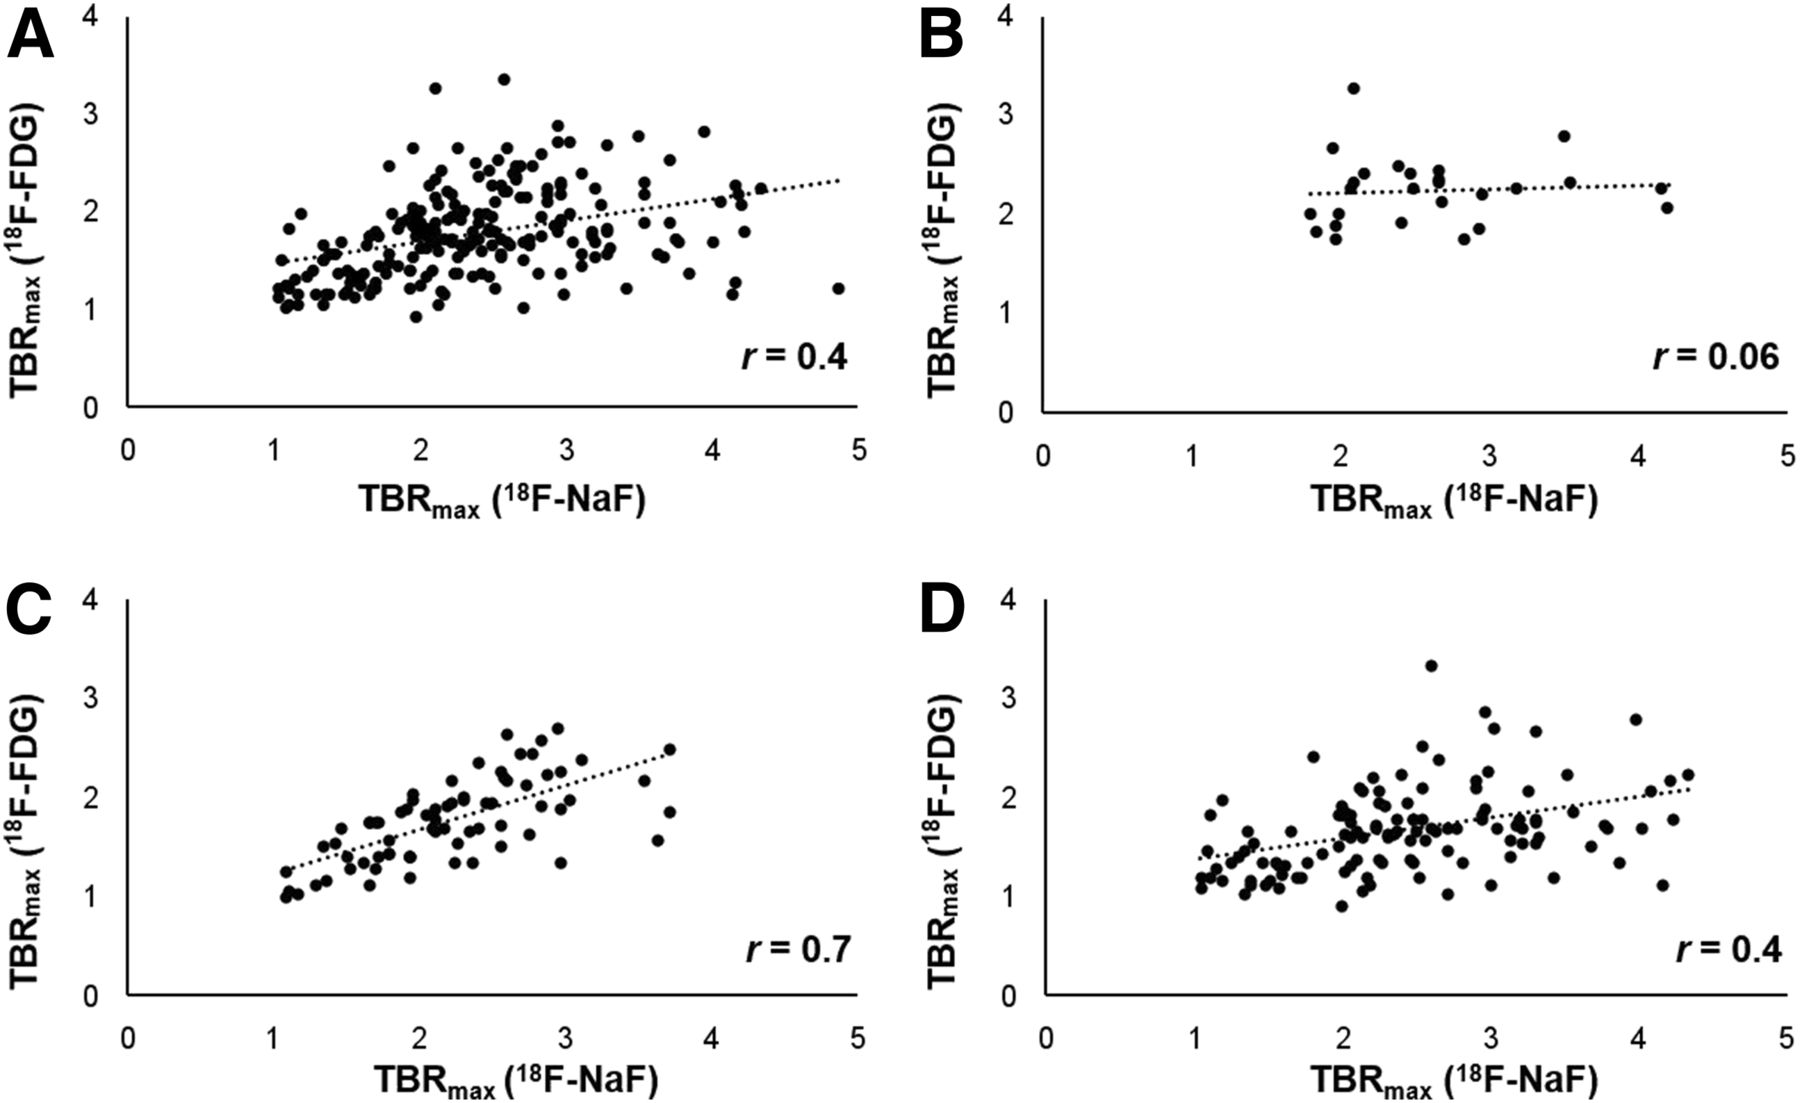
Linear relationship between TBRmax for 18F-NaF and TBRmax for 18F-FDG in all lesions (Pearson r = 0.4; P < 0.01) (A), in noncalcified lesions (Pearson r = 0.06; P = 0.76) (B), in mildly calcified lesions (Pearson r = 0.7; P < 0.01) (C), and in severely calcified lesions (Pearson r = 0.4; P < 0.01) (D).
In the group analyses at baseline, significantly higher uptake of 18F-FDG was observed in noncalcified lesions (TBRmax, 2.2 ± 0.3) than in mildly calcified lesions (TBRmax, 1.8 ± 0.4) (P < 0.05) or severely calcified lesions (TBRmax, 1.7 ± 0.4) (P < 0.05) (Fig. 2), whereas no significant differences were found between the 2 groups of calcified lesions (P = 0.28).
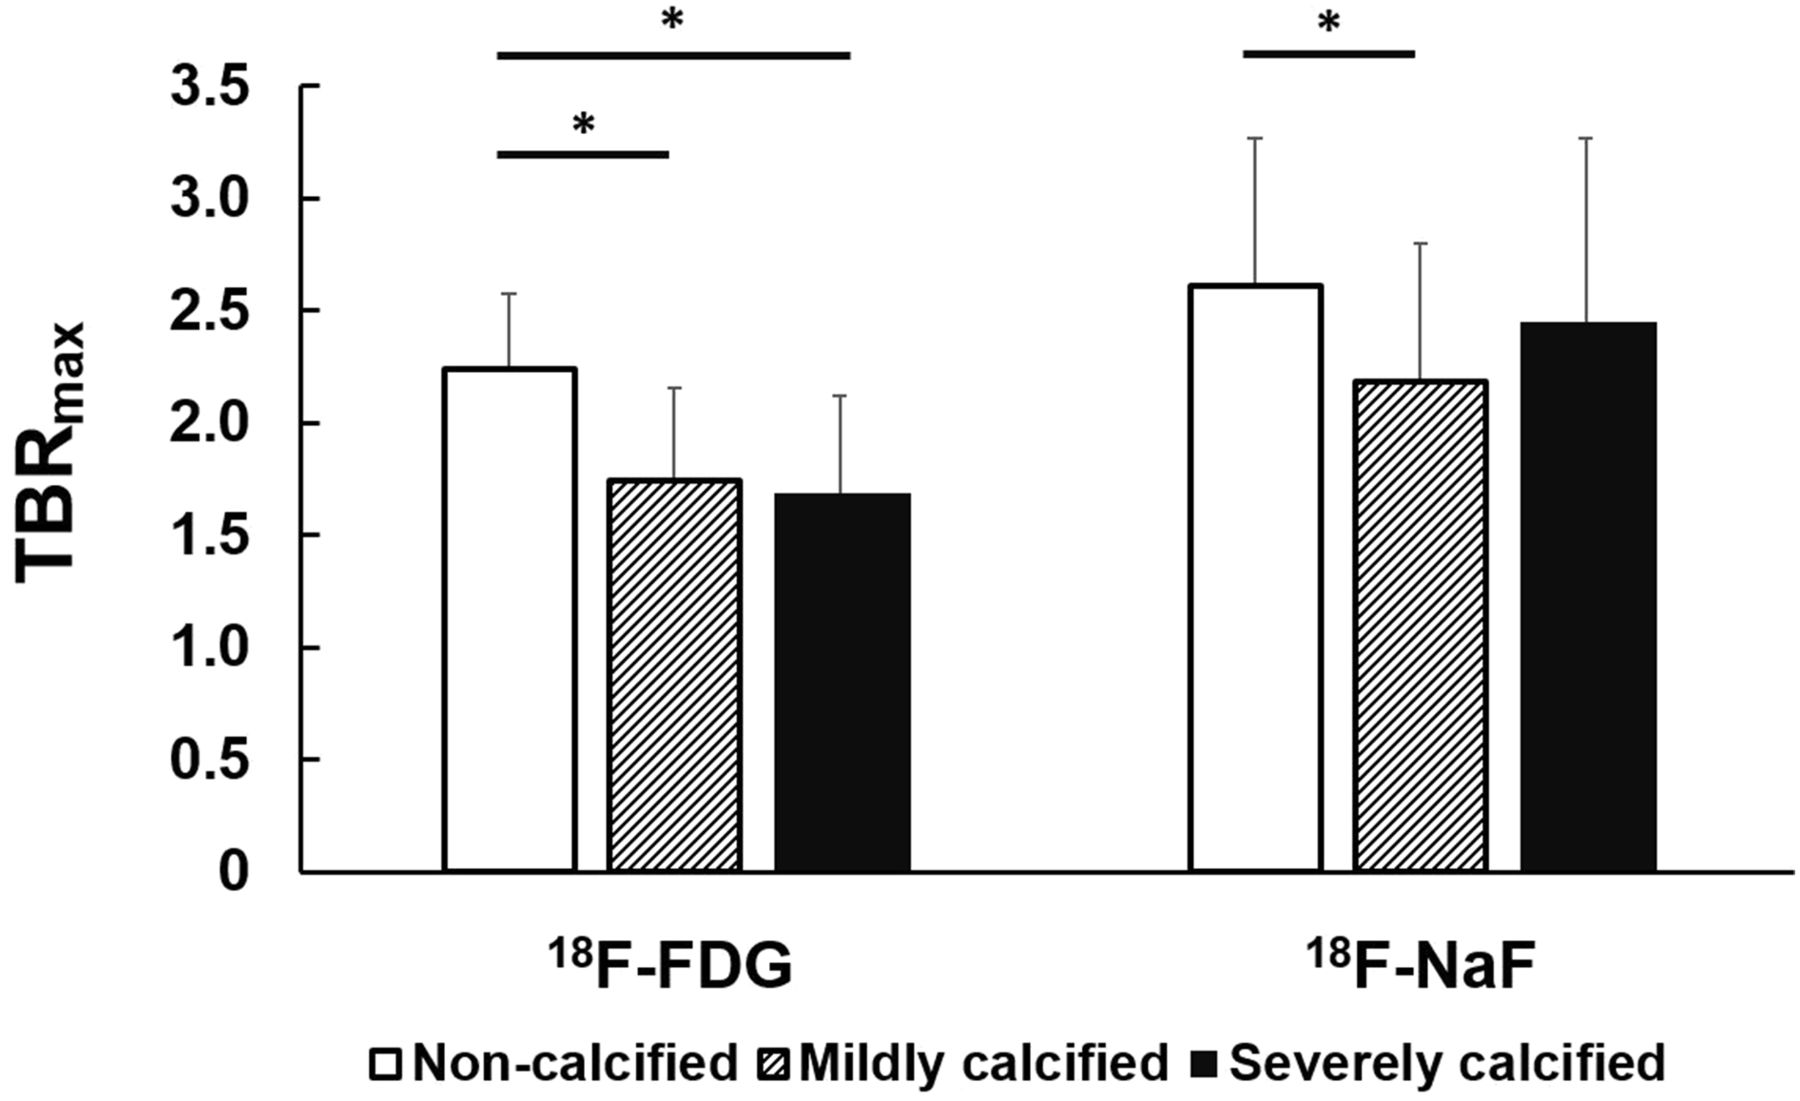
Mean TBRmax for different groups of atherosclerotic lesions according to calcifications. Asterisks indicate significant differences (P < 0.05).
For 18F-NaF, significantly enhanced osteogenesis-derived uptake was detected in noncalcified lesions (TBRmax, 2.6 ± 0.7). Likewise, a lower signal for vascular 18F-NaF uptake was detected in mildly calcified lesions (TBRmax, 2.2 ± 0.6; P < 0.05), whereas no significant differences were found between the 2 groups of calcified lesions (P = 0.13) or between noncalcified and severely calcified lesions (TBRmax, 2.4 ± 0.8; P = 0.39) (Fig. 2).
Differential Changes in Osteogenesis, Macrophage Metabolism, and Plaque Calcification Over Time
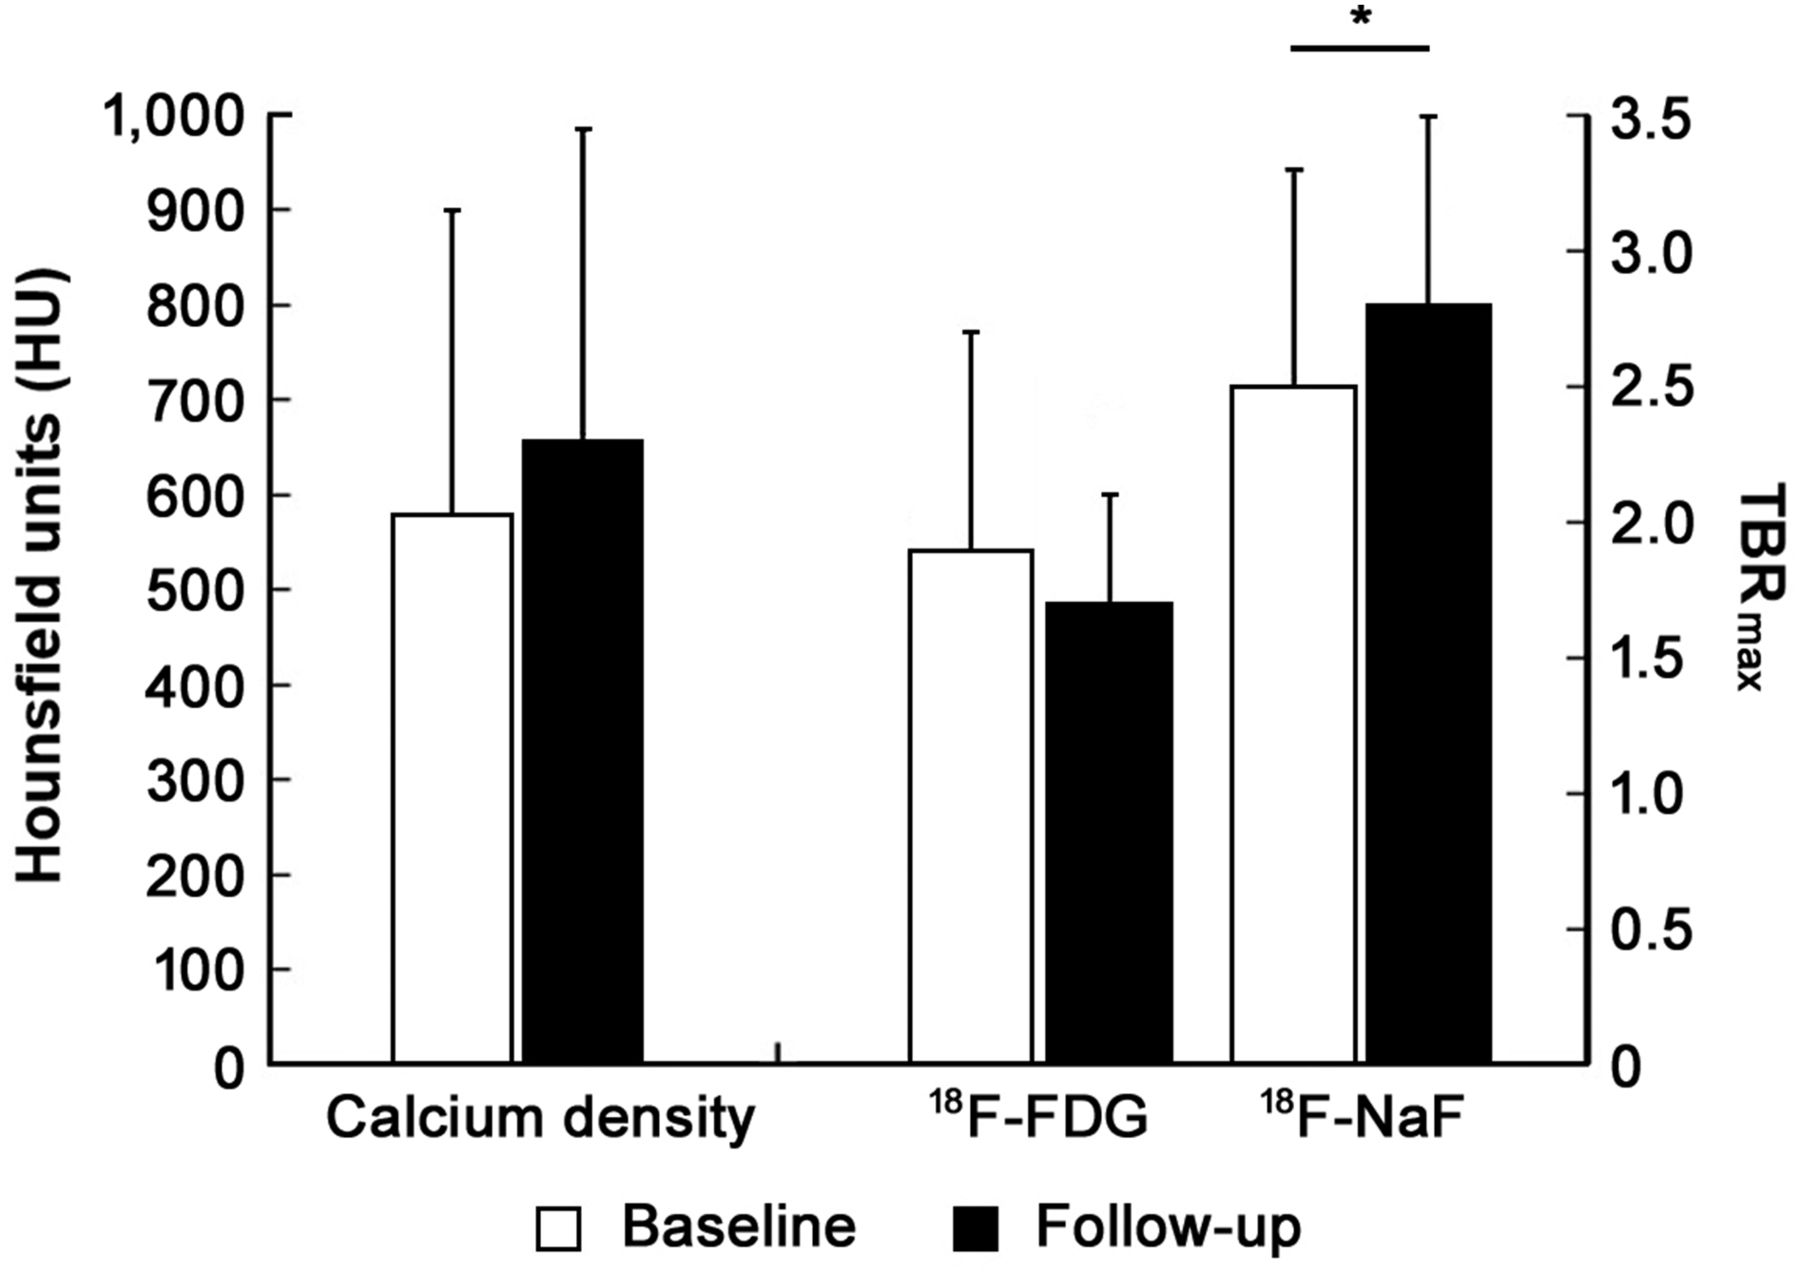
In the plaque progression study of the 19 patients who were scanned twice (98 lesions), the mean calcium density increased from 580 ± 320 HU (baseline) to 657 ± 328 HU (follow-up) (P = 0.07) (Fig. 3). At the same time, plaque osteogenic activity, as measured by 18F-NaF uptake (mean TBRmax), significantly increased from 2.5 ± 0.8 (baseline) to 2.8 ± 0.7 (follow-up) (P < 0.05). In contrast, there was a nonsignificant trend of decreasing inflammatory activity, as determined by the mean TBRmax for 18F-FDG (from 1.9 ± 0.8 at baseline to 1.7 ± 0.4 at follow-up; P = 0.25) (Fig. 3). Representative 18F-FDG and 18F-NaF PET/CT images of patients who had different types of lesions are shown in Figure 4.

Analysis of progression from baseline to follow-up (n = 19) for calcium density and uptake ratios of both tracers. Asterisk indicates significant difference (P < 0.05).
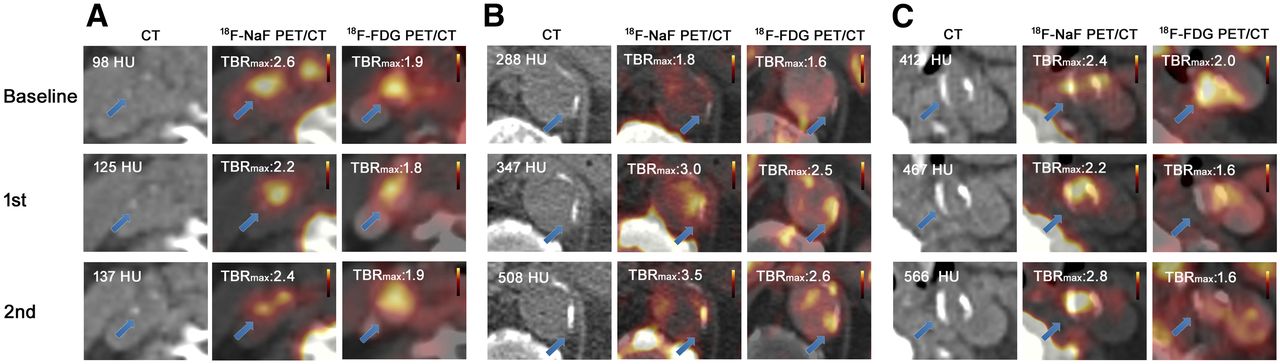
Transaxial 18F-NaF PET/CT images of arterial noncalcified, mildly calcified, and severely calcified lesions from 3 representative myeloma patients at baseline and at 2 follow-up scans. (A) In noncalcified lesions, 18F-NaF accumulation in carotid plaque was colocalized with 18F-FDG accumulation. Progressive carotid arterial calcium accumulation with enhanced 18F-NaF uptake and 18F-FDG uptake was detected. (B) In mildly calcified lesions, after progressive arterial calcium accumulation, 18F-NaF uptake progressed intensively from baseline to follow-up scan along with progressed 18F-FDG uptake. (C) Dense calcium composition was observed in severely calcified lesions, whereas the progressive 18F-NaF focal uptake ratio was coupled with regression of 18F-FDG uptake during plaque progression. Arrows indicate calcified lesions.
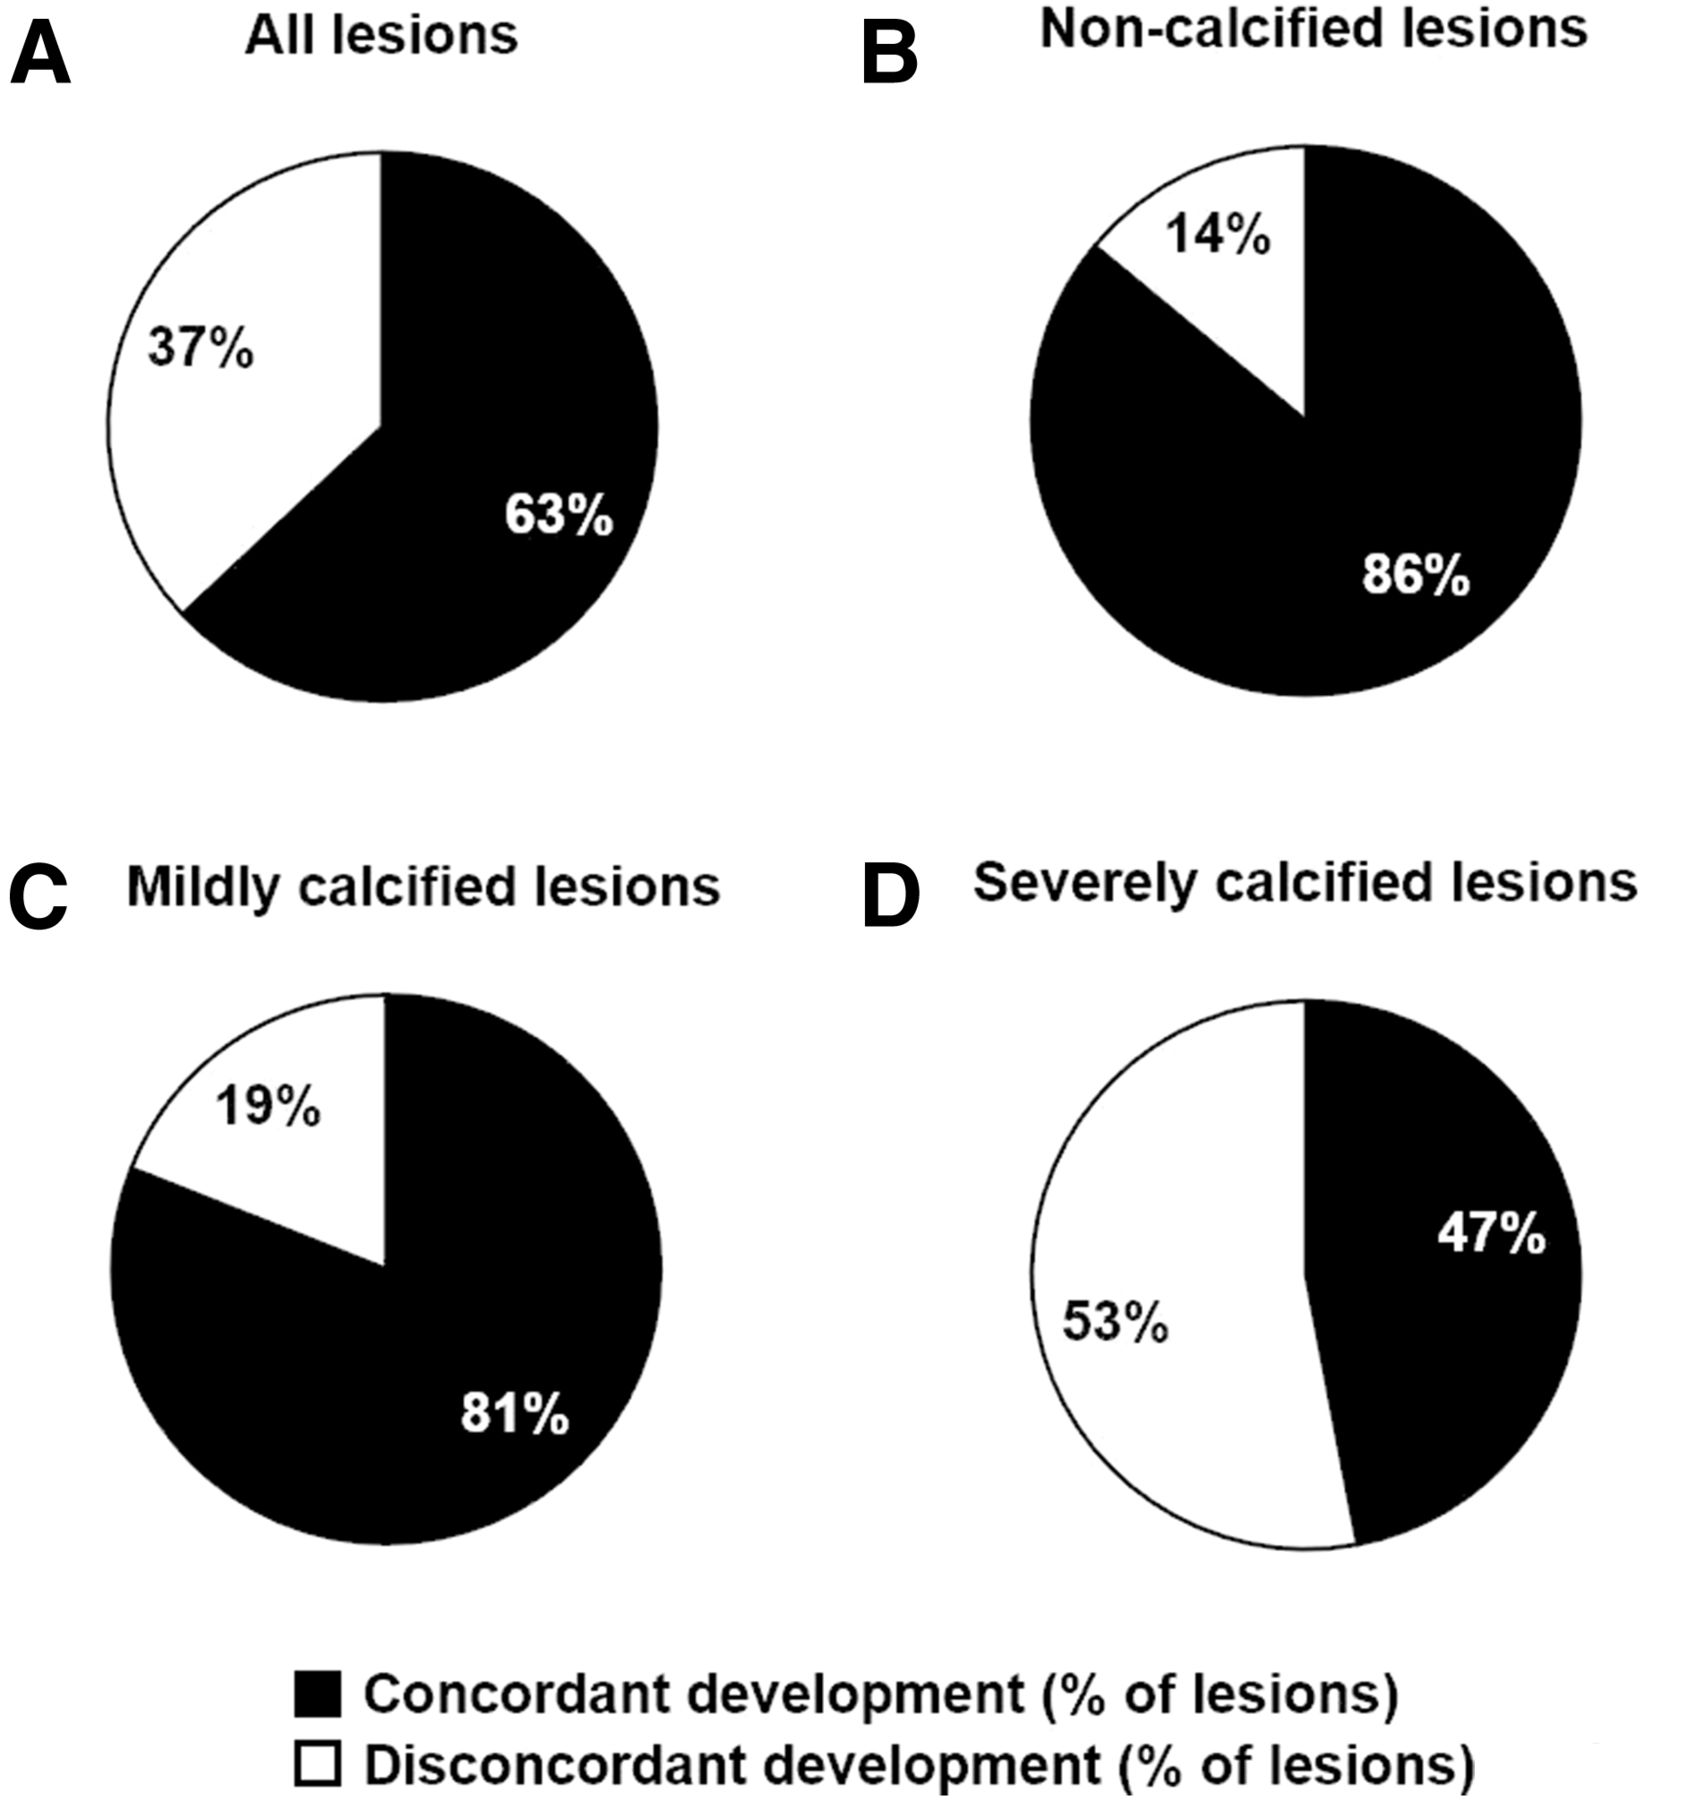
Comprehensive group assessments were performed on the basis of changes detected by both tracers between baseline and follow-up. Sixty-three percent of all lesions showed concordant changes from baseline to follow-up. Specifically, inflammation and osteogenesis progressed concordantly in 86% of noncalcified lesions and 81% of mildly calcified lesions; however, only 47% of severely calcified lesions exhibited coincident development during plaque progression (Fig. 5).

Concomitant development of inflammation and osteogenesis during disease progression. (A) Progression or regression developed concordantly in 63% of all lesions. (B and C) Most early noncalcified lesions (86%) (B) and mildly calcified lesions (81%) (C) showed concordant changes. (D) Only half of severely calcified lesions (47%) evolved in manner consistent with vascular inflammation and osteogenesis progression. These results suggested that relatively early atherosclerotic osteogenesis is determined by macrophage accumulation and that further intensive arterial osteogenesis might be associated with retardation of inflammation.
Antimyeloma Medical Therapy
Potential interactions with antitumor medications were investigated in the 19 patients who underwent both baseline and follow-up scans with the 2 tracers: 8 patients (42%) received zoledronic acid, and 4 patients (21%) received denosumab. In the zoledronic acid–treated group, the TBR for 18F-NaF increased (TBR at baseline [TBRbaseline] of 2.6 ± 0.8 vs. TBR at follow-up [TBRfollow-up] of 2.9 ± 0.7; P < 0.05), whereas the TBR for 18F-FDG decreased, but this change did not reach statistical significance (TBRbaseline of 2.0 ± 0.9 vs. TBRfollow-up of 1.8 ± 0.4; P = 0.13). In the denosumab-treated group, the TBR for 18F-NaF increased (TBRbaseline of 2.1 ± 0.8 vs. TBRfollow-up of 2.8 ± 0.6; P < 0.01), whereas the TBR for 18F-FDG remained stable (TBRbaseline of 1.5 ± 0.4 vs. TBRfollow-up of 1.6 ± 0.3; P = 0.64).
In the 7 patients who did not receive zoledronic acid or denosumab treatment, the TBR remained stable for both tracers (for 18F-NaF: TBRbaseline of 2.7 ± 0.9 vs. TBRfollow-up of 2.8 ± 0.8 [P = 0.61]; for 18F-FDG: TBRbaseline of 1.8 ± 0.4 vs. TBRfollow-up of 1.8 ± 0.4 [P = 0.39]).
DISCUSSION
In the present study, we investigated the interplay between inflammatory activity and osteogenesis, as determined by 18F-FDG and 18F-NaF, in atherosclerotic lesions with different degrees of calcification, as determined by CT. At the molecular level, hydroxyapatite emerges intensively on the crystallization surface, fluoride ions interact with the hydroxyapatite by ion exchange with hydroxyl groups, and the uptake of 18F-NaF directly reflects osteogenic activity (13). This process is dependent on the density of hydroxyapatite, as well as the exposed surface of calcification in the vasculature. The Agatston score is a semiquantitative method for calculating the extent of coronary artery calcification, and thresholds of 130 and 400 HU have been empirically set to define the presence of calcification and the presence of severe calcification, respectively (17,22). Thus, to evaluate the arterial calcium extent in the present study, we used a kindred semiquantitative evaluation system, which considered calcium density, to classify groups with different calcification severities (Table 2).
In the present study, higher TBRmax were calculated for 18F-NaF PET than for 18F-FDG PET in the same lesions at baseline, a result that is in accordance with the results of a study by Derlin et al. (23). In the group assessment, increased uptake of 18F-NaF, an indicator of activated/enhanced osteogenesis, was detected in early atherosclerotic lesions with an undetectable calcium composition and in advanced calcified lesions (Fig. 2). This finding is in agreement with the findings of previously published research, which demonstrated osteogenic activity at an early stage of atherosclerosis—when mineralization was stimulated by macrophage infiltration/activation—as well as at a later, activated stage—when calcification was induced by both vascular apoptosis and continued macrophage activation (13,24). In other words, a high macrophage burden and dense vascular calcification might occur in calcified segments at different stages.
In early erosive plaques, inflammatory mediators and elevated lipid content within atherosclerotic lesions induce osteogenic differentiation from immune cells and smooth muscle cells (25); during the subsequent progression of disease, continuous macrophage infiltration precedes osteogenic activity and increased mineralization, in which the apoptosis of lipid-laden macrophages induces calcium deposition in smooth muscle cells (26). Moreover, in late atherosclerotic plaques, continued development of vascular inflammation might also induce osteogenesis and drive the plaque to be at risk of rupture (13).
In the present study, we observed increased vascular osteogenesis and subsequent progressive calcification along with reduced inflammation, as detected by 18F-NaF and 18F-FDG PET/CT (Fig. 3). In subgroup analyses, noncalcified and mildly calcified lesions during the relatively early progression of atherosclerotic calcification revealed that most lesions proceeded in a manner consistent with osteogenic and inflammatory processes. However, there was discordant regulation of these 2 processes during the development of most advanced calcified lesions (Fig. 5). This result also suggested that early atherosclerotic osteogenesis is determined by macrophage accumulation and that further intensive progression of arterial calcification might be associated with reduced inflammation. In a novel view, the association between biomechanical stress and plaque pathophysiology suggests that calcification more likely occurs at the fibrous cap of plaques, leading to an increased risk of plaque ruptures (27).
There was no increased uptake of 18F-NaF in severely calcified lesions, and 18F-NaF uptake did not correlate well with calcium density on CT. This finding could be explained by the fact that 18F-NaF uptake is closely associated with the density of on-site hydroxyapatite, which is deposited on the crystal surface and, thus, does not necessarily reflect the overall calcium density of lesions. Furthermore, vascular calcifications have different pathophysiologies and structures in different arteries, according to hemodynamics and shear stress. Aikawa et al. reported increased osteogenic activity accompanied by an intensive macrophage burden at arterial sites with the greatest amount of mechanical stress (24). They also demonstrated that inflammation and osteogenesis evolved in close proximity and overlapped at border regions and suggested that plaque ruptures might occur in these adjacent areas. These overlapping sites with high mechanical stress might induce an acute proinflammatory response and, thus, subsequent enhanced osteogenesis; this notion suggests that increased 18F-NaF uptake at a specific anatomic site serves as a surrogate marker for activated atherosclerotic calcification, not intact calcification.
Another reason for the underestimation of 18F-NaF uptake could be the occurrence of partial-volume effects in small, calcified lesions. Dynamic attachment of tracers under distinct flow conditions and the active formation volume of the hydroxyapatite on the crystal surface could also affect 18F-NaF uptake ratios.
Several lines of evidence have suggested that arterial calcifications share features with bone because the metabolism of arterial calcifications is indistinguishable from that of bone lesions, and arterial osteogenesis shows similarities to new bone formation and development (7,9). Bone remodeling consists of the resorption of aged bone components and new bone formation (28). We presumed that the components of calcium salts change dynamically during bone progression. Thus, we also inferred that the activity of the osteogenesis-related calcium salt, hydroxyapatite, might vary on the surface of mineralization during calcification development.
18F-NaF and 18F-FDG PET/CT might provide distinct insights into atherosclerosis progression by providing information on ongoing osteogenesis and inflammation in different phases of atherosclerosis independently. On the other hand, coronary 18F-FDG uptake is frequently obscured by physiologic myocardial uptake, so that 18F-NaF is increasingly being used for coronary artery imaging; increased osteogenesis was recently demonstrated by 18F-NaF to be associated with cardiac events during follow-up (13). Although both 18F-NaF and 18F-FDG have strengths and limitations in the evaluation of inflammatory atherosclerosis, the combination of these techniques—together with morphologic allocation or characterization by CT or MRI—could improve diagnostic and, in particular, prognostic accuracy.
We also observed significantly increased 18F-NaF uptake ratios over time when antitumor medications (zoledronic acid and denosumab) were used in myeloma patients. Zoledronic acid closely resembles pyrophosphate compounds and inhibits hydroxyapatite breakdown, thereby effectively suppressing bone resorption (29). Denosumab is able to slow down bone resorption by interacting with osteoclast cells and enables the formation of bone components (30,31). However, because of the relatively small number of patients investigated, the influence of these antitumor drugs on atherosclerosis progression and, in particular, on calcification development remains unclear. Nevertheless, the present study might provide a flexible method for assessing the effectiveness of antiplaque medical therapy in the context of prospective clinical trials.
The limitations of this retrospective analysis must be considered. First, no histologic analyses were available as a reference; however, it was previously shown that specific 18F-NaF uptake colocalized with active calcification, as determined by histology, as well as macrophage infiltration, apoptosis, and necrosis. Second, because pure noncalcified plaques are difficult to identify on noncontrast CT scans, these types of plaques might have been underrepresented. Third, we cannot exclude the influence of anticancer medical therapies or the hormone response of myeloma. Especially for patients who take immunomodulatory drugs, such as lenalidomide, interference between drugs and tracer uptake might influence the accuracy and reproducibility of results. It is clear from our data that further prospective, methodologic studies with larger samples are needed to address the prognostic value of 18F-NaF focal uptake and the association between atherosclerotic inflammation and osteogenesis.
CONCLUSION
Both 18F-FDG PET and 18F-NaF PET revealed distinct accumulation of the tracers during the progression of calcified plaques, but the accumulation reflected different pathophysiologic processes of atherosclerosis. The combination of 18F-NaF PET and 18F-FDG PET might improve the noninvasive identification and characterization of vulnerable plaques.
DISCLOSURE
No potential conflict of interest relevant to this article was reported.
Acknowledgments
We thank the team of technologists for their constant helpfulness and patient management as well as their engagement in 18F-FDG radiotracer synthesis. Furthermore, Andreas Krcal is acknowledged for his help with 18F-NaF radiopreparations.
Footnotes
↵* Contributed equally to this work.
Published online Feb. 23, 2017.
- © 2017 by the Society of Nuclear Medicine and Molecular Imaging.
REFERENCES
- Received for publication August 18, 2016.
- Accepted for publication October 25, 2016.


