


Abstract
Atherosclerosis imaging with 18F-FDG PET is useful for tracking inflammation within plaque and monitoring the response to drug therapy. Short-term reproducibility of this technique in peripheral artery disease has not been assessed, and the optimal method of 18F-FDG quantification is still debated. We imaged 20 patients with vascular disease using 18F-FDG PET twice, 14 d apart, and used these data to assess reproducibility measures and compare 2 methods of 18F-FDG uptake measurement. We also reviewed the literature on quantification methods to determine the optimal measures of arterial 18F-FDG uptake for future studies. Methods: Twenty patients with vascular disease underwent PET/CT of the iliac, femoral, and carotid arteries 90 min after 18F-FDG administration. In 19 patients, repeat testing was performed at 2 wk. Coregistration and attenuation correction were performed with CT. Vessel 18F-FDG uptake was measured as both the mean and maximum blood-normalized standardized uptake value (SUV), known as the target-to-background ratio (TBR). We assessed interscan, interobserver, and intraobserver agreement. Results: Nineteen patients completed both imaging sessions. The carotid and peripheral arteries all have excellent short-term reproducibility of the 18F-FDG signal, with intraclass correlation coefficients all greater than 0.8 for all measures of reproducibility. Both mean and maximum TBR measurements for quantifying 18F-FDG uptake are equally reproducible. 18F-FDG uptake was significantly higher in the carotid arteries than in both iliac and femoral vessels (P < 0.001 for both). Conclusion: We found that both mean and maximum TBR in the carotid, iliac, and femoral arteries were highly reproducible. We suggest the mean TBR be used for tracking systemic arterial therapies, whereas the maximum TBR is optimal for detecting and monitoring local, plaque-based therapy.
Worldwide mortality and morbidity from vascular disease is increasing. The need for novel drugs to halt disease progression and induce regression is urgent. Patients with atherosclerotic peripheral vascular disease have a high incidence of both stroke and acute coronary syndrome (1).
Epidemiologic and basic science studies have shown that an individual patient's risk of future clinical events can be approximated from risk-factor scores such as Framingham (2). However, the detection of subclinical atherosclerosis by imaging can help to refine risk estimates (3,4). Serial monitoring of therapy response during proof-of-concept studies can give an early readout of treatment efficacy, potentially saving the time and cost of continued drug development for therapies that fail during large-scale confirmatory and outcome studies.
The biggest driver for plaque destabilization and clinical adverse events is inflammation (5), which occurs devastatingly within the protective fibrous cap of the plaque, where it promotes rupture by enzymatic degradation of the structural integrity of the cap. Although current imaging technologies are able to quantify the extent of disease in terms of luminal obstruction and visualization of some plaque elements, 18F-FDG PET offers a unique noninvasive measure of plaque inflammation. This is because 18F-FDG is retained within plaque macrophages more avidly than within other plaque elements (6).
Before being used to track changes in plaque inflammation over time and after therapy, however, the reproducibility of the technique has to be tested. We reported good reproducibility recently in a small group of patients that underwent carotid artery and aortic imaging, with high inter- and intraobserver agreement and low variability of 18F-FDG uptake over 2 wk (7).
In the current study, we prospectively imaged for, what is to our knowledge, the first time the iliac and femoral arteries with 18F-FDG PET and determined near-term reproducibility in those arterial beds. Novel interventions for peripheral artery disease are becoming available, and the need to highlight inflamed symptomatic lesions is important (8,9). We also present a larger cohort of patients than has been previously studied, who underwent carotid imaging twice over 2 wk, and determine reproducibility statistics for this group. In addition, we compare the reproducibility of 2 different methods of measurement of plaque 18F-FDG uptake and suggest optimal quantification protocols for future drug trials using 18F-FDG PET of atherosclerosis.
MATERIALS AND METHODS
Study Population
To generate widely applicable reproducibility statistics and SD values, we prospectively recruited a heterogeneous group of 20 patients with established or suspected vascular disease (defined as a previous myocardial infarction, stroke, or transient ischemic attack [TIA]; a history of a coronary revascularization procedure; or multiple risk factors for coronary artery disease) from within the Mount Sinai Medical Center. A sample size of 20 patients was calculated using an expected intraclass correlation coefficient (ICC) of 0.7 or greater, with the half-width of the confidence interval equal to 0.3. All patients gave written informed consent, and the study was approved by the Institutional Review Board of the Mount Sinai School of Medicine.
PET/CT
A total of 20 patients was recruited, and 19 completed carotid and leg PET/CT on 2 occasions, 2 wk apart (scan 1 and scan 2). Patient 20 withdrew from the study after the first PET scan because of intercurrent illness. Only the results for the 19 patients who completed both scans are presented. For the final 12 of the 20 patients, the protocol was amended to add femoral artery PET to the existing iliac and carotid protocol.
Imaging was performed using a 16-slice PET/CT scanner (Lightspeed; GE Healthcare), with a 15.5-cm field of view, after patients had fasted for at least 8 h. Blood glucose was checked by finger-stick measurement before 18F-FDG injection. Patients with a prescan glucose level of 200 mg/dL or more were excluded from the study. 18F-FDG (500–600 MBq) was injected intravenously, and patients rested in a quiet room for 90 min. Leg artery imaging was performed first, starting with a 30-s low-dose CT transmission scan (140 kV, 80 mA, 4.25-mm slice thickness) used for localization and attenuation correction. The umbilicus was the upper limit of the scan (approximately coinciding with the aortic bifurcation), which covered 3 bed positions inferiorly. There was a 10-min acquisition in each bed position in 2-dimensional mode. The final 12 patients underwent a modified protocol, which added femoral (down to the knee level) PET/CT to the preexisting carotid and iliac PET/CT. The protocol was achieved by increasing the scan coverage to 4 bed positions (10 min each), with the inferior border of the scan being the patella.
Carotid artery imaging was performed immediately after leg imaging. Patients were placed into a soft head holder, and after another low-dose CT scan, a single–bed-position carotid PET scan was performed in 3-dimensional mode for 15 min. The external auditory meatus was the upper limit of the scan.
Image Reconstruction
The 2-dimensional leg PET data were reconstructed using the ordered-subset expectation maximization algorithm (10) with 2 iterations (28 subsets, with corrections applied for normalization, dead time, random events, scatter, attenuation, and sensitivity), yielding a final voxel size of 4.25 mm. The 3-dimensional carotid PET data had the same corrections applied and were reconstructed using a 3-dimensional reprojection algorithm (11), giving a voxel size of 4.25 mm.
Image Analysis
Image analysis was performed on a dedicated workstation (Xeleris 2.0; GE Healthcare). We used the CT images, dividing the arteries of the leg anatomically from the aortic bifurcation downward into the iliac and femoral arteries. The common and external iliac arteries were combined and treated together as “iliac artery”; similarly, the common femoral and superficial femoral arteries were amalgamated into the single label of “femoral artery.” The transition point between iliac and femoral arteries was the inguinal ligament. Carotid artery PET studies were also quantified by locating the artery using the non–contrast-enhanced CT images.
Arterial 18F-FDG uptake (as a measure of arterial inflammation) in the legs and neck was measured by drawing a region of interest (ROI) around the artery on every slice of the coregistered transaxial PET/CT images (Fig. 1). On each image slice, the mean and maximum standardized uptake values (SUVs) of 18F-FDG in the ROI (containing the arterial wall and the lumen) were calculated as the mean and maximum pixel activity. The SUV is the decay-corrected tissue concentration of 18F-FDG (in kBq/g), adjusted for injected 18F-FDG dose and body weight (in kBq/g), and is a well-recognized method for quantification of 18F-FDG PET data (12).
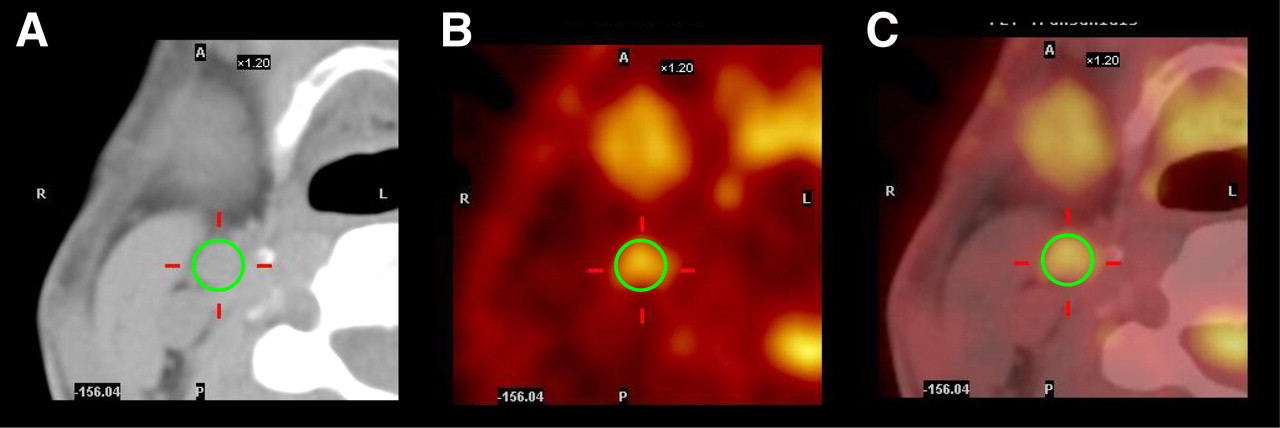
Example of image analysis on transaxial CT (A), PET (B), and fused PET/CT (C) images of right carotid artery. Circular ROI is drawn around right carotid artery on CT image. Data from this same ROI on PET image provides mean and maximum SUVs within defined ROI. For each arterial region, this analysis is repeated on all transaxial slices, averaged, and divided by venous SUV to obtain 1 average mean and average maximum TBR, respectively.
By averaging SUVs for all artery slices within an arterial territory, we derived mean and maximum SUVs for each region. These SUVs were normalized to blood 18F-FDG activity by division by an average blood ROI (at least 8 venous ROI measurements), estimated from either the inferior vena cava (leg studies) or the jugular vein (carotid studies). This calculation resulted in an arterial TBR measure, which is reported subsequently.
Approximately 240 slices of PET data for each leg study (120 each for left and right) and a total of 36 slices for each carotid study were read.
Assessing Interscan and Intra- and Interobserver Reproducibility
One reader analyzed both studies (scan 1 and scan 2) in every patient. Additionally, intraobserver agreement was assessed. Scan 1 studies of the 19 patients completing the 2 imaging time points were reread by the same reader about 4 wk after the first reading. Interobserver agreement was also assessed by a second experienced reader after the 2 readers had coread several pilot studies (not included in this study) and established a standard protocol for analysis. All image analyses were performed in a masked manner, with studies presented for reading in a random order.
Statistical Methods
Continuous variables are expressed as mean ± SD. Paired, 2-sided Student t tests were used to check for differences between mean values of continuous variables. P values of less than 0.05 were considered statistically significant. Left and right iliac, femoral, and carotid arteries were treated as individual measurements rather than as one measurement averaged together.
ICCs (13) with 95% confidence intervals were calculated to test the interscan variability (1-way random effects model with absolute agreement), and also to assess interobserver (2-way mixed effects model with absolute agreement) and intraobserver agreement (1-way random effects model with absolute agreement), after the methods of McGraw and Wong (14). An ICC value of 1 indicates perfect agreement, with random or systematic differences between the 2 measurements decreasing the value of the ICC. Generally, ICC values greater than 0.8 are accepted as a measure of excellent reproducibility (13).
Bland–Altman plots (15,16), with their corresponding limits of agreement, were drawn to check interobserver, intraobserver, and interscan variability. This visual method allows one to judge agreement across a range of values for continuous variables such as TBR and can highlight systematic measurement bias. The plots consisted of the mean measurement difference plotted against the mean of the 2 measurements. The limit of agreement lines was also calculated and plotted, representing the mean ± 2 SDs of the measurement difference. Statistical analyses were performed using analysis software (SPSS version 14; SPSS Inc.).
RESULTS
Patient Characteristics
The 20 recruited patients had a mean age of 64.9 ± 8.1 y and included 6 women. Patients were clinically stable and asymptomatic when imaged. All had previously documented vascular disease (2 with previous TIAs, 16 with angiographically documented coronary artery disease with prior coronary revascularization, and 2 with prior myocardial infarction) or multiple risk factors for disease (2 patients). Twenty-five percent of the patients had type 2 diabetes.
Imaging Parameters
The mean injected dose of 18F-FDG was not significantly different between scan 1 and scan 2 (mean for scan 1, 567 ± 55 MBq, and mean for scan 2, 596 ± 74 MBq; P = 0.17). PET of the legs commenced on average 104 ± 16 min after 18F-FDG injection, and this commencement time was not significantly different between scans (mean for scan 1, 102 ± 14 min, and mean for scan 2, 106 ± 18 min; P = 0.41). Similarly, the mean start time for carotid imaging was 148 ± 18 min after injection, with no significant difference between scans (mean for scan 1, 146 ± 18 min, and mean for scan 2, 149 ± 18 min; P = 0.60). Prescan glucose levels did not change significantly between scans: 104.2 ± 24.3 mg/dL at scan 1 and 102.4 ± 24.5 mg/dL at scan 2; P = 0.82. Although patients' medical records were not obtained, no patient reported any change in symptoms or medications over the 2 wk between imaging sessions.
Mean and maximum TBR uptake values for leg and carotid arteries are shown in Figure 2. The carotid arteries had significantly higher mean and maximum TBR values than did the iliac and femoral arteries at both time points (scan 1 data, mean TBR: P < 0.001 for left carotid vs. left iliac artery and P < 0.001 for left carotid vs. left femoral artery; scan 1 data, maximum TBR: P < 0.001 for left carotid vs. left iliac artery and P < 0.001 for left carotid vs. left femoral artery).
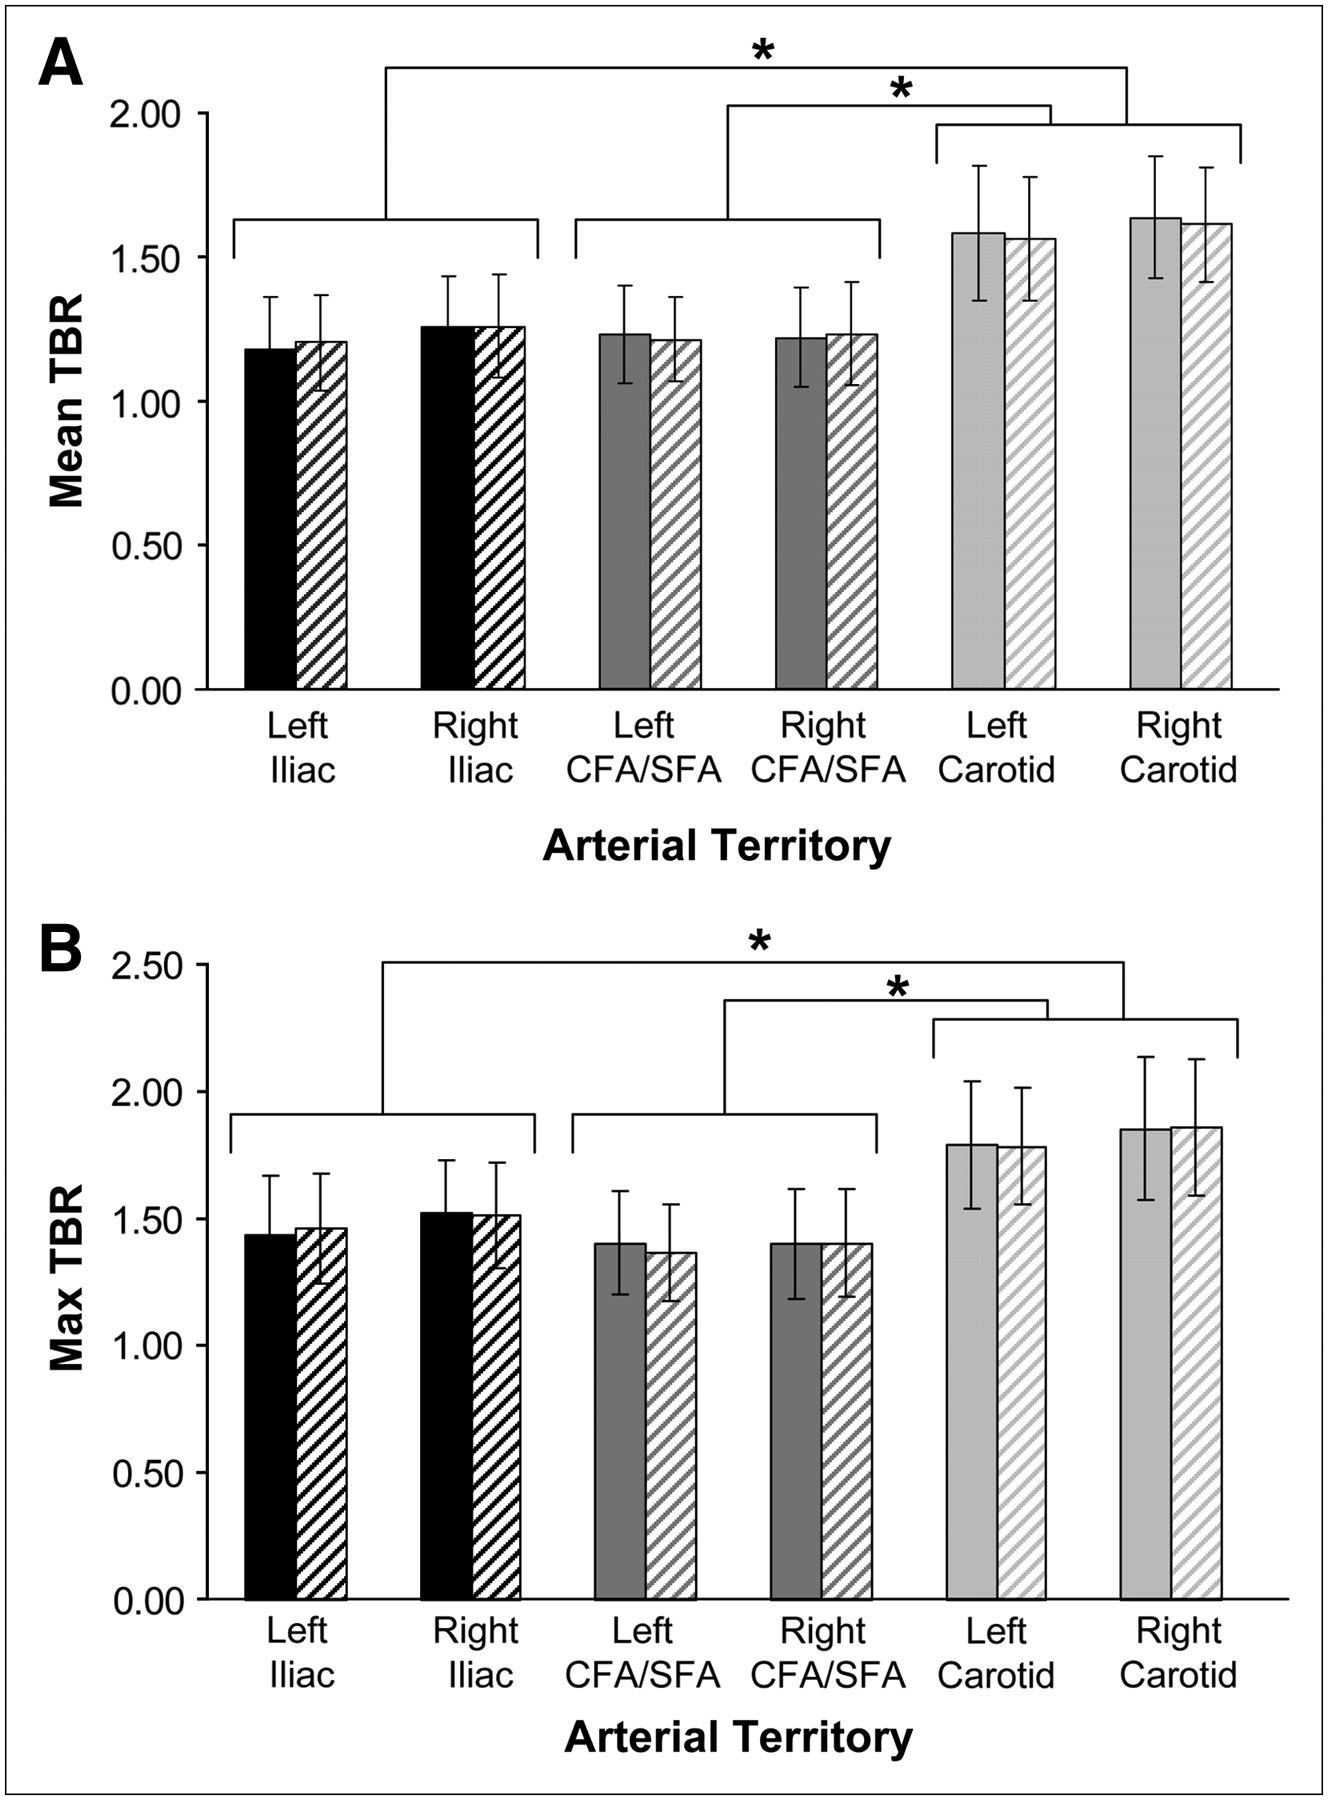
Mean (A) and maximum (B) TBR values for each arterial region at day 1 (solid bars) and day 14 (hatched bars). Error bars represent SD values. Within each arterial region, there was no significant difference between TBR values measured at day 1 vs. day 14 for either mean or maximum TBR. At both time points and for both mean and maximum TBR methodologies, TBR in each carotid artery was significantly higher than TBR for iliac and femoral arteries on same side (P < 0.001 for all). CFA = common femoral artery; SFA = superficial femoral artery. *P < 0.001.
Figure 2 also demonstrates no significant change in 18F-FDG signal over the 2-wk period between scans. Figure 3 shows representative images of peripheral artery imaging at day 1 and day 14, with visually little change in 18F-FDG accumulation between the 2 images.

Coronal CT (left), 18F-FDG PET (middle), and fused PET/CT (right) images of femoral artery territory at day 1 and day 14. Scans were separated by 2 wk. Note little change in amount of 18F-FDG uptake in femoral artery between 2 scans. Arrows on 18F-FDG PET images highlight femoral artery 18F-FDG accumulation.
Tables 1 and 2 show the intraclass correlation coefficients, along with their 95% confidence intervals for interobserver, intraobserver, and interscan variability. ICC values calculated for mean TBR are shown in Table 1, and maximum TBR ICC values are shown in Table 2. All mean TBR ICC values are greater than 0.8, with narrow confidence intervals. When maximum TBR is used, the result is an improvement in all measures of reproducibility in the femoral territory, with minor, nonsignificant reductions in the iliac and carotid territories. The carotid territory, as demonstrated by previous studies (7), scores high in interobserver agreement, and the TBR level is stable over 2 wk. The femoral artery, which is simple to trace on PET/CT and therefore easy to accurately define for ROI placement, also performs well. For the iliac artery, measures were uniformly good, a surprising result because of its tortuous course within the pelvis.
ICC Values Using Mean TBR Measurements
ICC Values Using Maximum TBR Measurements
We constructed Bland–Altman plots to visually examine the reproducibility statistics. Right and left arteries were considered separately, so plots were constructed for interobserver, intraobserver, and interscan agreement for each right and left arterial territory (a total of 18 plots). Examples for both mean and maximum TBR Bland–Altman plots are shown in Figures 4 and 5. All plots displayed narrow scatter (defined by most data points lying within 2 SDs of the mean difference in TBR) and confirmed the absence of systematic measurement bias. The range of the mean and maximum differences is plotted in the figures (between 0.12 and 0.17 for mean TBR measurements and between 0.16 and 0.20 for maximum TBR measures).
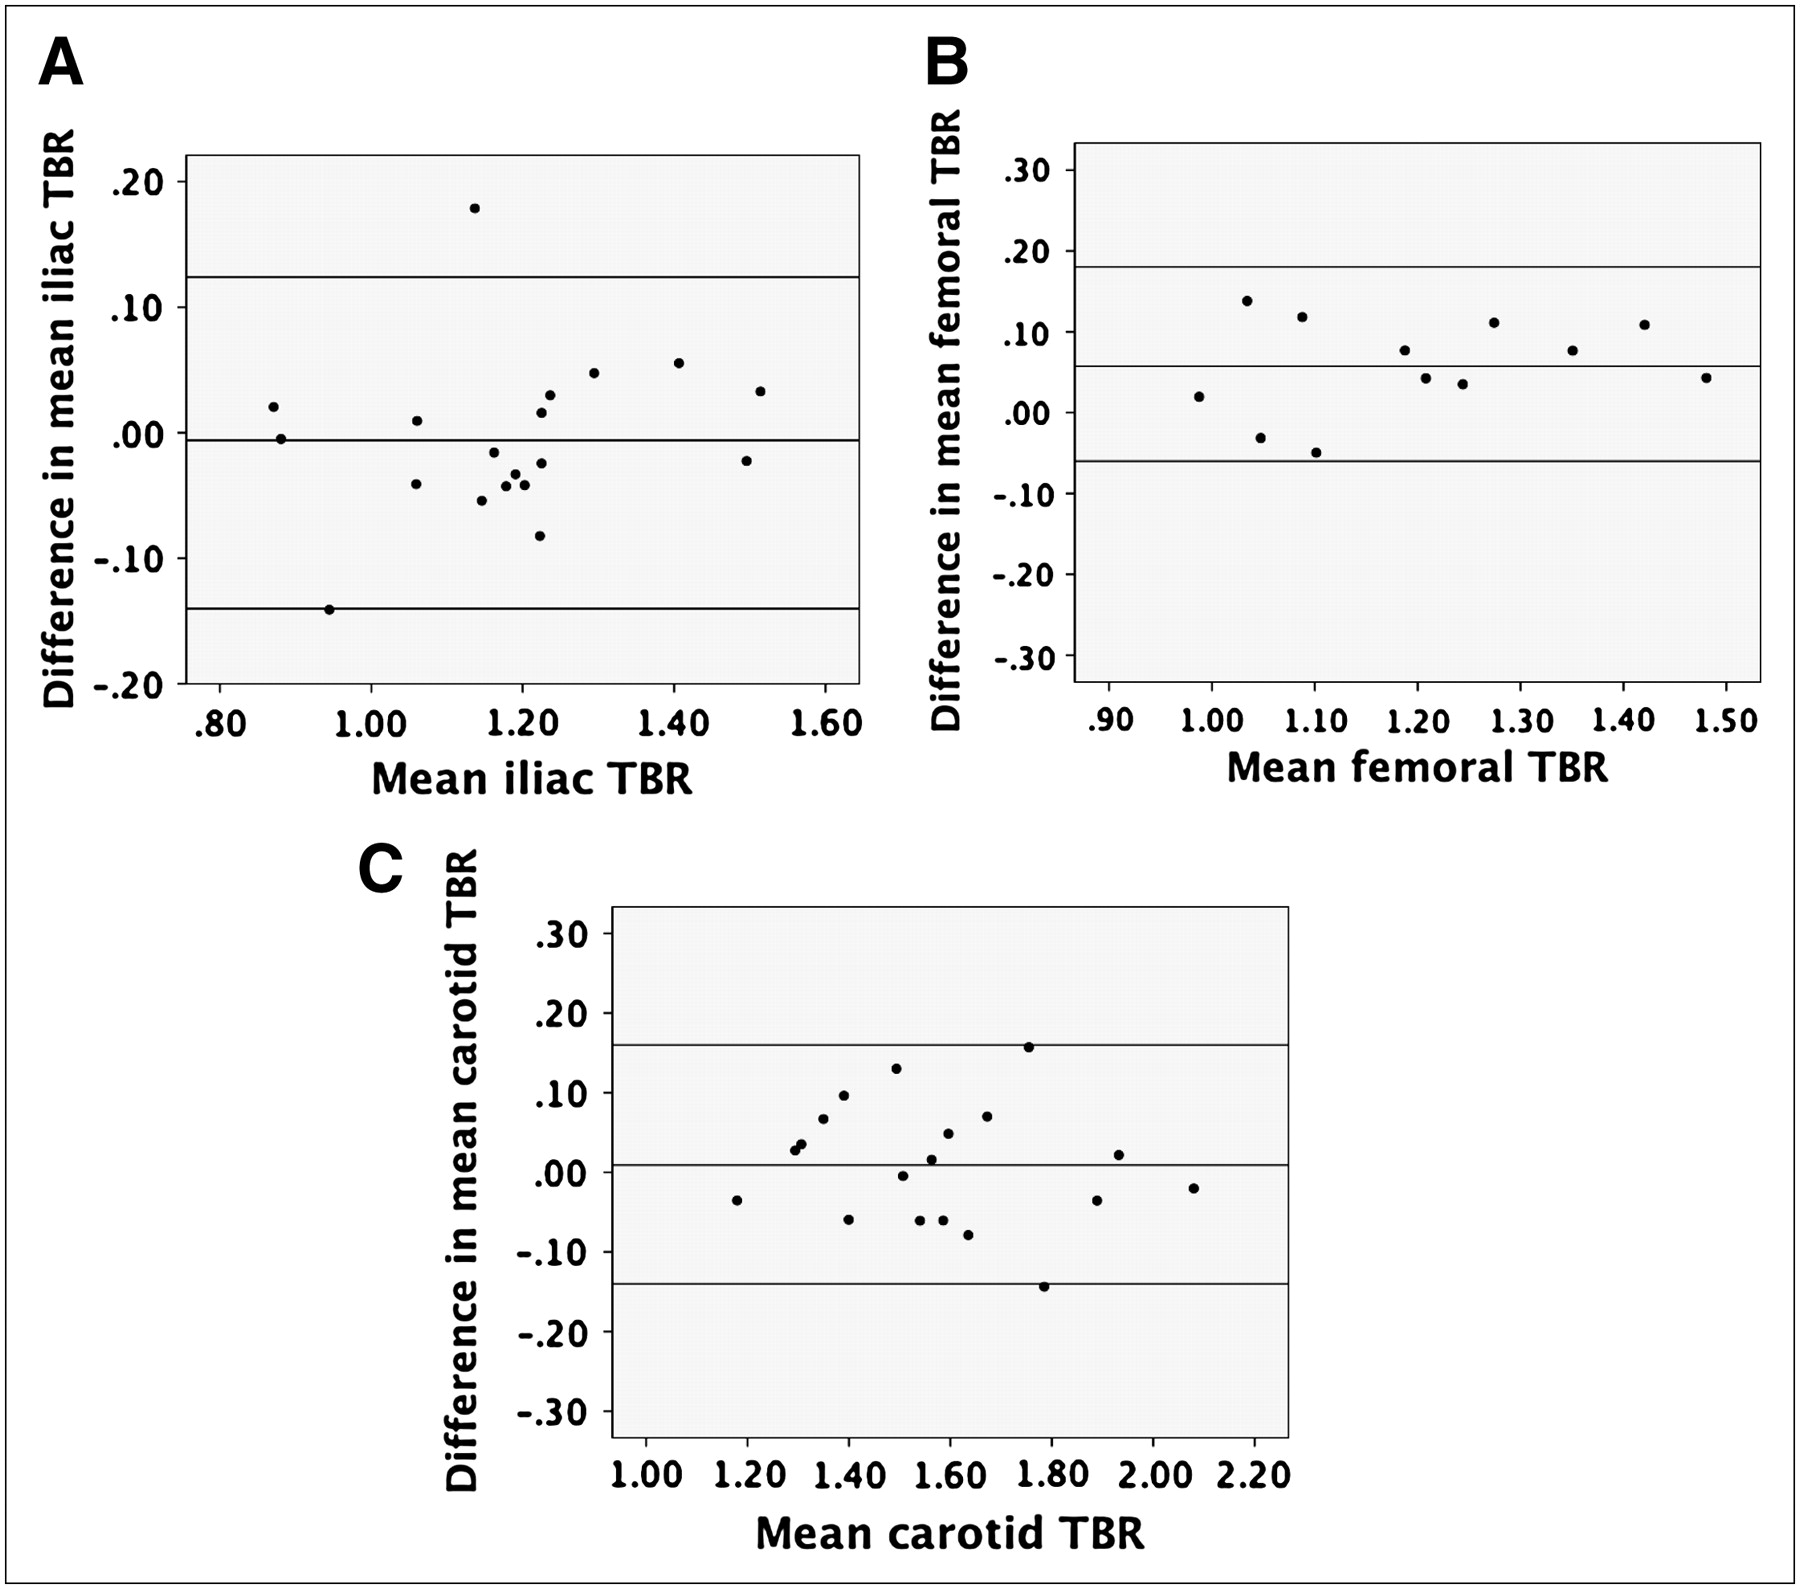
Examples of Bland–Altman plots showing interobserver agreement using mean TBR data in left iliac (A), femoral (B), and carotid (C) regions. Difference in TBR measurements between 2 observers does not vary depending on value of TBR, and observers almost always agreed within 2 SDs of measured difference, indicated by horizontal lines on each plot.
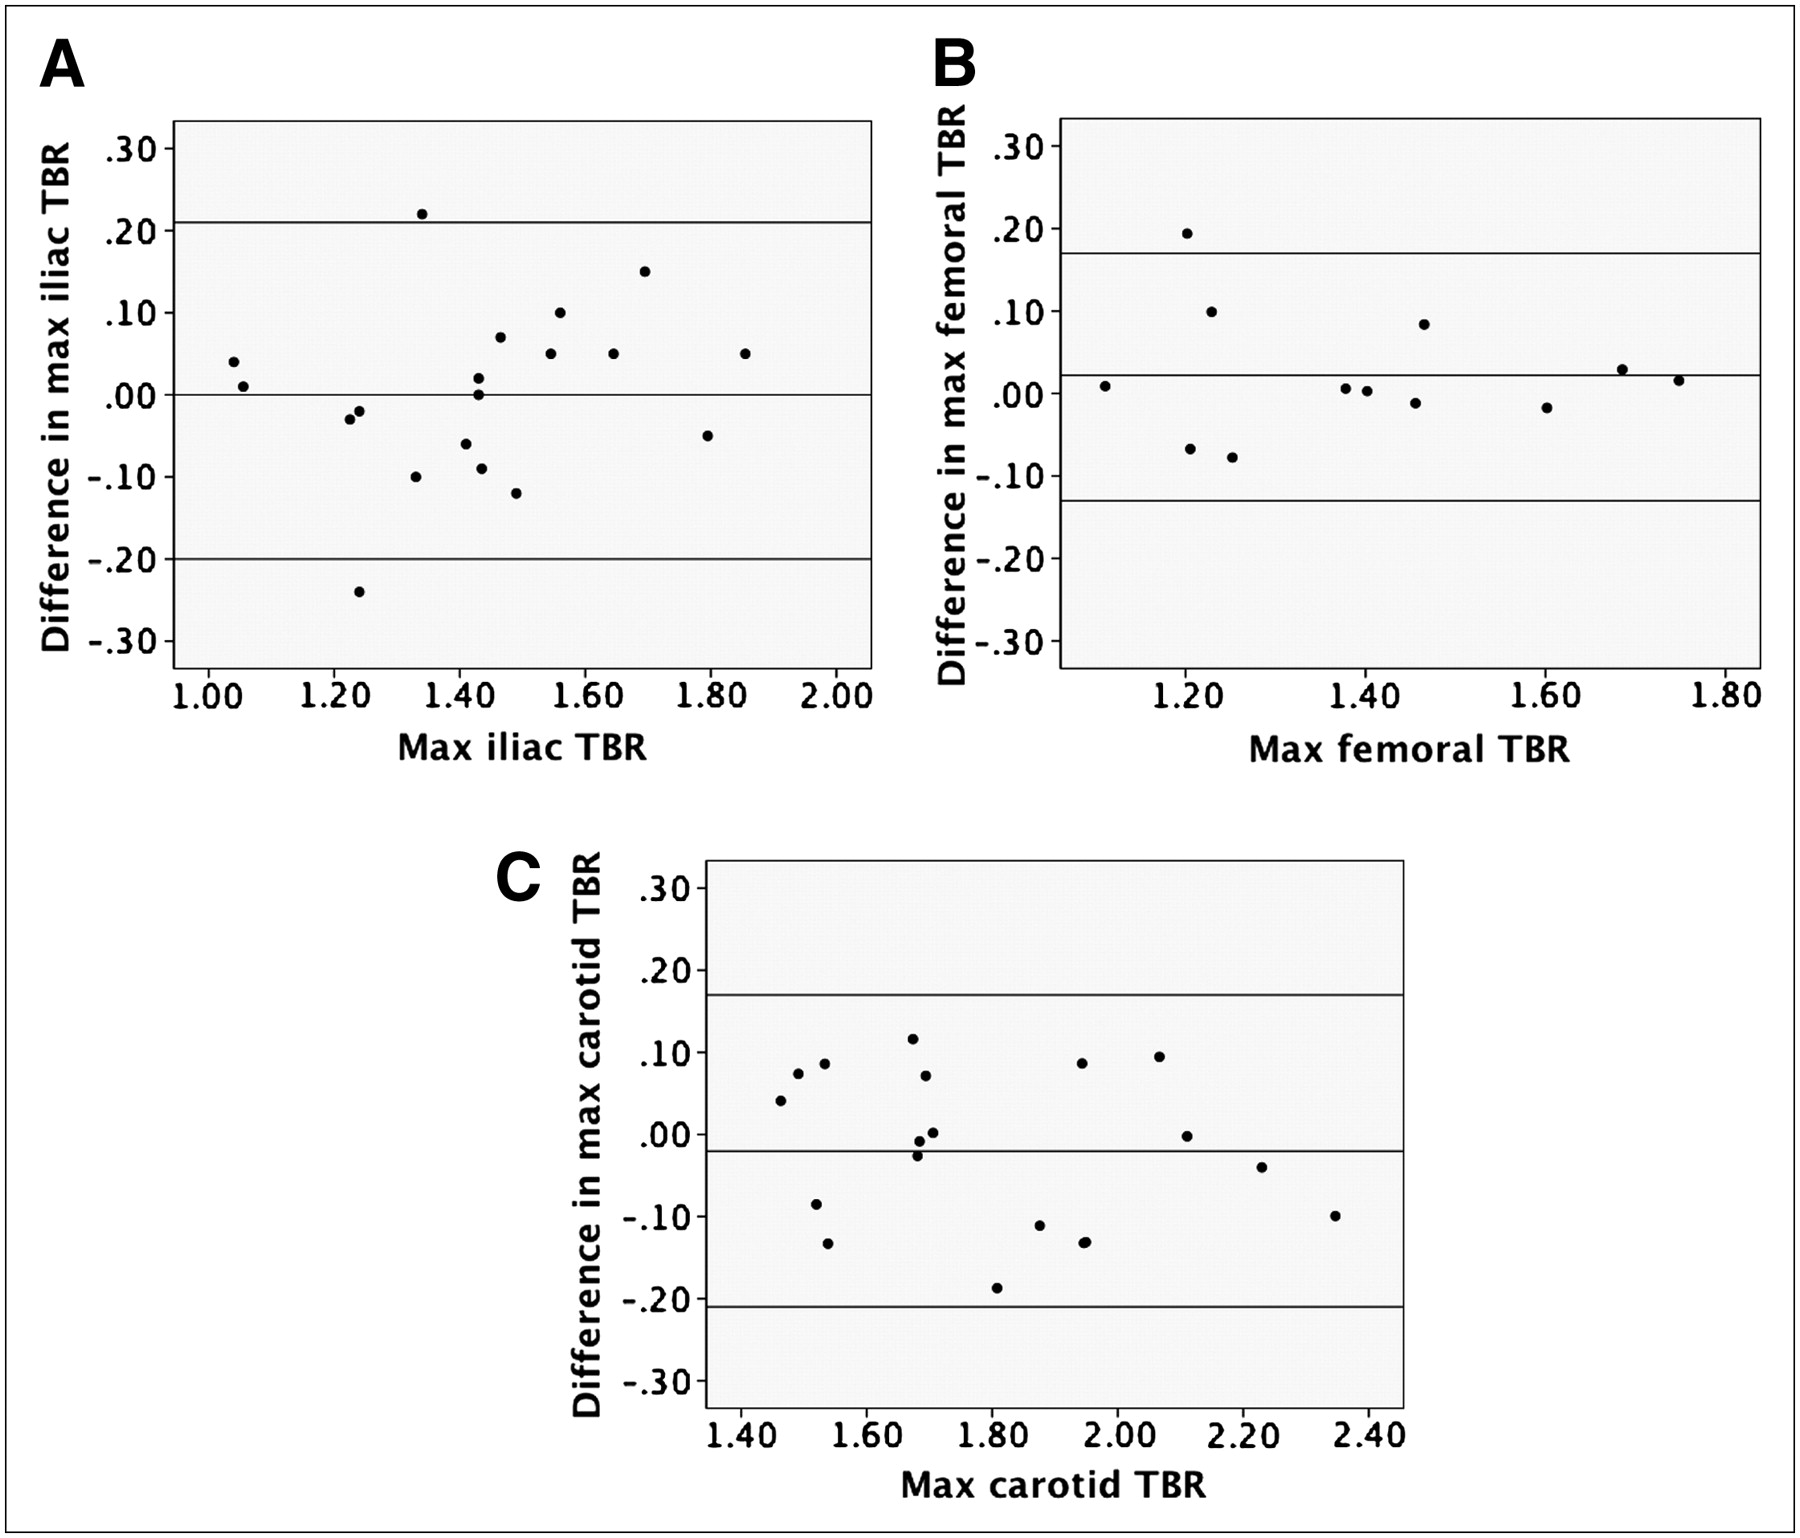
Examples of Bland–Altman plots showing interobserver agreement using maximum TBR data in left iliac (A), femoral (B), and carotid (C) regions. Difference in TBR measurements between 2 observers does not vary depending on value of TBR, and observers almost always agreed within 2 SDs of measured difference, indicated by horizontal lines on each plot. Max = maximum.
DISCUSSION
We have shown for, what is to our knowledge, the first time reproducible uptake of 18F-FDG within the arteries of the pelvis and legs and confirmed reproducible uptake in the carotid arteries, in a relatively large cohort of patients. Additionally, we have compared 2 methods of 18F-FDG uptake in this study, mean and maximum TBR, and have found that the 2 methods are approximately equally effective in terms of reproducibility.
Previously Published 18F-FDG PET Studies
Table 3 provides information on significant published studies of 18F-FDG PET for vascular imaging. The table highlights the wide range of choices that have been made by investigators on PET scan acquisition mode, 18F-FDG circulation time, and the decision to normalize the artery/plaque 18F-FDG signal to background structures.
Published Studies of 18F-FDG PET Atherosclerosis Imaging
The first attempt at atherosclerosis imaging with 18F-FDG PET used a stand-alone PET scanner along with contrast-enhanced CT for anatomic coregistration (17). Eight patients with TIA were imaged shortly after their index events. Significantly more 18F-FDG accumulated within symptomatic plaques than in the contralateral asymptomatic arteries. The cellular fate of 18F-FDG taken up by cells in the plaques was not clear, and so autoradiography using tritiated deoxyglucose was performed on excised plaques from the same group of symptomatic patients. This revealed that the majority of deoxyglucose was within plaque macrophages. The relationship between the degree of 18F-FDG uptake into plaque, clinical symptoms, macrophage burden, and level of serum inflammatory markers has recently been confirmed in much larger patient groups (6,18,19).
Animal studies also show strong positive correlations between 18F-FDG uptake and plaque macrophage burden. Several arterial beds have now been successfully imaged with 18F-FDG PET. These include the vertebral arteries (20), brachial and subclavian arteries (21), and all regions of the aorta (22,23) of patients with either established vascular disease or risk factors for it (24). One recent publication has even been able to localize 18F-FDG uptake to regions of the coronary arteries, suggesting possible uptake within coronary atherosclerosis (22), although this remains to be confirmed. Finally, 1 group has been able to track regression of atherosclerotic inflammation during statin therapy (25).
Recommendations for Future Studies
More uniform methodology is needed if atherosclerosis imaging with 18F-FDG PET is to be widely adopted. Because excellent reproducibility has been shown in the carotid arteries, the ascending aorta (7), and now the peripheral arteries, we suggest that an acquisition protocol similar to that published here and in previous papers (6,7) should be adopted. It appears from dynamic studies (20) that uptake of 18F-FDG occurs over a longer time course in arteries than in tumors, so a longer 18F-FDG circulation time is recommended, preferably at least 90 min. The use of combined PET/CT scanners is also desirable for several reasons, including ease of coregistration of the PET and CT images, faster scan times (a separate transmission scan is not required), and the wide availability of combined scanners as part of cancer-imaging programs (26).
We suggest that for trials of systemic therapies aimed at arterial inflammation (e.g., statin drugs), the mean TBR measurement across a substantial portion of the artery be used, as the drug effect is likely to be spread across the arterial bed. However, for testing therapies that act locally on the plaque, such as vulnerable plaque stent implantation or gene therapy, a more appropriate method might be to track the maximum TBR measurement within the localized disease segment over time. This recommendation is in line with a recent publication examining this issue in oncology (27).
Advancements in scanner hardware, such as time-of-flight imaging and high-definition PET, as well as the likely appearance in the marketplace of combined PET and MRI machines should improve quantification by straightforward partial-volume correction and lower both scan time and radiation dose. Further improvements in isolating the SUV measurement from the arterial wall, such that the ROI does not include the arterial lumen, might also improve accuracy.
Other Novel Imaging Approaches
Finally, 2 other noninvasive imaging techniques aimed at quantifying macrophage activity have also emerged over the last few years and deserve mention. Preclinical work suggests that macrophage-targeted CT contrast agents (28) may have a role in detecting and assessing novel drug treatments against the vulnerable plaque. This platform may allow coronary artery inflammation imaging, a goal that is currently out of reach of 18F-FDG PET. Human studies using high-resolution MRI with ultrasmall superparamagnetic iron oxide contrast have been shown to detect symptomatic plaque in the carotid territories of patients with recent TIA (29–31).
Both of these methods have advantages and disadvantages when compared with 18F-FDG PET of atherosclerosis, and a combination of different techniques for coronary, carotid, and aortic vascular beds is likely to be required.
CONCLUSION
18F-FDG PET of carotid and peripheral artery atherosclerosis is highly reproducible over 2 wk and between readers. We suggest the adoption of standardized imaging and analysis protocols to allow further testing of this novel technique in the assessment of drugs and devices aimed at the high-risk atherosclerotic plaque.
Acknowledgments
This work was funded by grants from the National Institutes of Health/National Heart, Lung and Blood (R01 HL71021, R01 HL78667) and by an unrestricted research grant from Merck Research Laboratories. One of the authors (KM) was supported by the Doris Duke Charitable Foundation, and another (JR) is supported by an International Fellowship from the British Heart Foundation.
Footnotes
-
↵* Contributed equally to this work.
-
COPYRIGHT © 2008 by the Society of Nuclear Medicine, Inc.
References
- Received for publication December 24, 2007.
- Accepted for publication February 28, 2008.


Jump to section
Related Articles
Cited By...
- Nuclear Cardiology Surrogate Biomarkers in Clinical Trials
- Imaging Inflammation Past, Present, and Future: Focus on Cardioimmunology
- Low-dose interleukin 2 for the reduction of vascular inflammation in acute coronary syndromes (IVORY): protocol and study rationale for a randomised, double-blind, placebo-controlled, phase II clinical trial
- Comparing Semiquantitative and Qualitative Methods of Vascular 18F-FDG PET Activity Measurement in Large-Vessel Vasculitis
- The Potential of PET in the Management of Peripheral Arterial Disease
- Small-Animal PET/CT Imaging of Local and Systemic Immune Response Using 64Cu-{alpha}CD11b
- Dynamic PET of Human Liver Inflammation: Impact of Kinetic Modeling with Optimization-Derived Dual-Blood Input Function
- Monocyte and Macrophage Dynamics in the Cardiovascular System: JACC Macrophage in CVD Series (Part 3)
- Effect of Vegan Fecal Microbiota Transplantation on Carnitine- and Choline-Derived Trimethylamine-N-Oxide Production and Vascular Inflammation in Patients With Metabolic Syndrome
- Etidronate for Prevention of Ectopic Mineralization in Patients With Pseudoxanthoma Elasticum
- Observations With Simultaneous 18F-FDG PET and MR Imaging in Peripheral Artery Disease
- Arterial and Cellular Inflammation in Patients with CKD
- Imaging the Cytokine Receptor CXCR4 in Atherosclerotic Plaques with the Radiotracer 68Ga-Pentixafor for PET
- Coronary Plaque Morphology and the Anti-Inflammatory Impact of Atorvastatin: A Multicenter 18F-Fluorodeoxyglucose Positron Emission Tomographic/Computed Tomographic Study
- Novel PET Imaging of Atherosclerosis with 68Ga-Labeled NOTA-Neomannosylated Human Serum Albumin
- Thresholds for Arterial Wall Inflammation Quantified by 18F-FDG PET Imaging: Implications for Vascular Interventional Studies
- Calcification and Inflammation in Atherosclerosis: Which Is the Chicken, and Which Is the Egg?
- The vulnerable atherosclerotic plaque: in vivo identification and potential therapeutic avenues
- Radiotracer Imaging of Peripheral Vascular Disease
- Evidence of Cyclic Changes in the Metabolism of Abdominal Aortic Aneurysms During Growth Phases: 18F-FDG PET Sequential Observational Study
- Scintillating Balloon-Enabled Fiber-Optic System for Radionuclide Imaging of Atherosclerotic Plaques
- Variability and Uncertainty of 18F-FDG PET Imaging Protocols for Assessing Inflammation in Atherosclerosis: Suggestions for Improvement
- Increased Microvascularization and Vessel Permeability Associate With Active Inflammation in Human Atheromata
- Varying Correlation Between 18F-Fluorodeoxyglucose Positron Emission Tomography and Dynamic Contrast-Enhanced MRI in Carotid Atherosclerosis: Implications for Plaque Inflammation
- Serum lipids associated with inflammation-related PET-FDG uptake in symptomatic carotid plaque
- PET/CT Imaging of Chemokine Receptor CCR5 in Vascular Injury Model Using Targeted Nanoparticle
- Development of 111In-Labeled Liposomes for Vulnerable Atherosclerotic Plaque Imaging
- Measurement of Arterial Activity on Routine FDG PET/CT Images Improves Prediction of Risk of Future CV Events
- Radiotracer Imaging of Peripheral Vascular Disease
- 18F-FDG Imaging of Carotid Arteries for Identifying the Vulnerable Patient: Are We at the Beginning of the End?
- The Advancing Clinical Impact of Molecular Imaging in CVD
- In Vivo Evaluation of Atherosclerotic Plaque Inflammation and of Anti-Inflammatory Effects of Statins by 18F-Fluorodeoxyglucose Positron Emission Tomography
- Bioenergetic Profiles Diverge During Macrophage Polarization: Implications for the Interpretation of 18F-FDG PET Imaging of Atherosclerosis
- Letter by Lensen et al Regarding Article, "Anti-Tumor Necrosis Factor-{alpha} Therapy Reduces Aortic Inflammation and Stiffness in Patients With Rheumatoid Arthritis"
- Determinants of Extraaortic Arterial 18F-FDG Accumulation in Asymptomatic Cohorts: Sex Differences in the Association with Cardiovascular Risk Factors and Coronary Artery Stenosis
- Familial Hypercholesterolemia and Atherosclerosis in Cloned Minipigs Created by DNA Transposition of a Human PCSK9 Gain-of-Function Mutant
- Subclinical Vasculitis as a Potential Mechanism to Explain the Heightened Cardiovascular Risk in Rheumatoid Arthritis
- Anti-Tumor Necrosis Factor-{alpha} Therapy Reduces Aortic Inflammation and Stiffness in Patients With Rheumatoid Arthritis
- Multimodality Imaging of Lower Extremity Peripheral Arterial Disease: Current Role and Future Directions
- Effects of p38 Mitogen-Activated Protein Kinase Inhibition on Vascular and Systemic Inflammation in Patients With Atherosclerosis
- Impact of Noninsulin-Dependent Type 2 Diabetes on Carotid Wall 18F-Fluorodeoxyglucose Positron Emission Tomography Uptake
- Cardiovascular Molecular Imaging: The Road Ahead
- Feasibility of [18F]-2-Fluoro-A85380-PET Imaging of Human Vascular Nicotinic Acetylcholine Receptors In Vivo
- Coronary Arterial 18F-Sodium Fluoride Uptake: A Novel Marker of Plaque Biology
- Assessment of Valvular Calcification and Inflammation by Positron Emission Tomography in Patients With Aortic Stenosis
- Correlation Between Arterial FDG Uptake and Biomarkers in Peripheral Artery Disease
- Feasibility of 11C-Acetate PET/CT for Imaging of Fatty Acid Synthesis in the Atherosclerotic Vessel Wall
- Investigating Vulnerable Atheroma Using Combined 18F-FDG PET/CT Angiography of Carotid Plaque with Immunohistochemical Validation
- Correlation of Inflammation Assessed by 18F-FDG PET, Active Mineral Deposition Assessed by 18F-Fluoride PET, and Vascular Calcification in Atherosclerotic Plaque: A Dual-Tracer PET/CT Study
- Vessel Wall Inflammation in Spontaneous Cervical Artery Dissection: A Prospective, Observational Positron Emission Tomography, Computed Tomography, and Magnetic Resonance Imaging Study
- Imaging the Vulnerable Plaque
- In Vivo Imaging of Mineral Deposition in Carotid Plaque Using 18F-Sodium Fluoride PET/CT: Correlation with Atherogenic Risk Factors
- Cardiovascular Molecular Imaging: Focus on Clinical Translation
- Vascular Inflammation Stratified by C-Reactive Protein and Low-Density Lipoprotein Cholesterol Levels: Analysis with 18F-FDG PET
- 2010 ACCF/AHA Guideline for Assessment of Cardiovascular Risk in Asymptomatic Adults: A Report of the American College of Cardiology Foundation/American Heart Association Task Force on Practice Guidelines
- 2010 ACCF/AHA Guideline for Assessment of Cardiovascular Risk in Asymptomatic Adults: A Report of the American College of Cardiology Foundation/American Heart Association Task Force on Practice Guidelines Developed in Collaboration With the American Society of Echocardiography, American Society of Nuclear Cardiology, Society of Atherosclerosis Imaging and Prevention, Society for Cardiovascular Angiography and Interventions, Society of Cardiovascular Computed Tomography, and Society for Cardiovascular Magnetic Resonance
- Carotid Plaque Inflammation Is Associated With Cerebral Microembolism in Patients With Recent Transient Ischemic Attack or Stroke: A Pilot Study
- Imaging of Vascular Inflammation With [11C]-PK11195 and Positron Emission Tomography/Computed Tomography Angiography
- Macrophage Fatty-acid Synthase Deficiency Decreases Diet-induced Atherosclerosis
- Watershed Infarcts in Transient Ischemic Attack/Minor Stroke With >=50% Carotid Stenosis: Hemodynamic or Embolic?
- Imaging Atherosclerotic Plaque Inflammation by Fluorodeoxyglucose With Positron Emission Tomography: Ready for Prime Time?
- The Role of 18F-FDG PET in Aortic Dissection
- Feasibility of FDG Imaging of the Coronary Arteries: Comparison Between Acute Coronary Syndrome and Stable Angina
- Vascular Inflammation in Patients With Impaired Glucose Tolerance and Type 2 Diabetes: Analysis With 18F-Fluorodeoxyglucose Positron Emission Tomography
- In Vivo Imaging of Macrophage Activity in the Coronary Arteries Using 68Ga-DOTATATE PET/CT: Correlation with Coronary Calcium Burden and Risk Factors
- Molecular Imaging of Atherosclerotic Plaque with 64Cu-Labeled Natriuretic Peptide and PET
- Inflammation in Atherosclerosis: From Pathophysiology to Practice
- Micro-Positron Emission Tomography in the Evaluation of Trypanosoma cruzi-Induced Heart Disease: Comparison with Other Modalities
- 18F-4V for PET-CT Imaging of VCAM-1 Expression in Atherosclerosis
- 18F-FDG PET/CT Identifies Patients at Risk for Future Vascular Events in an Otherwise Asymptomatic Cohort with Neoplastic Disease
- Hybrid In Vivo FMT-CT Imaging of Protease Activity in Atherosclerosis With Customized Nanosensors
- Vascular Imaging with 18F-FDG PET/CT: Optimal 18F-FDG Circulation Time?
- Inflammation Imaging in Atherosclerosis
- Evaluation of {alpha}v{beta}3 Integrin-Targeted Positron Emission Tomography Tracer 18F-Galacto-RGD for Imaging of Vascular Inflammation in Atherosclerotic Mice
- Vascular Inflammation Imaging with 18F-FDG PET/CT: When to Image?
- The Year in Atherothrombosis
- Relationships Among Regional Arterial Inflammation, Calcification, Risk Factors, and Biomarkers: A Prospective Fluorodeoxyglucose Positron-Emission Tomography/Computed Tomography Imaging Study
- The Year in Molecular Imaging
- Multimodality Cardiovascular Molecular Imaging, Part II