


Abstract
We prospectively investigated the ideal imaging time to measure vascular uptake after injection of 18F-FDG. Methods: A total of 17 patients with atherosclerotic abdominal aortic aneurysm underwent dynamic abdominal PET/CT using 2-min frames between 45 and 53, 57 and 65, 115 and 123, and 175 and 183 min after injection of 18F-FDG. For each period of dynamic imaging, vessel wall and lumen uptake were measured using the maximum standardized uptake value (SUVmax) and target-to-background ratio (TBR). Results: No significant difference in TBR across all time points (repeated measures ANOVA, P = 0.206) was observed, despite a significant difference in aortic wall and lumen uptake with time (repeated measures ANOVA, P = 0.02 and P < 0.001, respectively). There was no significant difference between aortic wall uptake at 60 min (SUVmax, 2.15 ± 0.11 SE) and 180 min (SUVmax, 1.99 ± 0.18 SE) (paired t test, P = 0.367). There was a significant difference in lumen uptake at 60 min (SUVmax, 2.4 ± 0.11 SE) and 180 min (SUVmax, 1.7 ± 0.1 SE) (paired t test, P = 0.001). There was no significant difference in TBR between 60 min (0.91 ± 0.03) and 180 min (1.01 ± 0.06 SE) (paired t test, P = 0.131). With increasing delayed imaging, there was increasing variability (SE) in the SUVmax for the aortic wall and TBRs. Conclusion: There was no significant advantage in imaging at 3 h over 1 h after 18F-FDG injection.
- PET/CT
- vascular
- radiotracer tissue kinetics
- 18F-FDG
- aneurysm
- atherosclerosis
- methodology
- positron emission tomography
PET with 18F-FDG has shown potential in the imaging of atheroma inflammation and instability in both the carotid artery and aorta (1–4). This original work has progressed, and 18F-FDG PET is being suggested for use in measuring the response to cardiovascular treatment and as a surrogate endpoint in clinical trials (5–9). However, a paucity of scientific evidence regarding the technical parameters of using PET in this way exists.
One important parameter is the circulation time of 18F-FDG. The 1-h time point is commonly used in oncology PET studies (10). However, some have advocated performing imaging at 3 h after the injection of 18F-FDG to maximize the contrast between plaque and background. The 3-h time point was derived from dynamic PET studies in patients with carotid disease (1). However, this time point was based on data from a PET-only system in which physical coregistration with CT was not possible, and data were from only 8 patients. Not all investigators have used this time point (Table 1), and more recently these same investigators have recommended at least a 90-min 18F-FDG circulation time (8). Therefore, there is a need for harmonization of scan parameters to enable comparison and collaboration between institutions offering vascular PET/CT.
Published Prospective Human Studies of 18F-FDG PET Atherosclerosis Imaging
To address this question of the ideal circulation time of 18F-FDG, we scanned patients with atherosclerotic abdominal aortic aneurysms. We performed PET/CT at 45, 60, 120, and 180 min after an injection of 18F-FDG. We investigated whether there were 18F-FDG uptake differences with time in the aortic wall and lumen of the aneurysms to determine the optimal time to image vascular inflammation using 18F-FDG PET/CT.
MATERIALS AND METHODS
Study Population
A total of 17 consecutive asymptomatic patients (16 men, 1 woman; mean age, 74 ± 5 y) undergoing routine surveillance for atherosclerotic abdominal aortic aneurysms enrolled in this prospective study. The clinical and laboratory characteristics of the study population are presented in Table 2. A total of 9 patients had hypercholesterolemia, 10 were receiving statins, and 9 had a smoking history. No patients had any renal impairment or any features of an inflammatory aneurysm (11). Institutional Ethics Board approval and informed consent were obtained.
Clinical Characteristics of Study Population
Image Acquisition
All patients fasted for 6 h. After an injection of 18F-FDG (200 MBq), we performed dynamic imaging using 2-min frames between 45 and 53, 57 and 65, 115 and 123, and 175 and 183 min with a combined PET/64-detector CT instrument (GE Healthcare). A CT scan of the patient's abdominal aorta was acquired using 64 × 3.75 mm detectors, a 1.5 pitch, and a 5-mm collimation (140 kVp and 80 mA in 0.8 s). An 18F-FDG PET emission scan was obtained while the patient's position was maintained; the scan covered an area identical to that covered by CT. All scans were acquired in 2-dimensional mode (8 min/bed position). Transaxial emission images, 3.27 mm thick (pixel size, 3.9 mm), were reconstructed using ordered-subsets expectation maximization with 2 iterations and 28 subsets. The axial field of view was 148.75 mm, resulting in 47 slices per bed position.
Image Analysis
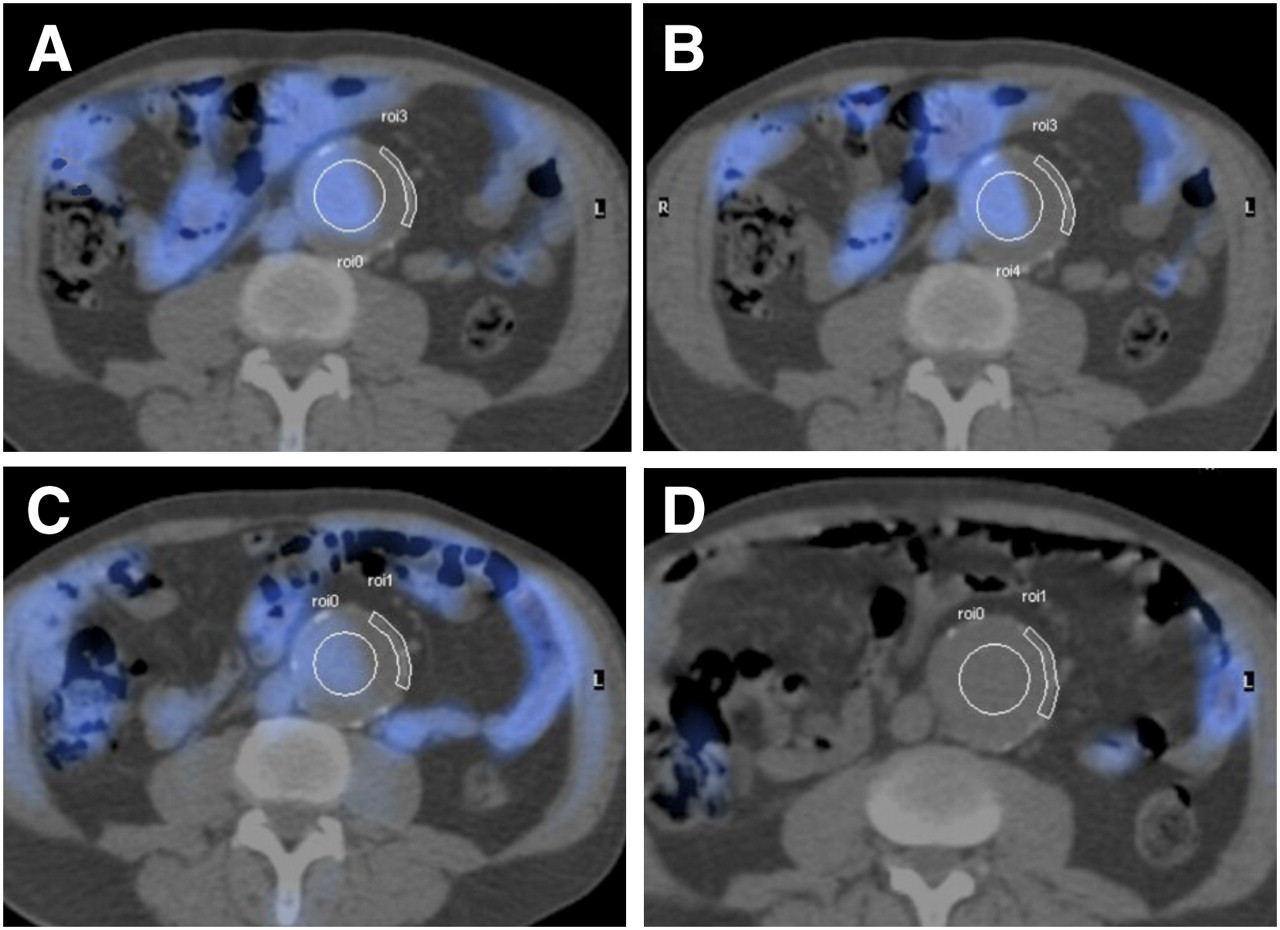
Coregistration and image analysis were performed using a Xeleris (GE Healthcare) workstation. PET/CT images were reviewed by a combined radiologist and nuclear medicine physician and a senior technologist in consensus. The area of most intense aortic wall 18F-FDG uptake was identified, and regions of interest (ROIs) were drawn over the abdominal aortic wall and lumen (Fig. 1). The maximum activity concentration for each region was recorded in each 2-min frame. For each period of dynamic imaging (four 2-min frames), the mean maximum activity concentration (corrected for decay) was recorded and converted to maximum standardized uptake value (SUVmax) normalized to body weight, calculated using the following formula: and the associated SE (SD/√4) was derived. This calculation was repeated in each of the 17 patients, and mean SUVmax for the aortic wall and lumen and their target-to-background ratio (TBR) were derived.

Fused axial PET/CT of ROIs applied to aortic aneurysmal wall and lumen at mid-point of dynamic acquisitions at 45 (A), 60 (B), 120 (C), and 180 min (D) after injection of 18F-FDG.
Statistical Analysis
After data were examined for normality using Kolmogorov–Smirnov testing, ANOVA of repeated measures was used in the comparison of uptake across all the 4 time points. A paired 2-tailed t test was used to compare differences between variables obtained at 1 and 3 h. Statistical significance was at 5%.
RESULTS
The mean aortic wall SUVmax at 45 min was 2.08, at 60 min it was 2.15, at 120 min it was 1.62, and at 180 min it was 1.99. The mean aortic lumen SUV max at 45 min was 2.30, at 60 min it was 2.40, at 120 min it was 1.74, and at 180 min it was 1.70. The mean wall-to-lumen ratio (TBR) at 45 min was 0.91, at 60 min it was 0.91, at 120 min it was 0.96, and at 190 min it was 1.01 (Table 3).
Data for SUVmax of Aortic Wall, Aortic Lumen, and TBR at Each Time Point After Injection of 18F-FDG
The SDs and SEs for aortic wall SUVmax and lumen SUVmax and TBRs at 45, 60, 120, and 180 min after injection of 18F-FDG are shown in Table 3.
A significant difference in aortic wall SUVmax and lumen SUVmax with time (repeated measures ANOVA, P = 0.02 and P < 0.001, respectively) and no significant difference in TBR with time (repeated measures ANOVA, P = 0.206) were observed.
At the 2 specific time points of interest, there was no significant difference between SUVmax at 60 and 180 min in the aortic wall (paired t test, P = 0.367). There was a significant difference in SUVmax in the lumen at 60 and 180 min (paired t test, P = 0.001). There was no significant difference in TBR SUVmax between 60 and 180 min (paired t test, P = 0.131).
DISCUSSION
We conducted a study in a series of 17 patients with abdominal aortic aneurysms, which are strongly associated with both local and systemic atherosclerosis (11), to determine the optimal time to image vascular inflammation using 18F-FDG PET/CT. Multiple–time point PET of arterial 18F-FDG uptake showed that delayed imaging at 3 h, compared with earlier imaging, does not significantly change the TBR. There was also no difference in aortic wall SUVmax at 1 h, compared with at 3 h. Blood-pool activity as measured by lumen SUVmax was significantly different at 1 and 3 h, but this did not affect the TBR.
Given that there is increasing use of 18F-FDG uptake to assess arterial inflammation and atheroma vulnerability and to monitor the effects of pharmacologic therapies (1–9), these findings are likely to be relevant to this emerging technique. In addition, showing that there is no significant advantage of delayed imaging could favorably impact clinical practice. The prior recommended imaging time of 3 h (1) that has been implemented by others (2) could limit the feasibility in some centers of performing future screening or drug monitoring using 18F-FDG PET. By imaging at 1 h, this should allow a better workflow for imaging departments and make the 18F-FDG PET examination more acceptable to the patient, which is an important factor for any test.
We have also shown that the measurement of 18F-FDG arterial wall uptake becomes more variable with delayed imaging, most probably because of the resulting decay of the tracer and the subsequent increase in image noise. Therefore, the possible benefits of delayed imaging are counterbalanced by the effects of image noise and more variable SUVmax measurements. Given the relatively subtle changes involved in the imaging of atherosclerotic lesions with 18F-FDG PET, such variability may negatively affect the findings if imaging is delayed.
Imaging at 2 h showed a decline in 18F-FDG arterial wall uptake, a finding that was replicated in all but 6 of our patients. Although it is hard to explain such an uptake pattern, this finding could raise concern about the recommended use of imaging at 90 min (8).
Although PET has exquisite sensitivity, it does have limited spatial resolution. Therefore, using this technique to examine the arterial wall is a challenge, and it can be difficult to accurately localize the site of uptake from PET. This is one of the reasons for choosing to examine the aorta in this study, rather than the smaller carotid arteries. The addition of CT when using a hybrid PET/CT camera for image acquisition enables the exploitation of the superior spatial resolution of CT and thus improves the anatomic certainty of the site of 18F-FDG uptake. In particular, the use of a hybrid system helps differentiate arterial wall uptake from uptake in adjacent structures such as the lumen, which should help in the placement of ROIs and reduction of partial-volume effects. The CT used for image fusion was unenhanced; therefore, the thrombus within the sac of the aneurysm may make identification of the lumen more difficult with unenhanced CT, compared with contrast-enhanced CT. The original arterial wall uptake data suggesting that 3 h was the best imaging time (1) were acquired from the carotid arteries using a standalone PET camera, and the findings of this study may have been influenced by these factors of poor spatial resolution, partial-volume effects, and inaccurate ROI localization.
There has been an inconsistent use of methodology when performing PET vascular studies (Table 1). Different investigators have used a variety of strategies in expressing arterial 18F-FDG uptake, including visual assessment, absolute SUVmax, SUV thresholds, and TBR. Likewise, there has been a variety of imaging times used, ranging from 45 min (9,12) to 3 h. These inconsistencies probably reflect multiple factors, including habit and the demand for camera availability (13). Therefore, as is being sought (8), there is a need for the uniformity of methodology for arterial 18F-FDG studies.
One recent vascular 18F-FDG PET study did obtain dual–time point imaging data (12). In this study, it was noted that the delayed images provided better lesion-to-background contrast during visual assessment. However, the pattern and location of 18F-FDG uptake could be identified on both early and delayed images in all patients with significant carotid stenosis. Moreover, because the 18F-FDG uptake on delayed images greatly decreased in the control subjects, making it difficult for ROI placement along the arterial wall, the 45-min images were used for SUV comparison.
In the current study, we performed dynamic imaging during certain time points; however, it would have been ideal to have obtained continuous dynamic images over 3 h. In practice, with elderly patients, continuous dynamic imaging may be difficult to achieve; moreover, the images would be at an increased risk of movement-induced artifacts. It would have been advantageous to have performed studies on more than the 17 patients studied. Nonetheless, such studies are time-intensive, and most of the present 18F-FDG PET arterial studies have used similar-sized or smaller study populations (Table 1).
CONCLUSION
Our prospective aortic wall PET data from 17 patients showed that there was no significant advantage in imaging at 3 h over 1 h after 18F-FDG injection. Given the increasing use of vascular 18F-FDG PET studies for risk stratification and treatment monitoring, this finding has implications for patient throughput and acceptability.
Acknowledgments
We thank Dr. Gareth Ambler, Biostatistician from Research and Development, UCL, for statistical advice. This work was funded in part by the Sussex Stroke and Circulation Fund and the Royal College of Radiologists. UCLH/UCL receives a proportion of funding from the Department of Health's NIHR Biomedical Research Centre's funding scheme.
Footnotes
-
COPYRIGHT © 2009 by the Society of Nuclear Medicine, Inc.
References
- Received for publication December 18, 2008.
- Accepted for publication February 27, 2009.


Jump to section
Related Articles
Cited By...
- PET Imaging of Abdominal Aortic Aneurysm with 64Cu-Labeled Anti-CD105 Antibody Fab Fragment
- A Randomized Trial on the Optimization of 18F-FDG Myocardial Uptake Suppression: Implications for Vulnerable Coronary Plaque Imaging
- Measurement of Arterial Activity on Routine FDG PET/CT Images Improves Prediction of Risk of Future CV Events
- Determinants of Extraaortic Arterial 18F-FDG Accumulation in Asymptomatic Cohorts: Sex Differences in the Association with Cardiovascular Risk Factors and Coronary Artery Stenosis
- Effects of p38 Mitogen-Activated Protein Kinase Inhibition on Vascular and Systemic Inflammation in Patients With Atherosclerosis
- Impact of Noninsulin-Dependent Type 2 Diabetes on Carotid Wall 18F-Fluorodeoxyglucose Positron Emission Tomography Uptake
- 18F-Fludeoxyglucose PET/CT in the evaluation of large-vessel vasculitis: diagnostic performance and correlation with clinical and laboratory parameters
- Investigating Vulnerable Atheroma Using Combined 18F-FDG PET/CT Angiography of Carotid Plaque with Immunohistochemical Validation
- In Vivo Imaging of Mineral Deposition in Carotid Plaque Using 18F-Sodium Fluoride PET/CT: Correlation with Atherogenic Risk Factors
- Imaging Atherosclerotic Plaque Inflammation by Fluorodeoxyglucose With Positron Emission Tomography: Ready for Prime Time?
- Feasibility of 18F-Sodium Fluoride PET/CT for Imaging of Atherosclerotic Plaque
- Vascular Imaging with 18F-FDG PET/CT: Optimal 18F-FDG Circulation Time?
- Reply: Vascular Imaging with 18F-FDG PET/CT: Optimal 18F-FDG Circulation Time?