


Abstract
18F-FDG PET/CT can be used to detect arterial atherosclerotic plaque inflammation. However, avid myocardial glucose uptake may preclude its use for visualizing coronary plaques. Fatty acid loading or calcium channel blockers could decrease myocardial 18F-FDG uptake, thus assisting coronary plaque inflammation identification. The present prospective randomized trial compared the efficacies of different interventions for suppressing myocardial 18F-FDG uptake. We also investigated whether circulating free fatty acid (cFFA) levels predicted the magnitude of myocardial 18F-FDG uptake. Methods: Thirty-six volunteers ate a high-fat low-carbohydrate meal, followed by a 12-h fasting period. They were then randomized to 1 of 4 intervention groups. Group 1 received no additional preparation and served as a reference. Groups 2 and 3, respectively, received a commercial high-fat solution containing 43.8 g of lipids or 50 mL of olive oil 1 h before 18F-FDG injection to evaluate the impact of fatty acid loading on myocardial 18F-FDG uptake. Group 4 received verapamil to evaluate the effect of calcium channel blockers. Cardiac PET/CT was performed after administration of 370 MBq of 18F-FDG. Myocardial uptake suppression was assessed using a qualitative visual scale and by measuring the myocardial maximum standardized uptake value (SUVmax). Insulin, glucose, and cFFA were serially measured. Results: The qualitative visual scale showed good myocardial 18F-FDG uptake suppression in 8 of 9, 5 of 9, 4 of 9, and 8 of 9 subjects of groups 1, 2, 3, and 4, respectively (P = 0.09). SUVmax did not significantly differ between groups (P = 0.17). Interestingly, cFFA levels were higher in volunteers with good suppression (0.80 ± 0.31 mmol/L) than in those with poor suppression (0.53 ± 0.15 mmol/L; P = 0.011). We found an inverse correlation between cFFA level (measured at 18F-FDG injection) and the SUVmax (R = 0.61). Receiver-operating-characteristic curve analysis identified 0.65 mmol/L cFFA as the best cutoff value to predict adequate 18F-FDG uptake suppression (positive predictive value, 89%). Conclusion: A high-fat low-carbohydrate meal followed by a 12-h fasting period effectively suppressed myocardial 18F-FDG uptake in most subjects. Neither complementary fatty acid loading nor verapamil administered 1 h before 18F-FDG injection conferred any additional benefit. Myocardial 18F-FDG uptake was inversely correlated with cFFA level, representing an interesting way to predict myocardial 18F-FDG uptake suppression.
Cardiovascular diseases are still a leading cause of mortality in western countries (1). The high mortality rate of cardiovascular diseases results from arterial thrombosis, which is often triggered by a ruptured plaque. Rupture-prone plaques—also called vulnerable plaques—exhibit typical features, among which inflammation is a key factor (2–4). Metabolically active cells, such as activated macrophages, take in and progressively accumulate 18F-FDG, which can then be imaged and quantified with PET. 18F-FDG is a well-validated tracer for imaging plaque inflammation in large arteries and aorta (5,6). However, coronary artery imaging is more challenging, mainly because of intense tracer uptake in adjacent myocardium.
The quantity and quality of substrate supply to the heart are determined by the dietary state. Long-chain free fatty acids (FFAs) are the major substrates for the heart. Under fasting conditions, FFAs are released from the adipose tissue, enter the circulation, and are taken up by cardiac cells. FFAs inhibit glycolysis, rerouting glucose toward glycogen synthesis. On the other hand, glycogen phosphorylase is the main regulator of glycogenolysis and is activated by phosphorylation, either by cyclic adenosine monophosphate–dependent protein kinase or by Ca2+-activated phosphorylase kinase (7). Intracellular calcium acts as a stimulus for cardiac glucose uptake. Accordingly, it has been demonstrated that high-fat low-carbohydrate (HFLC) dietary preparations can significantly reduce myocardial 18F-FDG uptake in oncologic patients (8–10), and calcium channel blockers (CCBs) may help to reduce myocardial 18F-FDG uptake in a murine model (11). However, randomized trials evaluating the impact of these interventions on reducing 18F-FDG uptake are lacking.
Also the optimal time point to perform PET acquisition after 18F-FDG injection remains poorly known. Preliminary studies evaluating 18F-FDG PET/CT as a method for coronary plaque inflammation imaging have performed PET at 3 h after 18F-FDG injection (12–14). On the other hand, studies evaluating the impact of dietary regimen on the quality of 18F-FDG uptake suppression have performed PET at 1 h after 18F-FDG injection (8,10). No data are available regarding the impact of the dietary regimen on 18F-FDG uptake at different time intervals.
The present prospective randomized study evaluated the impacts of different interventions—including complementary FFA loading and CCBs—on unwanted myocardial 18F-FDG uptake. We also sought to determine whether measuring insulin, glucose, or circulating FFA (cFFA) level could predict the amplitude of 18F-FDG uptake suppression. Finally, to clarify the most appropriate time point for imaging coronary plaque inflammation, we evaluated the impact of different interventions on the myocardial 18F-FDG signal at different time points.
MATERIALS AND METHODS
Study Population and Intervention Assignment
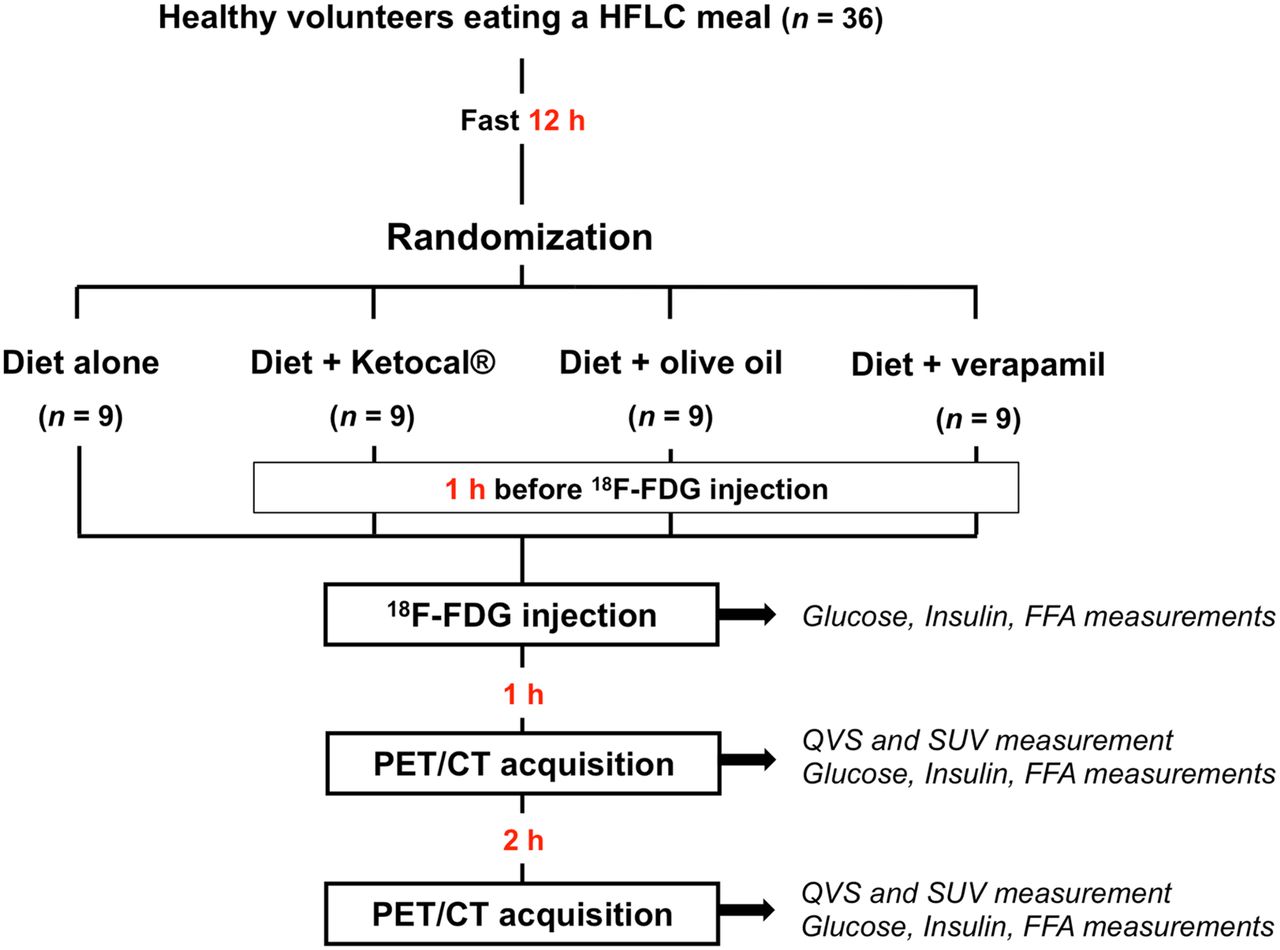
Thirty-six healthy volunteers were recruited among the paramedical staff of the hospital and were paid for their participation. They were instructed to eat an HFLC meal based on a list of appropriate and inappropriate food items (established by the dietetic department) and then to fast (water permitted) for 12 ± 1 h. A preimaging interview was systematically conducted to precisely check the composition of the meal ingested the evening before. The volunteers were then randomly assigned, by drawing lots, to 1 of the following 4 pre–18F-FDG PET/CT intervention plans (9 volunteers in each group). Group 1 did not receive any additional preparation to evaluate the effect of HFLC diet alone and served as a reference. Group 2 received a 250-mL liquid mixture containing a commercial high-fat solution (KetoCal; SHS International Ltd.)—comprising 43.8 g of fat (78% unsaturated), 1.8 g of carbohydrate, and 9.15 g of protein—at 60 min before 18F-FDG injection to evaluate the effect of complementary fatty acid loading on 18F-FDG uptake. Group 3 received 50 mL of olive oil (46 g of fat, without carbohydrate or protein) at 60 min before 18F-FDG injection to evaluate the effect of another form of complementary fatty acid loading on 18F-FDG uptake. Group 4 received 120 mg of verapamil (orally) at 60 min before 18F-FDG injection to evaluate the effect of CCBs on 18F-FDG uptake (Fig. 1). The volunteers were instructed to avoid exercise, alcohol, benzodiazepine, and caffeine for at least 24 h before the injection. Pregnancy was an exclusion criterion, and all female volunteers underwent urine pregnancy testing. All volunteers gave their written informed consent, and the study protocol was approved by the ethical committee of our institution.

Study protocol.
18F-FDG PET/CT Imaging Protocol
Imaging was performed at 60 and 180 min after intravenous administration of 370 MBq of 18F-FDG to evaluate the impact of the intervention on myocardial uptake at 2 different time intervals. Images were acquired using a Gemini PET/CT system (Philips Healthcare). The used equipment complied with the European Association of Nuclear Medicine Research Ltd. accreditation 18F-FDG PET/CT requirements for clinical research (15). The volunteers breathed normally while CT imaging was performed with a 16-slice multidetector scanner (adaptive dose in Z-DOM mode; voltage, 120 kV; rotation, 500 ms; pitch, 0.813). PET images (voxel size, 4 × 4 × 4 mm) were obtained in 3-dimensional mode from the neck to the liver, with 5 min per bed position, and were iteratively reconstructed (3-dimensional line of response time-of-flight algorithm; Philips) using CT-based attenuation correction and random and scatter corrections. The volunteers were kept in a quiet environment before and between the 2 imaging time points. The effective radiation dose from 18F-FDG was estimated at 7.1 ± 0.2 mSv, using ICRP publication 106 (0.019 mSv/MBq conversion factor) (16). The effective radiation dose from CT was 2.1 ± 1.0 mSv per procedure.
Image Analysis
Myocardial 18F-FDG uptake was assessed on 60- and 180-min images using a qualitative visual scale (QVS) based on the visual uptake categoric scale proposed by Williams and Kolodny (10). The qualitative visual estimation of 18F-FDG myocardial uptake was graded as follows: 0, homogeneously minimal; 1, mostly minimal or mild uptake; 2, mostly intense or moderate uptake; or 3, homogeneously intense (Fig. 2). QVS grades of 0 and 1 were considered good suppression, whereas QVS grades of 2 and 3 were considered poor suppression. To evaluate the interobserver reliability of the visual grading, images were graded by 2 independent investigators who were masked to the group assignment of each volunteer.
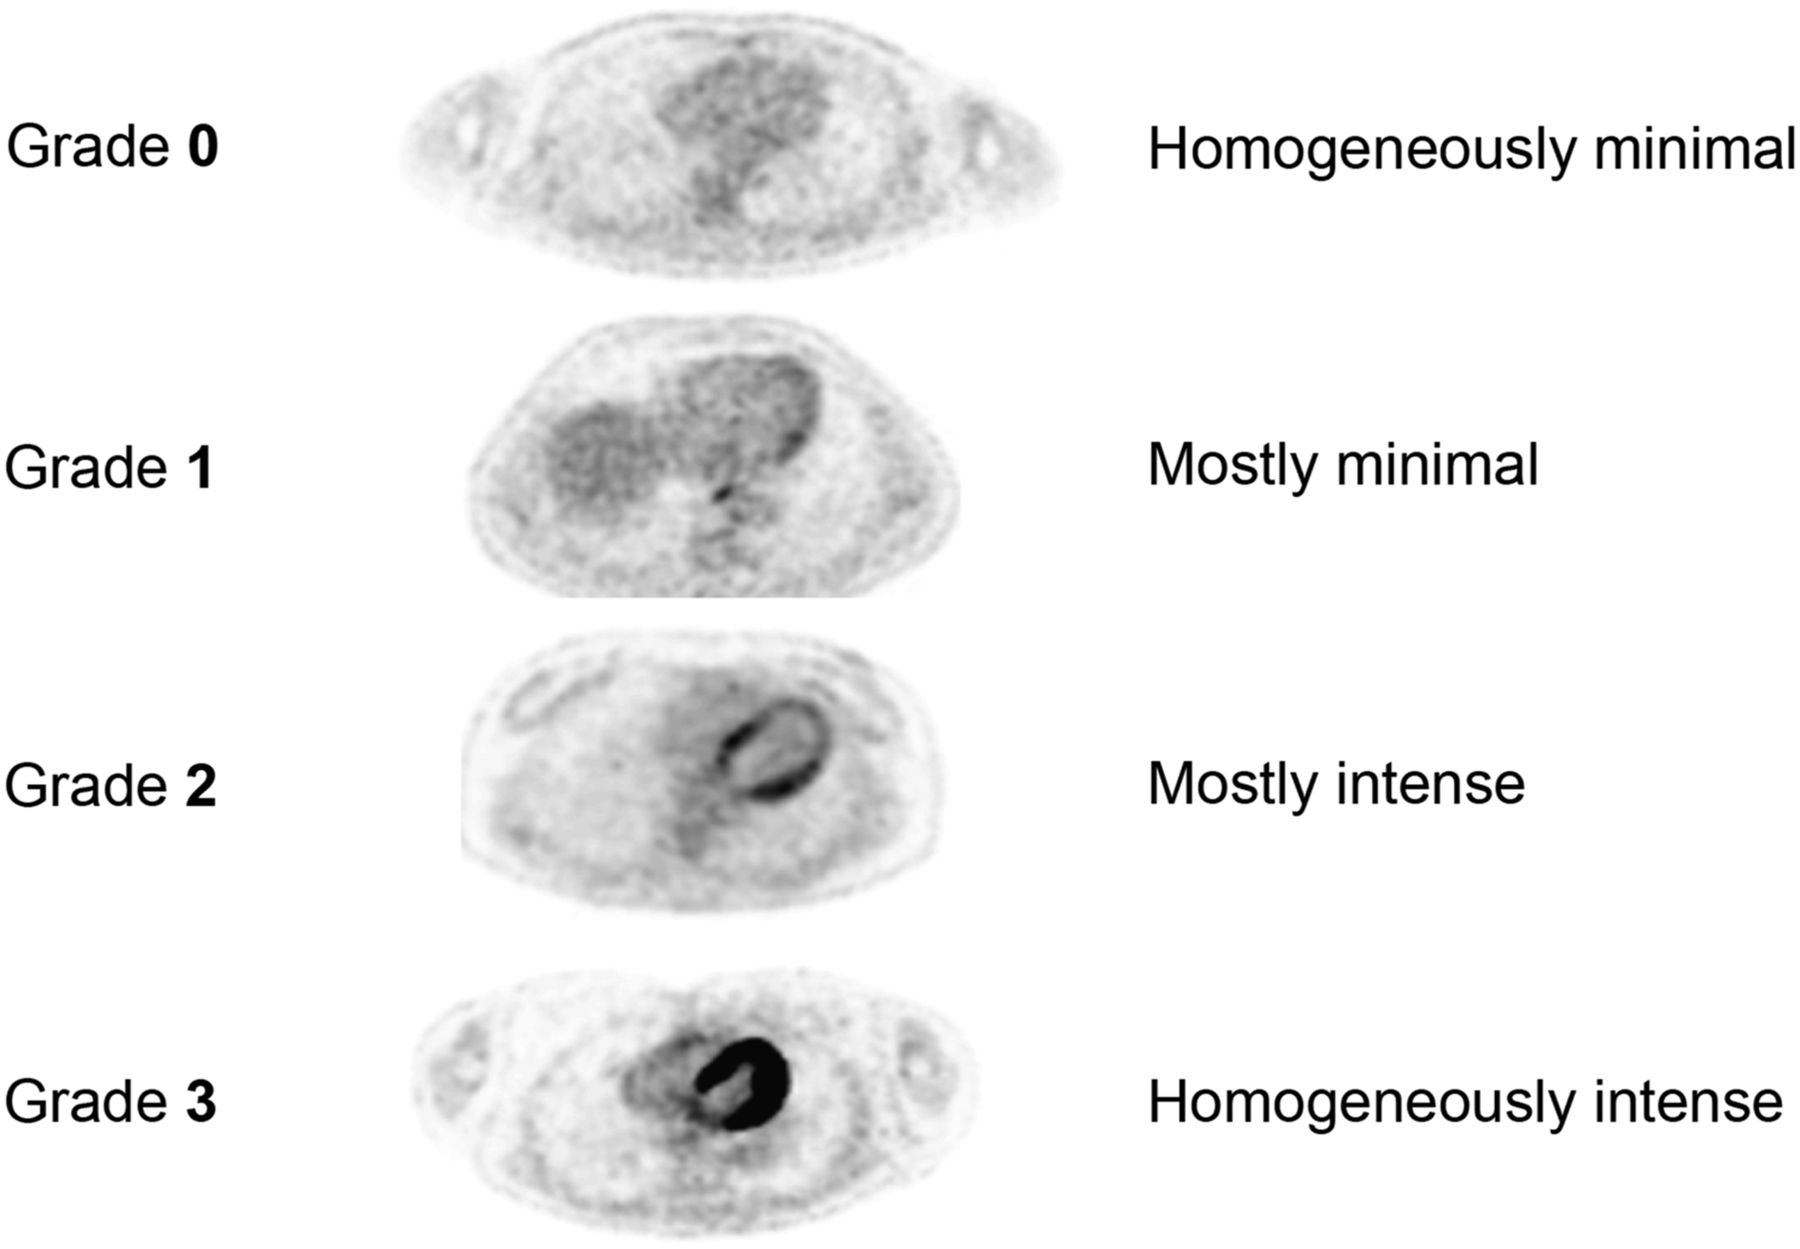
QVS assessing myocardial 18F-FDG uptake.
We also quantitatively assessed the myocardial 18F-FDG uptake by measuring the maximum standardized uptake value (SUVmax). On the basis of anatomic boundaries defined by CT, a region of interest was drawn around the left ventricle in the axial view at the level of the anterolateral papillary muscle, which was included in the analysis. To obtain a background value for 18F-FDG uptake, 6 regions of interest of 1 cm2 each were drawn within the left atrium, and the mean SUV was measured and averaged. Subsequently, for each volunteer, the target-to-background ratio (TBR) was calculated as the myocardial SUVmax divided by atrial blood mean SUV.
Blood Analysis
Blood samples were collected at 18F-FDG injection and at both imaging times (60 and 180 min after 18F-FDG injection) for measurement of glucose, insulin, and cFFA levels (Fig. 1). cFFA was measured using an enzymatic colorimetric method (NEFA-HR(2) assay; Wako Life Sciences, Inc.). All measurements were performed in duplicate.
Statistical Analysis
Group comparisons of categoric variables were made using the Pearson χ2 test. Continuous variables were expressed as mean ± SD. Continuous variables were compared between 2 groups using the Student t test and were compared among all groups using ANOVA (Kruskal–Wallis). Individual comparisons between groups were evaluated post hoc using the Mann–Whitney test. We categorized the volunteers into tertiles according to cFFA level and applied a trend test across ordered groups to assess the relationship between cFFA level and SUVmax. We performed a nonlinear regression between the values of SUVmax measured at 60 min and the cFFA level obtained at the time of injection. κ statistics were used to determine the levels of agreement between the visual grading scores of the 2 readers. For all analyses, differences with a P value of less than 0.05 were considered significant. Receiver-operating-characteristic curve analysis was used to identify the best cFFA level cutoff value for predicting myocardial 18F-FDG uptake suppression. All statistical analyses were performed using SPSS statistical software (version 15.0; SPSS).
RESULTS
There were no significant between-group differences in age, body mass index, blood pressure, heart rate, and pre–18F-FDG-injection glucose level (Table 1).
Baseline Characteristics of Volunteers
Impact of FFA Loading and CCB on Myocardial 18F-FDG Uptake Suppression
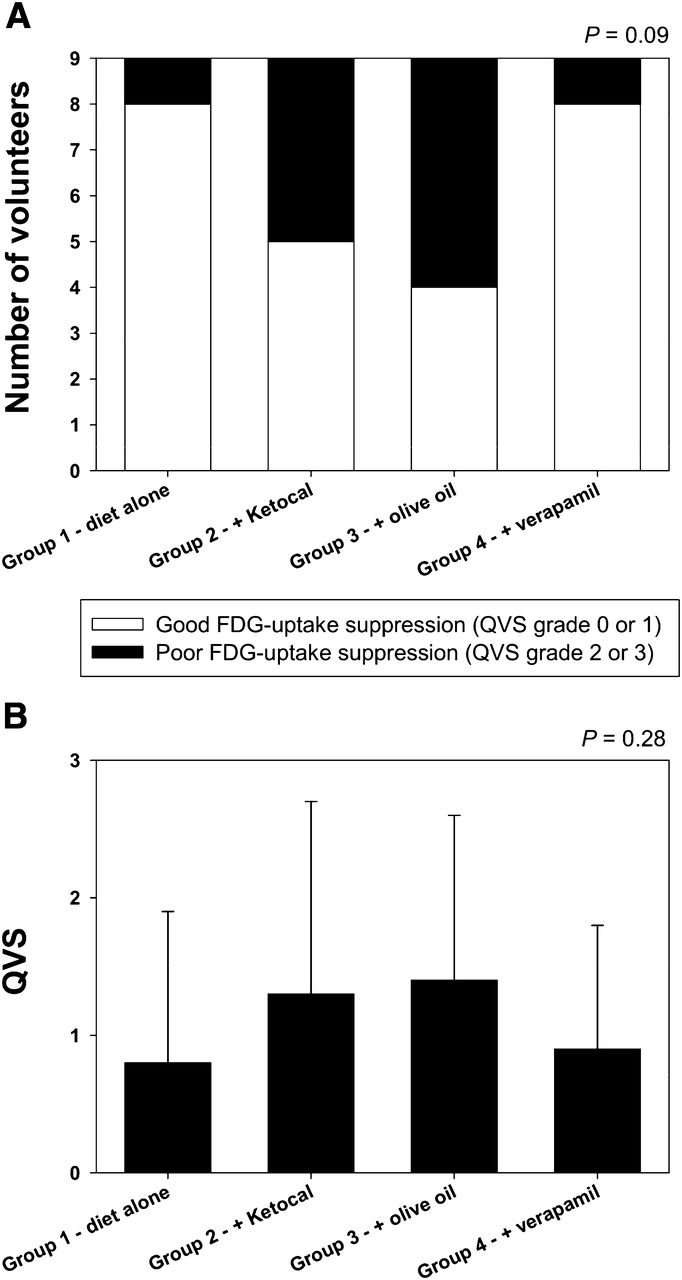
QVS grades of 0 or 1, indicating good myocardial uptake suppression, were observed in 8 of 9 volunteers in group 1, 5 of 9 volunteers in group 2, 4 of 9 volunteers in group 3, and 8 of 9 volunteers in group 4 (Fig. 3A; P = 0.09). The mean QVS grade did not significantly differ between groups (Fig. 3B; P = 0.28). The quantitative analysis showed that at 60 min after 18F-FDG administration, the myocardial SUVmax did not significantly differ between groups (group 1, 2.3 ± 0.8; group 2, 4.6 ± 3.3; group 3, 5.5 ± 5.1; and group 4, 3.0 ± 2.7; Fig. 4A; P = 0.17). Similar results were obtained at 60 min for the TBR values (group 1, 1.50 ± 0.52; group 2, 2.93 ± 2.12; group 3, 3.53 ± 2.89; and group 4, 1.86 ± 1.50; Fig. 4B; P = 0.14).

Box plots showing number of volunteers with good (QVS grades 0 or 1) or poor (QVS grades 2 or 3) myocardial 18F-FDG uptake suppression in each group (P = 0.09) (A) and mean QVS grade in each group at 60 min (P = 0.28) (B).
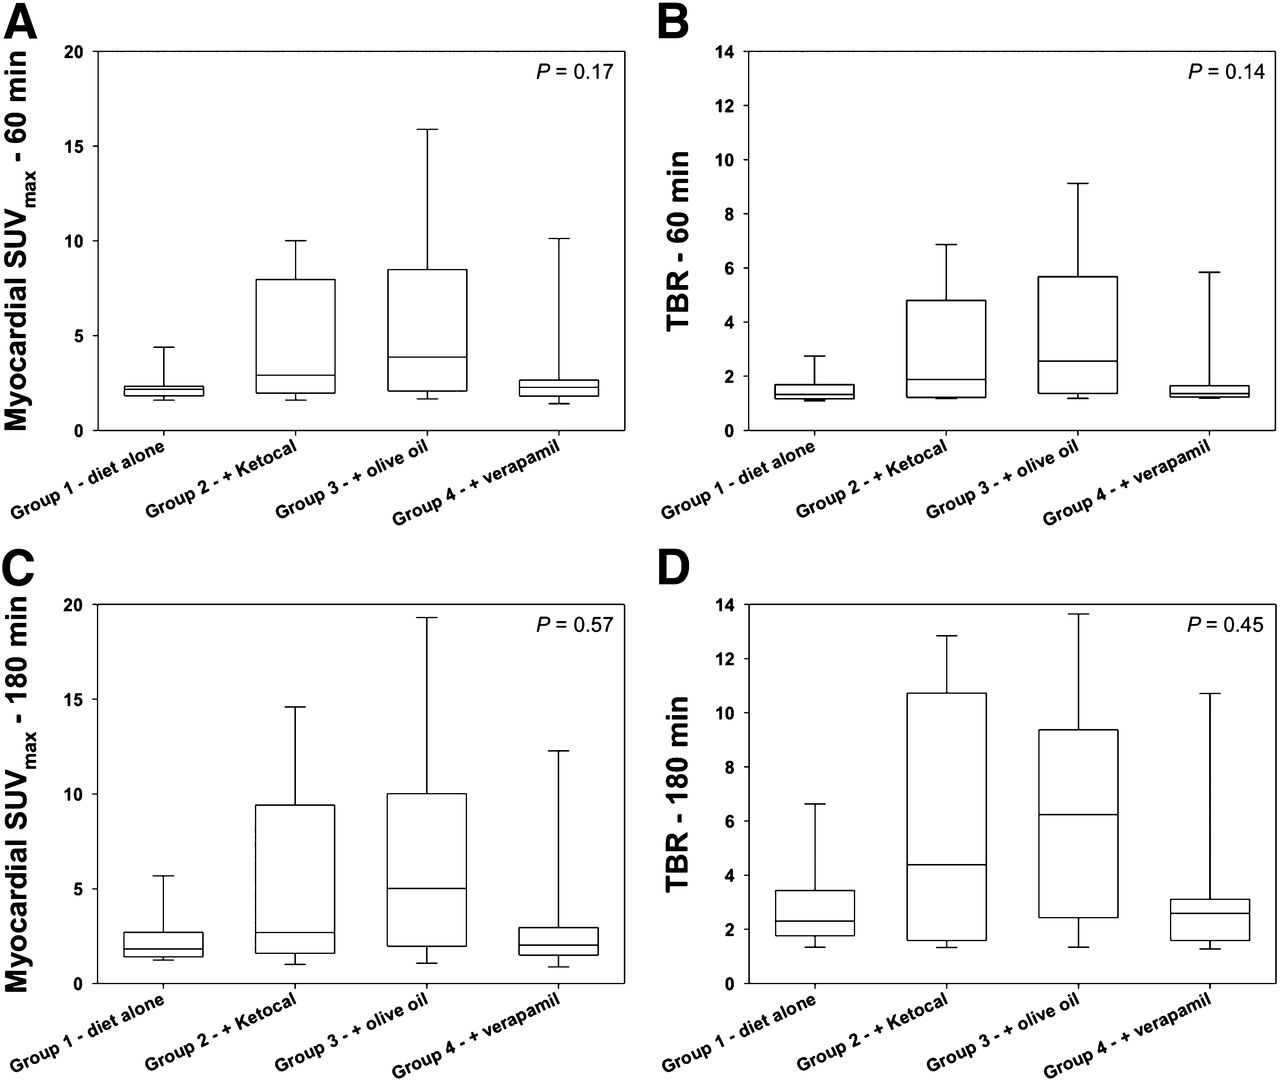
Box plots showing comparisons among study groups of myocardial SUVmax measured 60 min after 18F-FDG injection (P = 0.17) (A), TBRs measured 60 min after 18F-FDG injection (P = 0.14) (B), myocardial SUVmax measured 180 min after 18F-FDG injection (P = 0.57) (C), and TBRs measured 180 min after 18F-FDG injection (P = 0.45) (D).
Influence of Time-Point Imaging
Imaging was performed at 60 and 180 min after 18F-FDG injection, and the acquired images were compared. At the 180-min post–18F-FDG injection imaging, myocardial SUVmax did not significantly differ between groups (group 1, 2.3 ± 1.4; group 2, 5.3 ± 4.9; group 3, 6.8 ± 6.9; and group 4, 3.2 ± 3.5; Fig. 4C; P = 0.57). The myocardial SUVmax remained stable within each group between the 2 time points. On the other hand, because the left atrial SUVmax decreased in the same time, the TBR values increased significantly over time in each group (P = 0.009, 0.015, 0.011, and 0.024 for groups 1, 2, 3, and 4, respectively). However, at 180 min, the TBR values did not significantly differ between groups (group 1, 2.79 ± 1.64; group 2, 5.63 ± 4.69; group 3, 6.37 ± 4.93; and group 4, 3.21 ± 2.90; Fig. 4D; P = 0.45). Similarly, because the visual analysis accounted for the background activity and because that background activity decreased between the time points, we found that 5 volunteers who had a good myocardial extinction (QVS grade 1) at 60 min were reclassified as QVS-2 after 180 min.
Blood Analysis
At 18F-FDG injection, the glucose, insulin, and FFA levels were similar among the 4 study groups (P = 0.78, 0.12, and 0.26, respectively). As expected, the glucose and insulin levels decreased after 60 and 180 min, whereas the FFA level slightly increased over time. Interestingly, volunteers with good (QVS grades 0 or 1) versus poor (QVS grades 2 or 3) myocardial 18F-FDG uptake suppression did not exhibit significantly different glucose (P = 0.97; Fig. 5A) and insulin (P = 0.50; Fig. 5B) levels; however, volunteers with good myocardial 18F-FDG uptake suppression showed significantly higher FFA levels than those with poor myocardial 18F-FDG uptake suppression (0.80 ± 0.31 vs. 0.53 ± 0.15 mmol/L, respectively; P = 0.011; Fig. 5C).
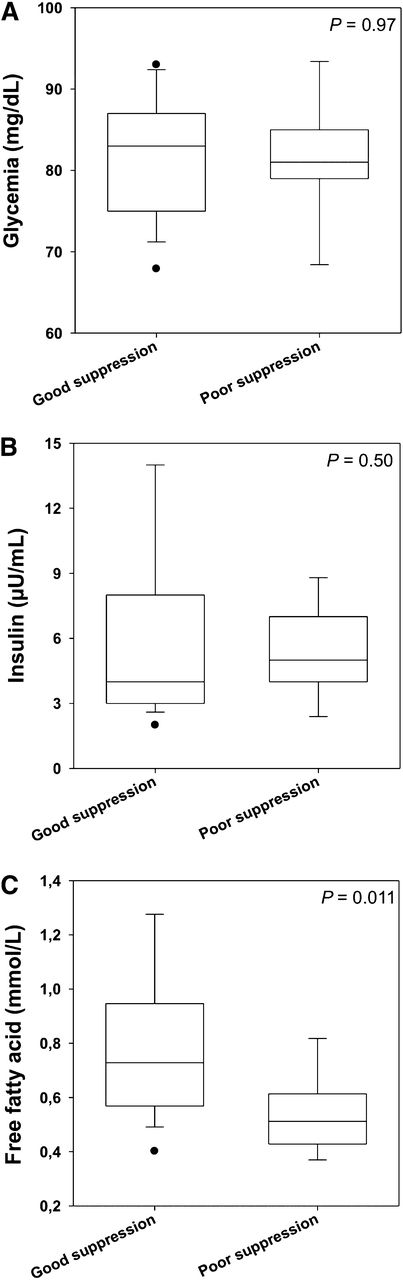
Box plots showing comparisons between volunteers with good vs. poor myocardial 18F-FDG uptake suppression (at 60 min) with regard to glucose (P = 0.97) (A), insulin (P = 0.50) (B), and FFA level (P = 0.011) (C) measured at time of 18F-FDG injection.
Correlation with Blood Parameters
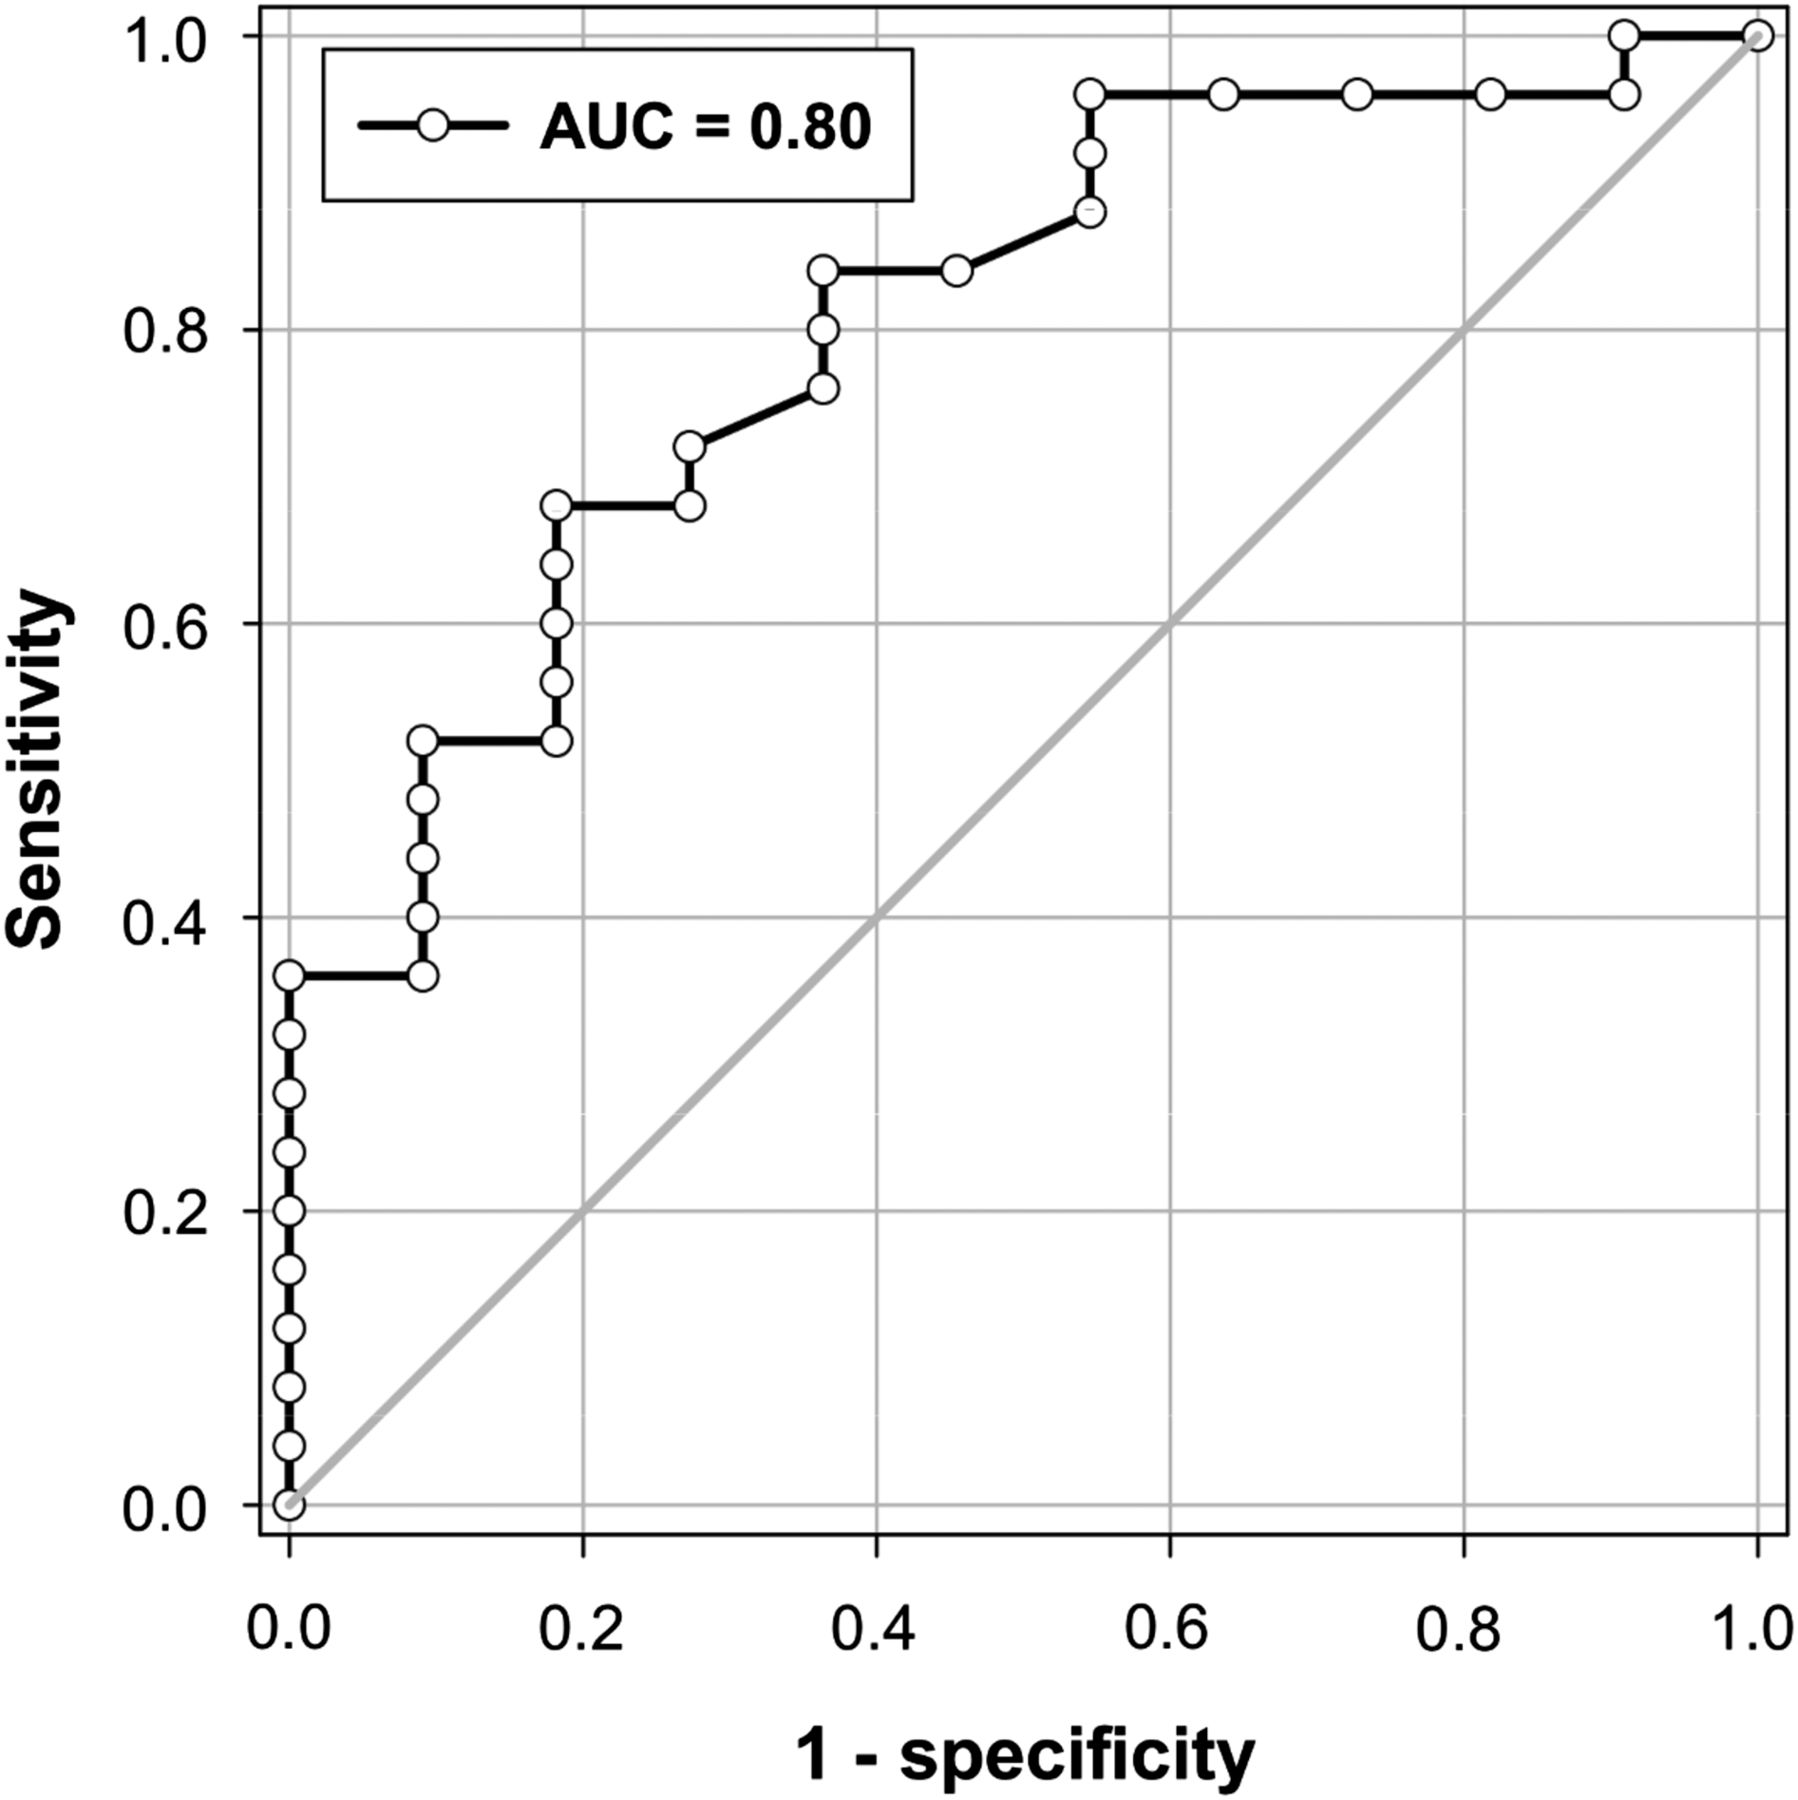
We observed a linear trend toward greater suppression in myocardial 18F-FDG uptake measured at 60 min after 18F-FDG injection, with the highest cFFA levels obtained at the time of 18F-FDG injection (P for trend < 0.001; Fig. 6). When assessed continuously, the cFFA level was significantly related to the suppression of myocardial 18F-FDG uptake (r = 0.61; P < 0.001). However, myocardial 18F-FDG uptake suppression was not correlated with glucose (r = 0.10; P = 0.54) or insulin level (r = 0.08; P = 0.65). Receiver-operating-characteristic analysis demonstrated that a cFFA concentration of greater than 0.65 mmol/L measured at the time of 18F-FDG injection had 68% sensitivity, 82% specificity, and 89% positive predictive value to predict good 18F-FDG uptake suppression (area under the curve, 0.80; Fig. 7).
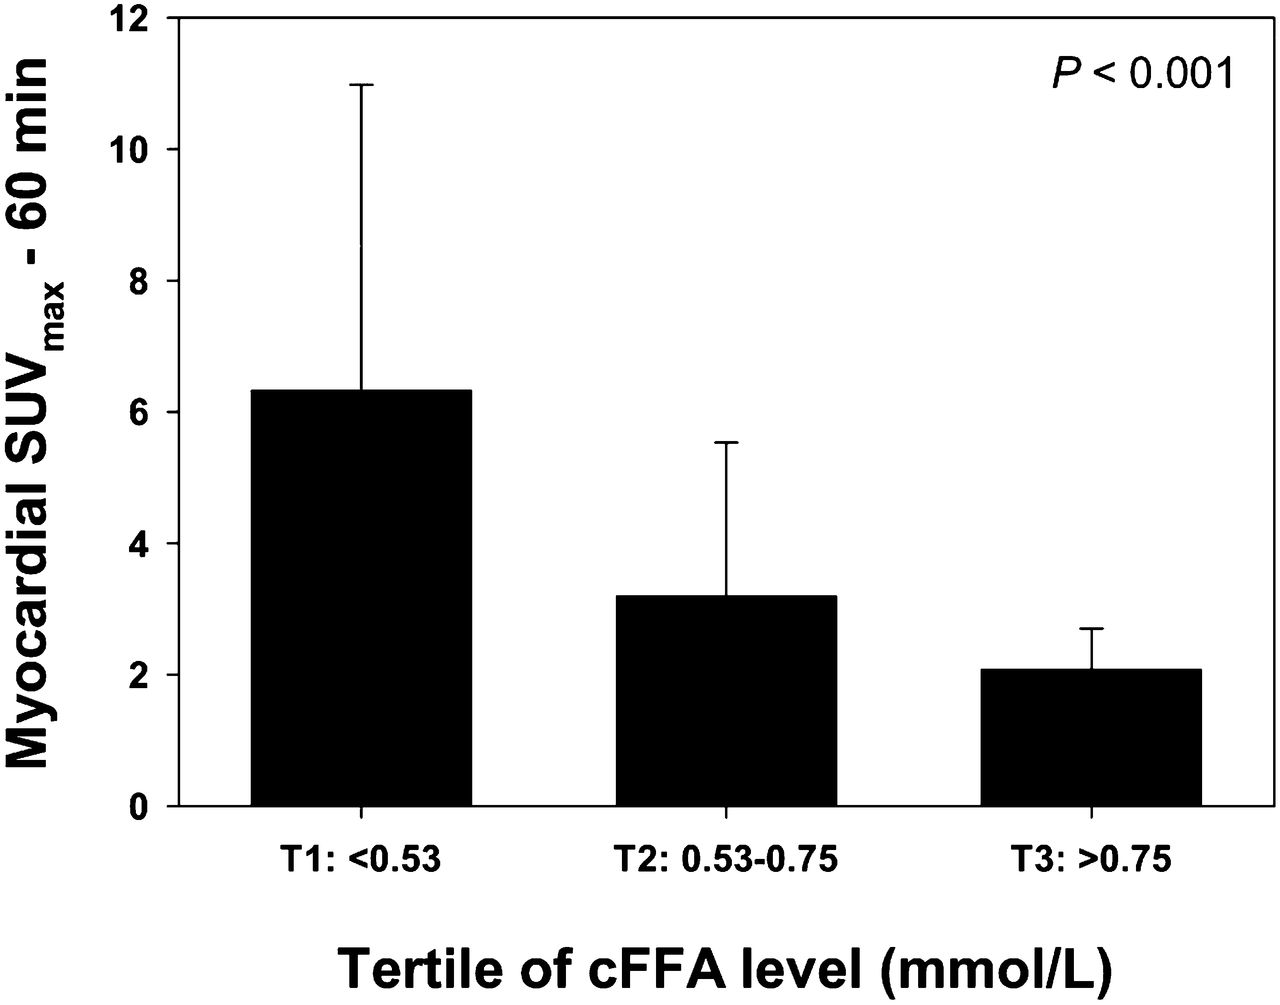
Box plot showing relationship between myocardial SUVmax measured 60 min after 18F-FDG injection and tertiles of cFFA level obtained at 18F-FDG injection (P for trend < 0.001). T1 = tertile 1; T2 = tertile 2; T3 = tertile 3.

Receiver-operating-characteristic curve for cFFA concentration measured at time of 18F-FDG injection for predicting myocardial 18F-FDG uptake suppression (area under the curve [AUC], 0.80).
Interobserver Variability
We found a high κ statistic for interobserver variability of the visual assessment of 18F-FDG uptake (κ = 0.8).
DISCUSSION
This prospective randomized study demonstrates that an HFLC diet administered the evening before 18F-FDG PET/CT followed by 12 h of fasting is an effective method to obtain good myocardial 18F-FDG uptake suppression. Furthermore, our data showed no additional benefit of administering complementary fatty acid loading or CCB 1 h before 18F-FDG injection. One salient finding of this study is the observation that 18F-FDG uptake was inversely correlated with cFFA levels, which could be used to accurately predict the amplitude of myocardial 18F-FDG uptake suppression. This method should allow the avoidance of unnecessary 18F-FDG injection in some patients who are not properly prepared. Finally, our study showed that SUVmax remained stable over time, permitting the imaging of coronary inflammation at either 60 or 180 min after 18F-FDG injection.
Although several interesting tracers are being evaluated for vulnerable plaque imaging (17,18), 18F-FDG PET/CT is currently the most well-evaluated and available tracer for plaque inflammation imaging. In humans with carotid atherosclerosis, areas of high 18F-FDG uptake colocalize with areas of macrophage accumulation (6,19,20) and can predict subsequent acute ischemic events (21,22). Avid 18F-FDG uptake by the myocardium represents the main challenge to overcome before 18F-FDG PET/CT can be used for imaging coronary plaque inflammation. The present study provides important information regarding how to prepare patients before performing coronary 18F-FDG PET/CT, and our findings are in agreement with previously published retrospective and nonrandomized data (8,10,13,23). In the fasted state, such as that imposed on our volunteers, the cFFA level is high and the oxidative metabolism is preferentially dependent on high rates of fatty acid uptake. Furthermore, the volunteers were asked to eat an HFLC meal the evening before imaging, thus inducing an increase in blood triglycerides during postprandial lipemia. Triglycerides are converted by the lipoprotein lipase to FFAs, which then enter fatty acid oxidation pathways. This metabolic pathway explains a very low SUVmax of our group 1 volunteers (2.3 ± 0.8), which was significantly lower than the SUVmax that we measured in conventionally prepared (6-h fasting period) 100 consecutive oncologic patients who underwent 18F-FDG PET/CT at our institution (SUVmax, 6.8 ± 4.8; P = 0.04; data not shown).
We further found that complementary fatty acid loading (>40 g of fat administered 1 h before imaging in groups 2 and 3) provided no additional benefit, compared with the fasted volunteers of group 1. There are several potential reasons for this. First, volunteers of all groups had an HFLC meal the evening before imaging, thus inducing an increase in blood triglycerides. Second, the time between the additional fatty loading and 18F-FDG injection may have been too brief to further increase the blood triglycerides, as has been previously hypothesized (8). Regardless of the reason, given the low SUVmax obtained in group 1 volunteers, complementary fatty acid loading does not seem necessary to optimize myocardial 18F-FDG signal suppression.
Macrophages contained in atherosclerotic plaques use glucose as fuel and can also metabolize FFAs. The latter requires oxygen to generate adenosine triphosphate, whereas glucose metabolism does not. Because the plaque interior is relatively anaerobic, glucose is the major substrate for macrophages (24). Additionally, facilitative transport via the glucose transporter (GLUT) protein system is the pathway predominantly used for 18F-FDG to enter human cells. 18F-FDG uptake in cultured macrophages depends on the degree of macrophage activation (25). Macrophage activation increases both GLUT-1 and GLUT-3 expressions, whereas the insulin-sensitive GLUT-4 subtype, which is supposed to be affected by the HFLC diet used in our study, is not detectable. Therefore, macrophage 18F-FDG uptake should not be influenced by the HFLC preparation.
Cyclic adenosine monophosphate is involved in myocardial glucose uptake through a Ca2+-dependent mechanism, and CCBs reportedly reduce myocardial 18F-FDG uptake in a murine model (11). However, our data showed that CCB given 1 h before 18F-FDG injection did not improve myocardial uptake suppression in our volunteers who were asked to fast for 12 h after an HFLC diet. It remains unknown whether CCB could provide a good 18F-FDG uptake suppression in conventionally prepared patients (carbohydrate-permitted diet followed by 6-h fasting). Nevertheless, the low SUVmax that we measured in our group 1 volunteers questions the necessity for the use of CCBs, which could potentially lead to side effects. Some authors have attempted to raise cFFA levels by infusing unfractionated heparin to stimulate lipoprotein lipase (26). Again, because of the contraindications and the potential side effects of this medication, we think that an HFLC meal followed by 12 h of fasting represents a safer alternative for improving myocardial 18F-FDG uptake suppression.
It is recommended that vascular PET studies involve a longer 18F-FDG circulation time than that for oncology PET imaging. This extended time frame is intended to allow sufficient 18F-FDG accumulation in the arterial wall and to permit the reduction of blood 18F-FDG levels by decay and excretion (24). For imaging carotid arteries and aorta, the optimum time point is between 60 and 180 min (27). The exact optimum time point for coronary artery imaging is unknown. This time point must account for the risk of a partial-volume effect of 18F-FDG activity spilling into the arterial wall from the vessel lumen and from the myocardium. Our data showed that the decreased myocardial 18F-FDG uptake remained stable over time. It suggests that with adequate myocardial 18F-FDG uptake suppression, the detection of coronary plaque inflammation would not be affected by the myocardial 18F-FDG signal being measured at either 60 or 180 min after 18F-FDG injection. The optimal timing for imaging coronary plaque should predominantly depend on the arterial lesion uptake itself. Further studies are needed to determine the optimal timing for imaging coronary plaques in patients.
Although good myocardial 18F-FDG uptake suppression was obtained in most volunteers prepared with an HFLC diet followed by 12 h of fasting, the myocardial 18F-FDG uptake remained too high in a few volunteers. Therefore, it is extremely important to be able to predict the amplitude of suppression and to thus avoid unnecessary injections of 18F-FDG in inadequately prepared patients. Glucose and insulin levels do not predict myocardial 18F-FDG uptake suppression. One exciting finding of the present work was that myocardial 18F-FDG uptake could be predicted by the total cFFA measured before 18F-FDG injection, with an excellent positive predictive value. The measurement could be easily and quickly (∼30 min) obtained in a clinical imaging center and should help to refine the quality of vulnerable coronary plaque detection in patients. Finally, beyond this potential clinical application, our data support the use of our group 1 regimen and the measurement of total cFFA for detecting cardiac involvement of sarcoidosis, which is a definite indication for 18F-FDG PET imaging.
The main limitation of the present work is the relatively small number of volunteers included in the study. However, the study was randomized, and the SUVmax obtained in group 1 volunteers was low, compared with the SUVmax that we usually obtain in patients referred for oncologic disease. Given the low SUVmax obtained in group 1 volunteers, the number of volunteers in the 3 other groups should have been high for identifying difference from group 1. Consequently, we decided to end the study after 9 volunteers because we felt it unethical to continue enrolling volunteers. Healthy volunteers have been recruited to perform this study. That can be seen as another limitation. Nevertheless, our results are in accordance with those obtained in older patients by other groups (8,10). Furthermore, it has been previously shown that the myocardial glucose utilization does not increase with age (28). Finally, we did not look at regional variability in tracer uptake. Thus, whether any of the interventions increase or decrease regional variability in 18F-FDG uptake remains undetermined as well as the impact of a potential regional uptake on the visualization of coronary plaque inflammation.
CONCLUSION
An HFLC diet administered the evening before 18F-FDG PET/CT followed by fasting for 12 h is a simple and effective method to obtain good myocardial 18F-FDG uptake suppression in a large majority of subjects. No additional benefit was conferred by complementary fatty acid loading or CCB administered 1 h before 18F-FDG injection. Myocardial 18F-FDG uptake is inversely correlated with cFFA levels, which could be used to accurately predict the amplitude of myocardial 18F-FDG uptake suppression. This method could allow avoidance of unnecessary 18F-FDG injection in patients who are not properly prepared. Finally, when adequately suppressed, the myocardial 18F-FDG signal remains low and stable over time, allowing opportunities for coronary inflammation imaging over a broad time range.
DISCLOSURE
The costs of publication of this article were defrayed in part by the payment of page charges. Therefore, and solely to indicate this fact, this article is hereby marked “advertisement” in accordance with 18 USC section 1734. This study was supported by the “Camille and Germaine Damman foundation,” Brussels, Belgium. No other potential conflict of interest relevant to this article was reported.
Footnotes
Published online Jul. 31, 2014.
- © 2014 by the Society of Nuclear Medicine and Molecular Imaging, Inc.
REFERENCES
- Received for publication February 4, 2014.
- Accepted for publication June 30, 2014.


Jump to section
Related Articles
Cited By...
- Joint SNMMI-ASNC Expert Consensus Document on the Role of 18F-FDG PET/CT in Cardiac Sarcoid Detection and Therapy Monitoring
- Evaluation of Known or Suspected Cardiac Sarcoidosis
- Can the Inflammatory Response Be Evaluated Using 18F-FDG Within Zones of Microvascular Obstruction After Myocardial Infarction?