


Abstract
Inflammation that occurs after acute myocardial infarction plays a pivotal role in healing by facilitating the creation of a supportive scar. 18F-FDG, which is taken up avidly by macrophages, has been proposed as a marker of cell-based inflammation. However, its reliability as an accurate indicator of inflammation has not been established, particularly in the early postinfarction period when regional myocardial perfusion is often severely compromised. Methods: Nine adult dogs underwent left anterior descending coronary occlusion with or without reperfusion. Animals were imaged between 7 and 21 d after infarction with PET/MR imaging after bolus injection of gadolinium-diethylenetriaminepentaacetic acid (DTPA), bolus injection of 18F-FDG, bolus injection of 99Tc-DTPA to simulate the distribution of gadolinium-DTPA (which represents its partition coefficient in well-perfused tissue), and injection of 111In-labeled white blood cells 24 h earlier. After sacrifice, myocardial tissue concentrations of 18F, 111In, and 99Tc were determined in a well counter. Linear regression analysis evaluated the relationships between the concentrations of 111In and 18F and the dependence of the ratio of 111In/18F to the apparent distribution volume of 99mTc-DTPA. Results: In 7 of 9 animals, 111In increased as 18F increased with the other 2 animals, showing weak negative slopes. With respect to the dependence of 111In/18F with partition coefficient, 4 animals showed no dependence and 4 showed a weak positive slope, with 1 animal showing a negative slope. Further, in regions of extensive microvascular obstruction, 18F significantly underestimated the extent of the presence of 111In. Conclusion: In the early post–myocardial infarction period, 18F-FDG PET imaging after a single bolus administration may underestimate the extent and degree of inflammation within regions of microvascular obstruction.
- myocardial infarction
- myocardial inflammation
- PET/MRI
- 18F-FDG
- 111In-labeled white blood cells
- late gadolinium enhancement (LGE)
There has been significant effort to develop noninvasive imaging methods to quantify in time and location the inflammatory response after myocardial infarction toward the goal of potentially intervening with therapies that may prevent or limit the degree of adverse left ventricular remodeling. The goal of understanding the role of the inflammatory response in the progression of myocardial remodeling is not new (1), but to date the techniques have been crude and limited in both spatial and temporal resolution.
Whereas the uptake of 18F-FDG in regions of recent myocardial infarction was found to be an unreliable indicator of myocardial viability, recent studies have suggested that the uptake of 18F-FDG by macrophages could be used to identify the degree and extent of myocardial inflammation in the early postinfarction period. Here, we have focused on validating the reliability of 18F-FDG as a marker of postinfarction inflammation, particularly in light of the markedly compromised flow in areas of recently infarcted myocardium. Adding another layer of complexity to the use of 18F-FDG in this setting is the need to suppress competing uptake in the normal myocardium and its nonspecificity with respect to inflammation cell type (2,3). Despite these limitations, the combination of PET and MR imaging in 1 device, hybrid PET/MR imaging, would allow one to serially track in 3 dimensions the relationships between scarring and macrophage-based inflammation using late gadolinium enhancement (LGE) and 18F-FDG, respectively. The potential role of this approach to assess myocardial scarring and inflammation has already been shown in another disorder associated with inflammation, sarcoidosis (4).
Here, using both in vivo imaging and ex vivo tissue analysis, we have investigated in a well-characterized canine model of myocardial infarction the uptake of 18F-FDG into infarcted myocardium and its distribution into the central core areas of microvascular obstruction (MO) in comparison to the distribution of 111In-labeled white blood cells.
MATERIALS AND METHODS
Animals and Surgical Preparation
The study was approved by the Animal Care Committee of the University of Western Ontario (Animal Use Protocol 2011-67).
Nine adult female, bred-for-research hounds (19–24 kg) were used. Anesthesia was induced using propofol and maintained with isoflurane (2%). After a left thoracotomy, a myocardial infarction was induced by placing a snare ligature around the left anterior descending coronary artery. In 5 animals, this snare was released after 3 h, and in 4 it was left in place for the duration of the study. Animals underwent PET/MR imaging at a single imaging session in both the occlusion reperfusion group (OR), at 7, 7, 13, 14, and 20 d, and the permanent occlusion group (PO), at 7, 8, 13, and 13 d. The imaging protocol involved simultaneous cardiac MR and PET imaging.
18F-FDG PET Imaging
The suppression of normal myocardial uptake of 18F-FDG was accomplished by modification of the techniques used to highlight inflamed coronary plaques and for imaging patients with suspected sarcoidosis (4–8). An infusion of 20% lipid (Intralipid; Baxter Healthcare Corp.) at a rate of 0.25 mL/min/kg was administered intravenously over a 50-min period, beginning 20 min before 18F-FDG injection. In addition, 2,000 units of heparin were given intravenously immediately before the lipid infusion to further suppress glycolysis, and the animals were fasted between 16 and 21 h before the start of imaging (7,8). All dogs were fed a normal diet. This myocardial suppression protocol was validated before the current study in 3 noninfarcted animals. These were compared with and without lipid emulsion with either a normal diet or a high-fat diet. Measurements of maximum standardized uptake values were taken in the left ventricular wall. Significance was tested using a 1-tailed paired t test, with P value set at 0.05.
Animals were anesthetized and transferred to the PET/MR imaging scanner (Biograph mMR; Siemens AG). An intravenous injection of 18F-FDG (250–300 MBq) was given, and data were collected for 70 min in list-mode. Attenuation correction was performed using segmentation of images obtained with a 2-point Dixon MR imaging pulse sequence. In the last 10 min of this 18F-FDG acquisition, 3-dimensional (3D) LGE MR imaging data were acquired. Retrospective binning of data was done to 6 cardiac phases. PET data were reconstructed using an iterative 3D ordered-subset expectation maximization method with 3 iterations and 21 subsets, a zoom factor of 2.5, 344 × 344 × 127 matrix size, and a 2-mm gaussian smoothing filter. The voxel size with these parameters was 0.83 × 0.83 × 2.03 mm. After the animal was euthanized while in the scanner, and without being moved, a further 10-min PET image was acquired.
Cardiac MR Imaging
Cardiac MR imaging was initiated at the start of the lipid emulsion infusion. Using Siemens Works-In-Progress software, we acquired a single-slice multiecho T2* map to estimate the presence of hemorrhage (single breath hold; electrocardiogram-triggered; multiecho gradient-echo sequence; 8 images per slice with echo times of 2.5, 4.8, 7.1, 9.5, 11.8, 14.2, 16.5, and 18.9 ms; repetition time of 467 ms; 2 averages; 3.5-mm slice thickness; 192 × 156 matrix, resulting in the voxel size of 1.35 × 1.35 mm in plane × 3.5 mm nominal slice thickness). Because of cardiac motion, only the first 5 echoes were used to estimate the presence of susceptibility, which is consistent with hemorrhage. A bolus of gadolinium contrast (0.2 mmol/kg) (Magnevist; Bayer Inc.) was infused at 0.3 mL/s, followed by a 40-mL saline infusion. Twenty minutes after the bolus infusion, a respiration- and cardiac-gated 3D whole-heart inversion-recovery gradient-echo pulse sequence was acquired as previously described (4,9) using an integrated parallel-acquisition technique and a fat-suppressed isotropic/voxel size of 1 × 1 × 1 mm (echo time, 1.3 ms; 20° flip angle; and variable inversion times to suppress signal in noninfarcted myocardium). The animal was then euthanized, and the whole-heart inversion-recovery gradient-echo sequence was repeated while the 3D 10-min 18F-FDG images were acquired.
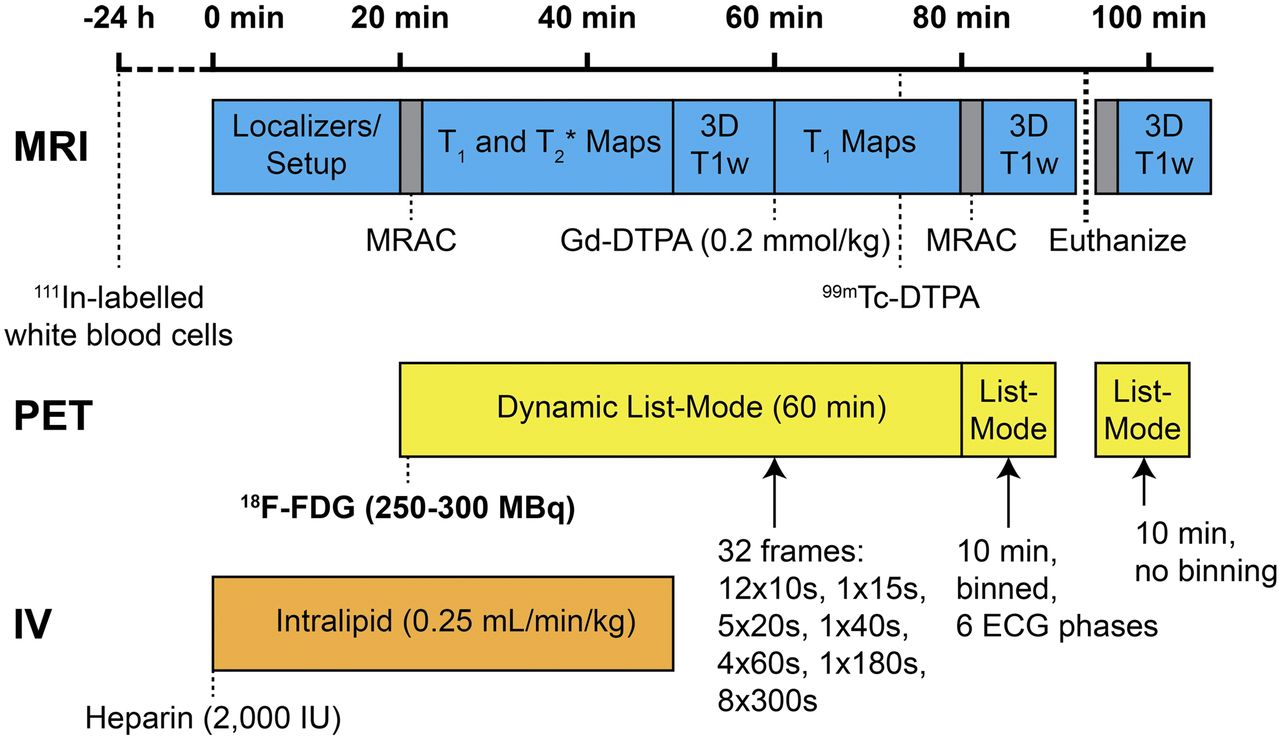
The timing of the entire experimental protocol is shown in Figure 1.
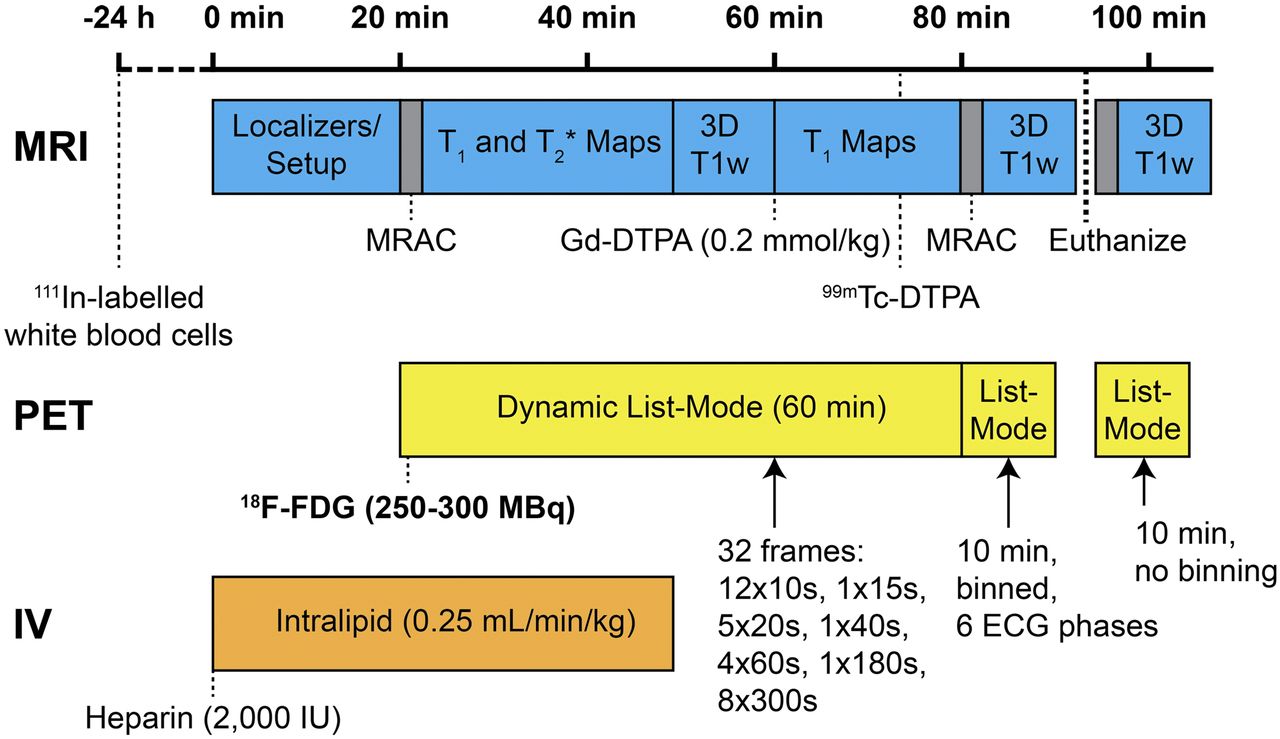
Timing of entire experimental protocol. ECG = electrocardiogram; IV = intravenous; MRAC = magnetic resonance attenuation correction; T1w = T1-weighted.
Image Processing
The 3D LGE images taken in the live animal after the gadolinium-diethylenetriaminepentaacetic acid (DTPA) injection were processed for the size in grams of the region of MO. Sequential short-axis LGE images underwent signal-threshold–based quantification of total volume of hyperenhancement reported in grams using a signal threshold versus reference mean technique (9).
In Vitro Tissue Counting
After euthanasia, the hearts were excised and cut into 7 slices (base to apex). The slices were washed and visually examined for evidence of hemorrhage and scored as 4 for severe to 1 for nonexistent. With the postmortem 3D 18F-FDG and LGE images used as a guide, the myocardial tissue was segmented into an average of 107 (range, 93–123) samples, with an average weight of 0.71 g (SD, 0.18 g).
Blood samples were taken and the white blood cells isolated and then labeled with 111In-oxine (Cardinal Health) using standard methods (10). Labeled cells were injected between 21 and 28 h before the start of imaging.
Six minutes after the bolus injection of gadolinium-DTPA, a bolus injection of 99mTc-DTPA was given to allow for ex vivo measurement of the concentration of a tracer that would simulate the tissue distribution of gadolinium-DTPA (11). On euthanasia, ten 1-mL blood samples were taken so that partition coefficients for 99mTc-DTPA for heart tissue could be calculated as 99mTc activity per gram of myocardium divided by 99mTc activity per milliliter of blood. The partition coefficients (λ) of 99mTc-DTPA and gadolinium-DTPA (Magnevist) are related in heart tissue (11): Eq. 1
Eq. 1
Tissue and blood samples were counted for 18F, 99mTc, and 111In in a high-purity germanium well counter, with an active volume of 190 mL, an efficiency of greater than 10%, and a spectral resolution of less than 2 keV over the range of energies (140–511 keV) detected. Each sample was counted for 2 min, with counts corrected for detector dead time and radioisotope decay. The tissue samples were separated into 2 groups. Group 2 corresponded to tissue with concentration at least 1 SD below the mean 18F concentration. These tissue samples generally had been taken from regions in which MO was demonstrated on the gadolinium-DTPA–enhanced images. It was assumed all other samples came from tissue that was not so affected. Results for each sample were tabulated as 111In (cps/g) versus 18F (cps/g) and as the ratio of 111In to 18F as a function of  .
.
Statistical Analysis
The results from the tissue counting for group 1 were fit by linear regression (SigmaPlot 13; Systat Software Inc.). For each dog’s data, 2 regressions were fit for the non-MO data: 1 to 111In (cps/g) versus 18F (cps/g) and 1 to the ratio of 111In to 18F versus  .
.
RESULTS
In the preliminary experiments evaluating myocardial suppression of 18F-FDG uptake, there was a significant drop in maximum standardized uptake value when lipid emulsion was administered independent of diet (P = 0.02) and when animals were given a normal diet (P = 0.0084) but no significant effect of lipid emulsion when a high-fat diet was given (P = 0.24). Hence, it was decided to use lipid emulsion infusion and not to use a high-fat diet. For all these experiments, animals were injected with 2,000 IU of heparin (7) as others have demonstrated the combination of heparin and lipid emulsion as effective (8).
The experimental parameters, except for 111In-labeling efficiency, were consistent for all the animals whereas the variation of extensiveness of myocardial injury varied from mild to severe (Table 1). The linear regression analysis showed an expected relationship between 111In/g versus 18F/g consistent with 18F-FDG representing inflammation in 7 of 9 dogs; however, in only 4 of these 7 was the relationship independent of the partition coefficient (Table 2). Subject OR4’s (14 d) images showed a subendocardial infarct without evidence of MO and limited evidence of hemorrhage (Fig. 2). The tissue analysis for this animal (Fig. 3) demonstrated that there was a significant positive slope between 111In and 18F concentrations. Also, the ratio of 111In to 18F was constant (i.e., independent of the 99mTc-DTPA partition coefficient). Images for PO1 (7 d) show a large area of MO (Fig. 4), with the corresponding tissue analysis (Fig. 5) showing a significant negative slope of 111In to 18F and that the ratio of 111In to 18F significantly increases as the partition coefficient increases.
Experimental Details and Tissue Characterization
Regression Equations for Non-MO Tissue

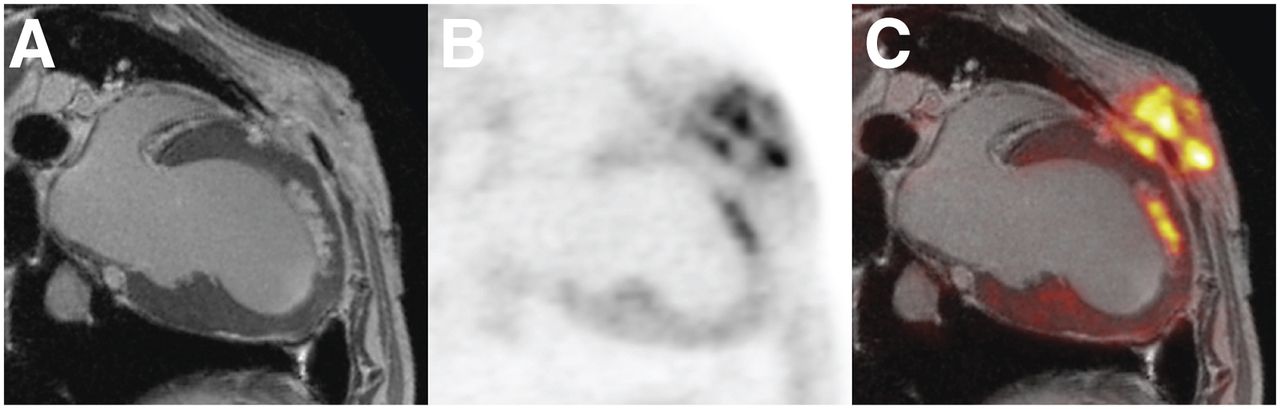
Postmortem MR (A), PET (B), and PET/MR (C) images of subject OR4 (14 d). MR image demonstrates anteroapical subendocardial infarct. Increased activity of 18F-FDG in chest wall in PET image is at site of surgery.

Quantitative analysis of tissue samples for same subject as shown in Figure 2 (subject OR4). (A) Regression of 111In versus 18F was strong and slope significantly positive. (B) Regression of 111In/18F versus  was weak and slope not significant, indicating that 111In/18F ratio was independent of
  .
.

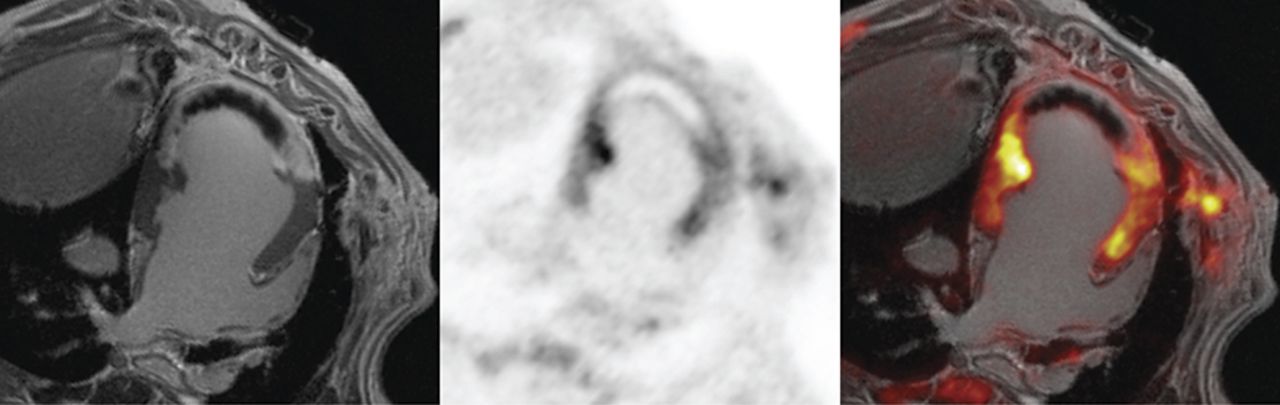
Postmortem MR (left), PET (middle), and PET/MR (right) images of subject PO1 (7 d). Anteroapical infarct is transmural, with large central MO that is void in both 18F-FDG and gadolinium-DTPA but is surrounded by zone of increased 18F-FDG and gadolinium-DTPA.

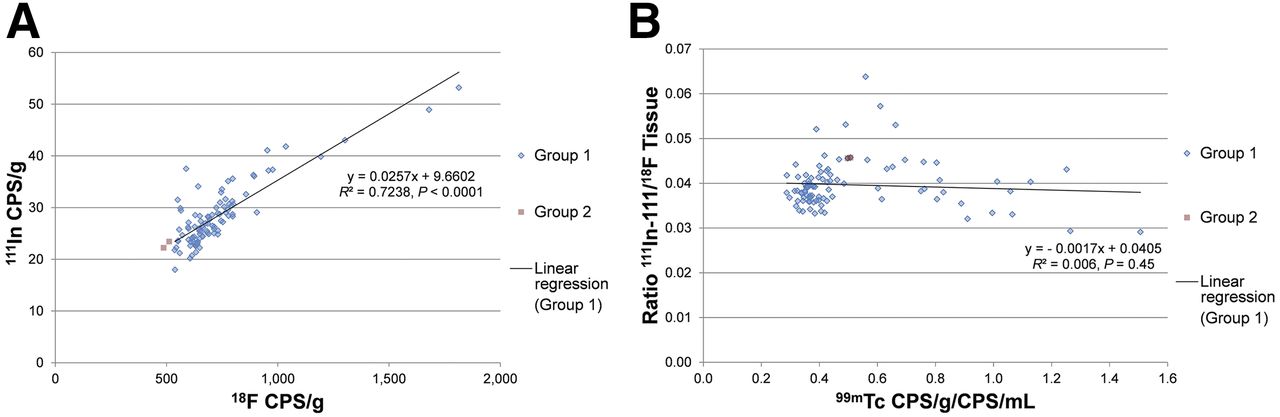
Quantitative analysis of tissue samples for same subject as shown in Figure 4 (subject PO1). Regression analysis excluded samples estimated to be from MO tissue (designated as group 2). Regression of 111In vs. 18F in A is modest but negative slope significant. Regression of 111In/18F vs. 99mTc-DTPA in B is significant and indicates that as partition coefficient increases 111In increases more quickly than 18F. This ratio is much higher in MO zone, suggesting that 18F-FDG significantly underestimated extent of inflammation in this zone.
Single-slice T2*-weighted images for OR4 (Fig. 6) show little to no hemorrhage, although visual evaluation of excised heart slices showed mild hemorrhage present (Table 1). T2*-weighted images for PO1 (Fig. 7) provide evidence of significant hemorrhage supported by visual inspection of the excised heart (Table 1). Results for the other 7 animals fall between what is seen in these 2 animals, which represents the extremes. In all of the other animals but one (OR5; at 20 d), the concentration of 111In increased as 18F increased. With respect to the dependence of 111In/18F to partition coefficient, 3 were similar to OR4 (Fig. 3), with zero slope; 4 showed a significant positive slope; and 1 showed a significant negative slope.

Gradient-echo images (i.e., T2* imaging) of subject OR4 (also featured in Figs. 2 and 3) at echo times of 2.5 (A) and 9.5 ms (B) and matched LGE image (C). No evidence of hemorrhage was identified. White arrow indicates subendocardial infarction. Examination of tissue and assessment of LGE images showed no evidence of MO whereas examination of tissue (Table 1) suggested mild hemorrhage.
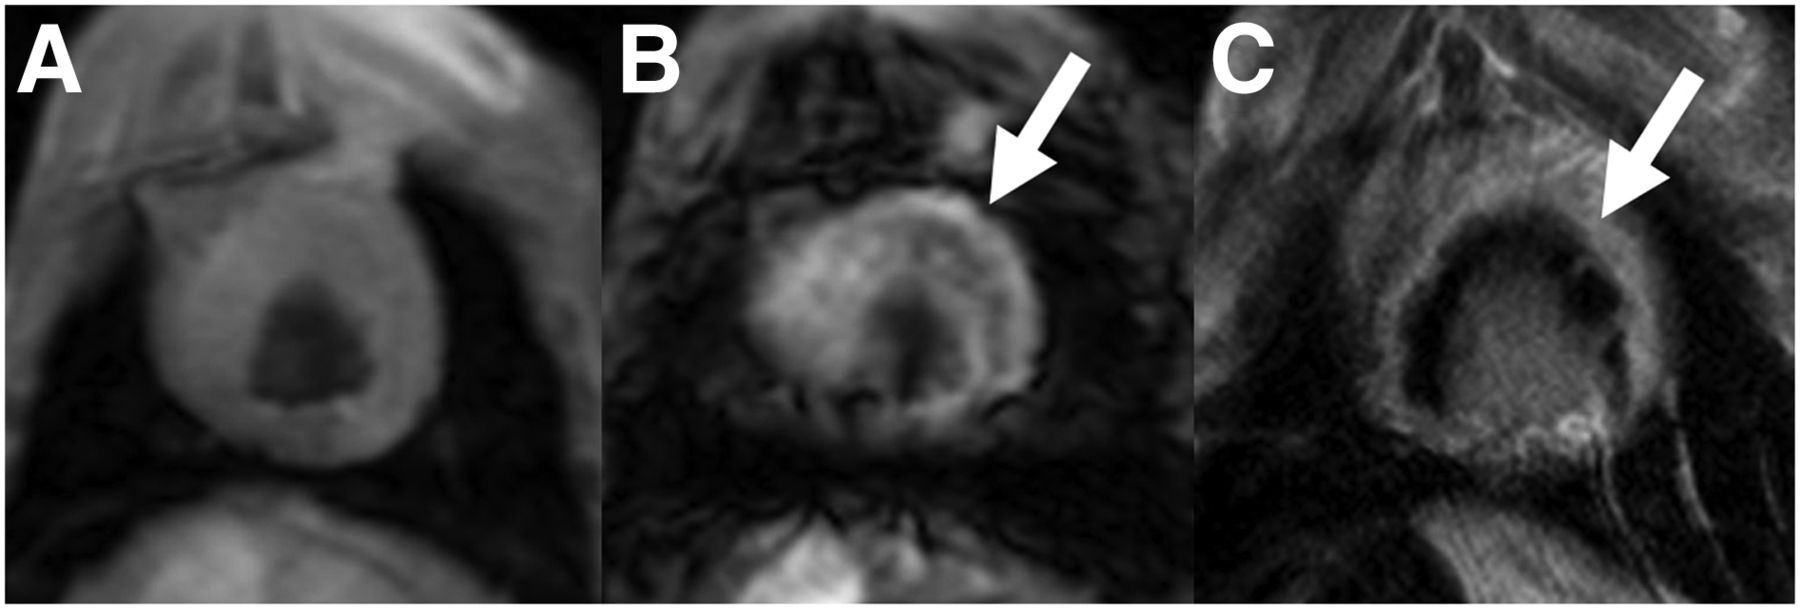
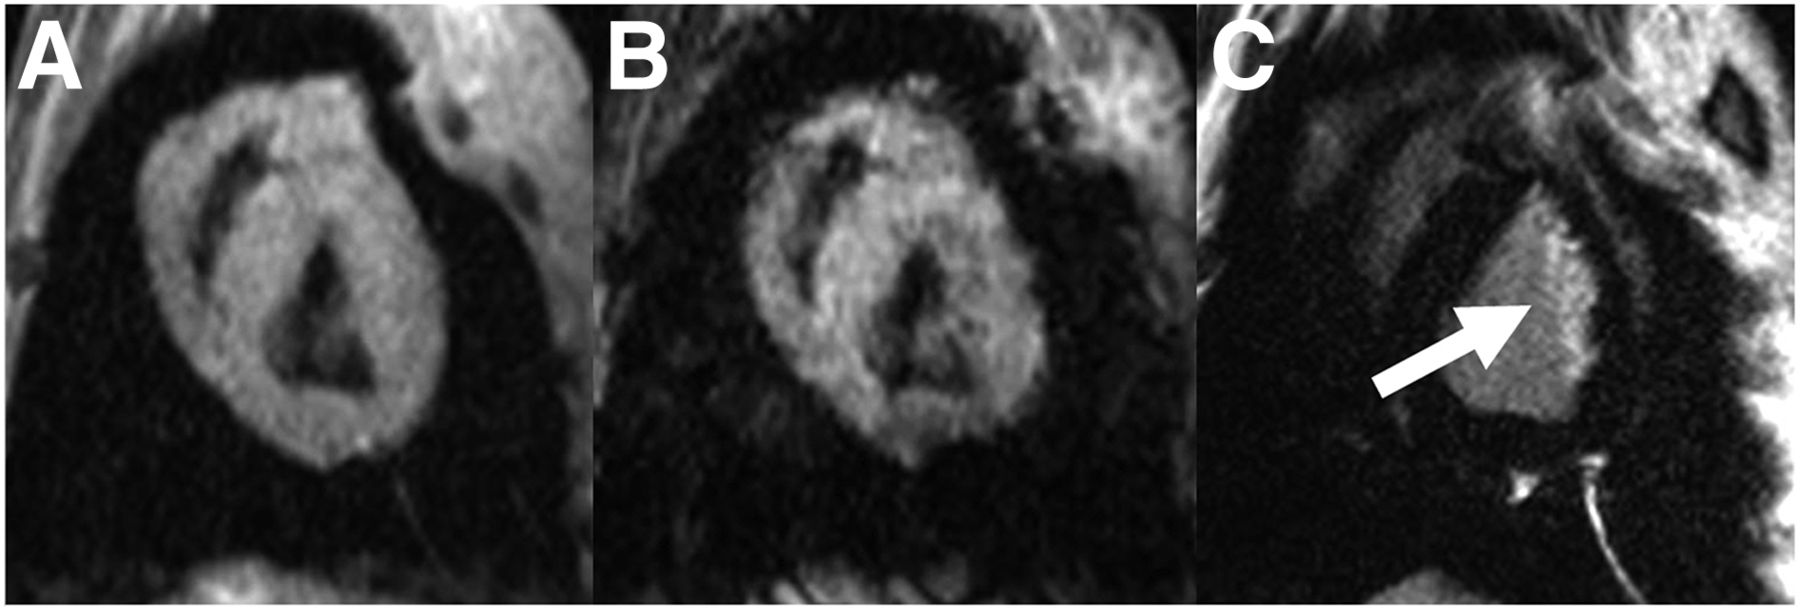
Gradient-echo images (i.e., T2* imaging) of subject PO1 (also featured in Figs. 3 and 4) at echo times of 2.5 (A) and 9.5 ms (B) and matched LGE image (C). White arrow on B indicates susceptibility indicative of hemorrhage; white arrow on C indicates transmural infarct and associated region of MO. Examination of tissue (Table 2) from this region indicated significant hemorrhage.
DISCUSSION
If 18F-FDG was strictly a measure of inflammation, it is expected that there would be a strong positive linear regression between the tissue concentration of 111In and 18F and that there would be no dependence on the ratio of 111In/18F to the partition coefficient of DTPA. As seen for subject PO1 in Figures 4 and 5, this clearly cannot be assumed in tissue with MO. At the minimum values of the partition coefficient, this ratio increases 7-fold, suggesting that in the region of MO (reduced apparent partition coefficient), there were 111In-labeled white blood cells but little 18F consistent with the postmortem images of 18F distribution. Furthermore, the pattern shown in Figure 3, which is the desired pattern if 18F-FDG represents inflammation in the cardiac-suppressed tissue after MI, is not necessarily the pattern seen even in tissue that is reasonably well perfused—that is, that does not have evidence of MO. Our results are mixed, with clear evidence that the uptake of 18F-FDG may be at variance with the degree of inflammation as measured with 111In-labeled white blood cells after myocardial infarction.
In 7 of 9 animals, 111In cps/g increased linearly as the 18F cps/g increased, suggesting that in these animals, 18F-FDG was increasing as the number of white blood cells was increasing. However, in only 4 of these animals was the 111In/18F ratio independent of the partition coefficient in non-MO tissue. In the other 3 animals, the slope was significantly positive in 2 and negative in 1, indicating that although 18F was increasing as 111In was increasing the ratio was not independent of  (i.e., 18F-FDG was underestimating in 2 and overestimating in 1 the number of inflammatory cells).
The potential explanations for this disconnect between indium concentrations, reflective of the presence of inflammatory cells injected back into circulation 1 d earlier, and the 18F-FDG concentrations in myocardial tissue may be due to the markedly compromised perfusion to the MO zone reducing the availability of 18F-FDG to inflammatory cells. After a single bolus injection, the concentration of 18F-FDG rapidly declined. In the setting of markedly reduced flow, there may have been insufficient opportunity for inflammatory cells to take up the tracer, whereas indium-labeled white blood cells had been circulating between 21 and 28 h before animal sacrifice and tissue harvesting. In contrast, in areas of infarction in which perfusion was not severely compromised, our results indicated that although 18F-FDG accumulation increased as 111In increased it may not increase proportionately, suggesting that the use of 18F-FDG imaging in these areas must be interpreted as a nonquantitative indicator of the degree of inflammatory cell activity.
One potential limitation of our study relates to the validity of the measurement of  as an indication of the value of
  . This association may have a small uncertainty because the 99mTc-DTPA was injected into the live animal on average 6 min (range, 5–7 min) after the gadolinium-DTPA injection. Hence, 99mTc-DTPA had 6 min less time to penetrate areas of MO, possibly resulting in an underestimation of the partition coefficient in some infarcted tissue samples.
A limitation of our work relates to the interpretation of the results given the potential difference between the nature of the white blood cells labeled with 111In that accumulate in the infarct region and normal myocardium versus those that take up 18F-FDG. There is evidence in dogs that neutrophil density peaks in reperfused infarcted myocardium within 1 d, with low concentrations by day 7, whereas macrophage concentration peaks around 7 d after infarction (12). Because in blood the number of neutrophils exceeds the number of monocytes by a factor of approximately 10, it is difficult to conclude what fraction of the labeled white blood cells in the infarcted myocardium is 111In-labeled neutrophils or 111In-labeled monocytes. This difficulty is further confounded because it is generally assumed that monocytes are transformed to macrophages (2) and then replicate and accumulate in the infarct region. These transformed monocytes, even if still labeled with 111In, would have the amount of label per cell diluted during replication. In addition, we do not know to what extent neutrophils within the region of MO would be labeled by 18F-FDG as well as macrophages. Adding to this is the growing evidence that an appreciable fraction of the macrophages that accumulate in the infarcted region may not be transformed monocytes but rather resident macrophages in the myocardium (13,14).
The study design could have been improved by measuring blood flow using microspheres in the tissue samples. However, the absence of MR imaging contrast after a bolus injection has become an accepted, albeit qualitative, standard. We have characterized tissue blood flow in these 2 animal models using microspheres in the past (15,16).
Although we have followed in detail 111In-oxine labeling of white blood cells (10), we achieved lower-than-normal labeling efficiencies. Because the greatest discrepancy between the 111In counts and 18F counts was in subject PO1, which had the highest labeling efficiency of 83%, we do not believe that the low labeling efficiencies affected the conclusions drawn from our results.
CONCLUSION
Our results suggest some limitations regarding the use of a bolus injection of 18F-FDG to study the inflammatory process after myocardial infarction even when active uptake of 18F-FDG in normal myocardial tissue is suppressed. In the presence of large regions of MO, 18F-FDG may not reliably and accurately represent the degree of inflammatory cell activity, possibly due to compromised delivery. Further, even in areas of infarction without MO, the degree of inflammation may be underestimated or even overestimated, the reasons for which remain, at this time, unknown.
DISCLOSURE
The costs of publication of this article were defrayed in part by the payment of page charges. Therefore, and solely to indicate this fact, this article is hereby marked “advertisement” in accordance with 18 USC section 1734. Drs Prato and Wisenberg receive in-kind research support from Bayer Inc. No other potential conflict of interest relevant to this article was reported.
Acknowledgments
We gratefully acknowledge the contribution of the Siemens Works-In-Progress development team, in particular Dr. Andreas Greiser, and we thank Shelagh Ross for manuscript preparation.
Footnotes
Published online Jan. 8, 2015.
- © 2015 by the Society of Nuclear Medicine and Molecular Imaging, Inc.
REFERENCES
- Received for publication August 27, 2014.
- Accepted for publication December 10, 2014.


Jump to section
Related Articles
Cited By...
- Molecular Imaging of Myocardial Inflammation With Positron Emission Tomography Post-Ischemia: A Determinant of Subsequent Remodeling or Recovery
- Building a Unified Mechanistic Insight Into the Bimodal Pattern of Edema in Reperfused Acute Myocardial Infarctions: Observations, Interpretations, and Outlook