


Abstract
In glioma of World Health Organization (WHO) grade II (low-grade glioma), the natural course of a particular patient is not predictable and the treatment strategy is controversial. We determined prognostic factors in adult patients with untreated, nonenhancing, supratentorial low-grade glioma with special regard to PET using the amino acid O-(2-18F-fluoroethyl)-l-tyrosine (18F-FET) and MRI. Methods: In a prospective study, baseline 18F-FET PET and MRI analyses were performed on 33 consecutive patients with histologically confirmed low-grade glioma. None of the patients had radiation or chemotherapy. Clinical, histologic, therapeutic (initial cytoreduction vs. biopsy), 18F-FET uptake, and MRI morphologic parameters were analyzed for their prognostic significance. Statistical endpoints were clinical or radiologic tumor progression, malignant transformation to glioma of WHO grade III or IV (high-grade glioma), and death. Results: Baseline 18F-FET uptake and a diffuse versus circumscribed tumor pattern on MRI were highly significant predictors of prognosis (P < 0.01). By the combination of these prognostically significant variables, 3 major prognostic subgroups of low-grade glioma patients could be identified. The first of these subgroups was patients with circumscribed low-grade glioma on MRI without 18F-FET uptake (n = 11 patients, progression in 18%, no malignant transformation and no death). The second subgroup was patients with circumscribed low-grade glioma with 18F-FET uptake (n = 13 patients, progression in 46%, malignant transformation to a high-grade glioma in 15%, and death in 8%). The third subgroup was patients with diffuse low-grade glioma with 18F-FET uptake (n = 9 patients, progression in 100%, malignant transformation to a high-grade glioma in 78%, and death in 56%). Conclusion: We conclude that baseline amino acid uptake on 18F-FET PET and a diffuse versus circumscribed tumor pattern on MRI are strong predictors for the outcome of patients with low-grade glioma.
- low-grade glioma
- prognosis
- amino acid PET
- O-(2-18F-fluoroethyl)-l-tyrosine (18F-FET)
- circumscribed lesion
- diffuse lesion
Gliomas of WHO grade II (low-grade gliomas) account for approximately 15% of all astrocytic and oligodendroglial gliomas (1). Although some patients with low-grade glioma have stable disease and an excellent quality of life for decades without therapy, others experience rapid tumor progression and a poor prognosis. Epidemiologic data indicate that longer survival is associated with factors such as younger age, histologic type, and surgical treatment (2). The radical resection of low-grade glioma in noneloquent areas has proven to increase life expectancy (3–8). In small tumors, up to a diameter of 3 cm, interstitial radiosurgery (brachytherapy with radioactive seeds) reaches results that are comparable to those of radical tumor resection (9).
Moreover, the presence of chronic epilepsy in the absence of focal neurologic deficits has been described as a factor associated with favorable outcome (3). Risk factors for an unfavorable outcome include a tumor volume of more than 20 mL with a consecutive mass shift, contrast enhancement on MRI, and a gemistocytic astrocytic histologic type (9,10).
Nevertheless, the natural course of disease is not yet predictable in individual patients, and the treatment strategy remains controversial (11,12). A better stratification between patients with clinically indolent tumors and patients with aggressive tumors would be of paramount importance for optimal treatment.
Metabolic imaging using PET and 18F-FDG is helpful for identifying malignant transformation in cerebral gliomas; however, 18F-FDG uptake is generally low in low-grade glioma (13). In contrast, uptake of radiolabeled amino acids is increased in approximately two thirds of low-grade glioma, and a prognostic role for amino acid PET in low-grade glioma has been proposed (14,15). O-(2-18F-Fluoroethyl)-l-tyrosine (18F-FET) is a new PET tracer that—in contrast to other amino acid tracers—fulfills all requirements for routine clinical application, similar to the widely used 18F-FDG (16). In this prospective study, we evaluated the prognostic role of MRI and 8F-FET PET in adults with untreated supratentorial low-grade glioma.
MATERIALS AND METHODS
Patient Population
Within the 7-y period of 1999–2005, a group of 33 consecutive patients with low-grade glioma were included in the study. All had newly diagnosed, previously untreated supratentorial low-grade glioma without signs of blood–brain barrier disruption on contrast-enhanced MRI. Patients with infratentorial, thalamic, and hypothalamic tumors; children; and patients with low-grade glioma with contrast enhancement on MRI were excluded because of their different biologic and prognostic behavior. All patients were eligible for elective treatment planning—that is, were in stable clinical and neurologic condition without signs or symptoms of increased intracranial pressure. Detailed information on the individual patients is given in Tables 1 and 2. The study was approved by the university ethics committee and federal authorities. All subjects gave written informed consent for their participation in the study.
Prognostic Variables
Course and Outcome
Thirteen of the patients were female and 20 were male; age at diagnosis ranged from 27 to 65 y, with a mean of 40.9 y. Karnofsky performance status ranged from 90% to 100%, with a mean of 93%. Initial symptoms were seizures in 28 patients (85%), unspecific symptoms in 3 patients (9%), and focal neurologic deficits in 2 patients (6%).
The histologic diagnosis of low-grade glioma was established in all patients on tissue samples obtained by neuronavigated biopsy as described previously (17,18). In short, PET images were coregistered with MR images using dedicated software (MPI tool 3.28; ATV) and transferred to the neuronavigation system (Vector Vision; BrainLab). For coregistration, anatomic landmarks and external cutaneous fiducial markers were used in each examination. Neuronavigated biopsy samples were taken of FET-positive lesions from the area with maximal FET uptake. For FET-negative lesions, biopsy samples were taken only from areas showing an abnormal MRI signal.
Diffuse astrocytoma was diagnosed in 27 patients (82%), oligodendroglioma in 4 (12%), and oligoastrocytoma in 2 (6%). Subsequent first-line cytoreductive surgery was recommended in all patients with space-occupying tumors causing a clinically significant mass shift or tumors in noneloquent areas. According to these criteria, open surgery was offered to 20 patients, but 8 patients refused. Thus, surgery was performed on the remaining 12 patients. In 3 patients, resection was classified as “total” (>90% of the tumor volume was resected); in 6 patients, “subtotal” (50%–90% of the tumor mass was resected); and in 3 patients, “partial” (<50% of the tumor mass was resected). None of the patients received radiotherapy or chemotherapy as first-line therapy after biopsy or resection. Clinical and MRI follow-up was performed at regular intervals of 3–4 mo. The endpoints of course and outcome were tumor progression, malignant transformation to a glioma of WHO grade III or IV (high-grade glioma), and death of the patient.
Tumor progression was defined as clinical or radiologic deterioration. Symptoms and signs of clinical deterioration included new onset or aggravation of preexisting focal deficits or new onset of symptoms of increased intracranial pressure. Increased seizure activity was not regarded as a symptom of tumor progression. Radiologic deterioration was defined as a new onset of contrast enhancement within the tumor, significant enlargement of more than 20% of the initial tumor volume, or an increasing mass shift.
MRI
MRI was performed on a 1.5-T system (Sonata; Siemens). The imaging protocol consisted of a T1-weighted 3-dimensional magnetization-prepared rapid-acquisition gradient-echo sequence (field of view, 25 cm; matrix, 205 × 256; repetition time, 2,200 ms; echo time, 3.9 ms; inversion time, 1,200 ms; flip angle, 15; number of slices, 128; slice thickness, 1.5 mm; slice gap, 0 mm; number of averages, 1; time of acquisition, 6:38 min) before and 2 min after injection of 20 mL of gadolinium-diethylenetriaminepentaacetic acid (Magnevist; Schering) and a transversal fluid-attenuation inversion-recovery (FLAIR) sequence (field of view, 25 cm; matrix, 205 × 256; repetition time, 9,000 ms; echo time, 119 ms; inversion time, 2,500 ms; flip angle, 90; number of slices, 25; slice thickness, 5 mm; slice gap, 0 mm; number of averages, 2; time of acquisition, 4:32 min).
MRI scans were assessed by a senior neuroradiologist and 2 experienced senior neurosurgeons and scored by consensus. None of the tumors showed significant contrast enhancement after injection of gadolinium-diethylenetriaminepentaacetic acid. The tumor size was difficult to measure reliably because volumetric assessment was possible only for circumscribed tumors with well-defined borders—not for diffuse lesions. For semiquantitative evaluation, tumor size was estimated by the maximal cross-sectional diameter of the hypointense area on the T1-weighted images with respect to the hyperintensity on the FLAIR sequence. Tumors with a diameter greater than 30 mm were classified as large. According to their appearance on MRI, the tumors were classified as circumscribed in 24 patients (73%) and diffuse in 9 patients (27%). Circumscribed tumors were characterized by a homogeneous structure and sharp borders that were identical on T1- and T2-weighted images. Diffuse tumors showed an inhomogeneous signal pattern and poorly defined borders on MRI. In these tumors, the extent of hyperintensity on T2-weighted sequences was generally larger than the area of hypointensity on T1-weighted, indicating perifocal edema. Displacement of the brain midline by more than 2 mm was classified as a mass shift.
18F-FET PET
The patients were examined by 18F-FET PET within 6 wk after the initial diagnosis and no more than 3 wk before the neuronavigated biopsy. The amino acid 18F-FET was produced via phase transfer–mediated nucleophilic 18F-fluorination of N-trityl-O-(2-tosyloxyethyl)-l-tyrosine tert-butyl ester and subsequent deprotection (19). The uncorrected radiochemical yield was about 35% at a specific radioactivity of more than 200 GBq/μmol and a radiochemical purity of more than 98%. The tracer was administered as an isotonic neutral solution. PET studies were acquired 15–40 min after the intravenous injection of 200 MBq of 18F-FET. The measurements were performed on an ECAT scanner with 32 rings and an axial field of view of 15.5 cm (EXACT HR+; Siemens Medical Systems), in 3-dimensional mode. For attenuation correction, transmission scans with three 68Ge/68Ga rotating line sources were measured. After correction for random and scattered coincidences and dead time, image data were obtained by filtered backprojection in Fourier space using the ECAT 7.2 software (direct inverse Fourier transformation; Shepp filtering [2.48 mm in full width at half maximum]; pixel size, 2 × 2 × 2.4 mm). The reconstructed images were decay-corrected; the reconstructed image resolution was about 5.5 mm.
Preoperative MR images and 18F-FET PET images were coregistered and evaluated using regions of interest (ROIs) and dedicated software (MPI tool, version 3.28; ATV). For tumors with increased 18F-FET uptake, the transaxial slice showing the highest tumor intensity was chosen and an isocontour region around the tumor maximum was drawn automatically using a cutoff of 3 SDs above the average activity in the reference region. A larger reference ROI was placed on the contralateral hemisphere in an area of normal-appearing brain that included white and gray matter. Because one third of the low-grade glioma exhibited indifferent 18F-FET uptake, an objective positioning of the ROI on the PET scan based on threshold values was impossible. Therefore, a single irregular ROI was placed manually in an area of signal abnormality on the T1- and T2-weighted transversal MRI scan and transferred to the coregistered 18F-FET PET scan in each case. Mean and maximal lesion-to-brain ratios were calculated by dividing the mean and maximal ROI value (Bq/mL) of the lesion by the mean ROI value of normal brain in the 18F-FET PET scan. In a previous biopsy-controlled study, we found for tissue samples corresponding to normal and peritumoral tissue a mean lesion-to-brain ratio of 1.2 ± 0.4 for 18F-FET uptake (17,18). For prognostic purposes, however, a statistical preevaluation with different mean lesion-to-brain ratios identified a threshold value of 1.1 as optimal for predicting the course and outcome of the patients. Therefore, in this study, lesions with a mean lesion-to-brain ratio of 1.1 or less for tracer uptake were judged as 18F-FET–negative and lesions with a ratio of more than 1.1 as 18F-FET–positive. For the maximum lesion-to-brain ratios, a threshold value of 2.0 was chosen indicating hot-spot areas in the tumors.
Histopathology
Initial cytologic assessment was performed on touch preparations during biopsy to ensure representative tissue sampling for subsequent routine histologic preparations. The final diagnoses were established on formalin-fixed and paraffin-embedded tissue samples according to the WHO classification of tumors of the nervous system (20). Additional immunohistochemical analyses were performed with antibodies against the tumor suppressor protein p53 (Clone D07, primary antibody dilution: 1:100; Dako) and the proliferation-associated antigen Ki-67 (Clone Mib1, primary antibody dilution: 1:200; Dako) according to standard protocols. Immunohistochemical results were quantified using the following semiquantitative staining scores: for Ki-67, 0 (no positive tumor cells), 1 (<1% positive tumor cells), 2 (1%–5% positive tumor cells), or 3 (>5% positive tumor cells) and for p53, 0 (no positive tumor cells), 1 (individual positive tumor cells), 2 (moderate fraction of positive tumor cells [<50%]), or 3 (high fraction of positive tumor cells [≥50%]).
Statistical Analysis
The prognostic significance of various factors regarding the primary endpoints was determined using the Kaplan–Meier method and tested using censored linear rank tests, with each factor considered a separate, independent variable. The computations were done with the LIFETEST procedure of SAS system release 9.1 (SAS Institute Inc.). Probability values of less than 0.01 were considered significant. No correction for multiple statistical comparisons was done.
Two prognostically significant variables were identified that allowed for the definition of 3 prognostic groups. The homogeneity of the distributions of each of 3 variables—“time until progression,” “time until malignant transformation,” and “time until death”—over these groups was tested using the log-rank test. The rank tests for the association of these 3 variables with each of the other factors (Table 3) adjusted for group levels were not significant. Thereby, we excluded the possibility that the differences in clinical course and outcome between the 3 prognostic groups were influenced by a combination of other factors.
P Values from Univariate Analysis with Log-Rank Tests for Determining Prognostic Significance of Variables Regarding the 3 Follow-up Endpoints
RESULTS
Prognostic Factors
An overview of the distribution of the clinical MRI, morphologic, PET metabolic, histologic, and therapeutic variables and the data on the patients' clinical courses and outcomes is given in Tables 1 and 2. The results of the statistical analysis are given in Table 3. A significant influence on the course of the disease was found for 2 prognostic variables only. The first of these—circumscribed versus diffuse tumor growth on baseline MRI—reached the highest level of significance, with P values of less than 0.0001 for time until progression, less than 0.0001 for time until malignant transformation, and 0.008 for time until death. The second of the significant variables was mean 18F-FET uptake on baseline PET, with P values of 0.001 for time until progression and 0.006 for time until malignant transformation. Statistical significance was not reached for time until death (P = 0.06), but it is important to note that all 6 deaths occurred in patients with 18F-FET–positive tumors.
Prognostic Groups
Through the combination of the 2 significant prognostic variables, 3 major prognostic groups were identified: patients having circumscribed tumors without 18F-FET uptake (Fig. 1), patients having circumscribed tumors with 18F-FET uptake, and patients having diffuse tumors with 18F-FET uptake (Fig. 1). None of the patients had a diffuse tumor without 18F-FET uptake, thus excluding the creation of a fourth subgroup. Among the first, second, and third prognostic group, the number of patients (11, 13, and 9, respectively) and the average time of follow-up per patient (32, 26, and 29 mo, respectively) were fairly similar.

Examples of low-grade gliomas in prognostic groups A, B, and C. On the left are contrast-enhanced T1-weighted MR images, in the middle are T2-weighted MR images (FLAIR sequence), and on the right are 18F-FET PET images. Top row (prognostic group A) shows circumscribed tumors and no FET uptake, middle row (prognostic group B) shows circumscribed tumors with increased FET uptake, and bottom row (prognostic group C) shows diffuse tumors with increased 18F-FET uptake. Histopathology after biopsy showed diffuse astrocytoma of WHO grade II in each patient. None of the tumors showed contrast enhancement on T1-weighted MRI.
Statistical comparison of the 3 groups revealed significant differences in time until progression (P < 0.0001), time until malignant transformation (P < 0.0001), and time until death (P = 0.01) (Fig. 2). The rank tests for the association with each other factor proved that the differences between the 3 groups were not influenced by a combination of other factors. Figure 3 shows the Kaplan–Meier curves for time until progression in the 3 prognostic groups.
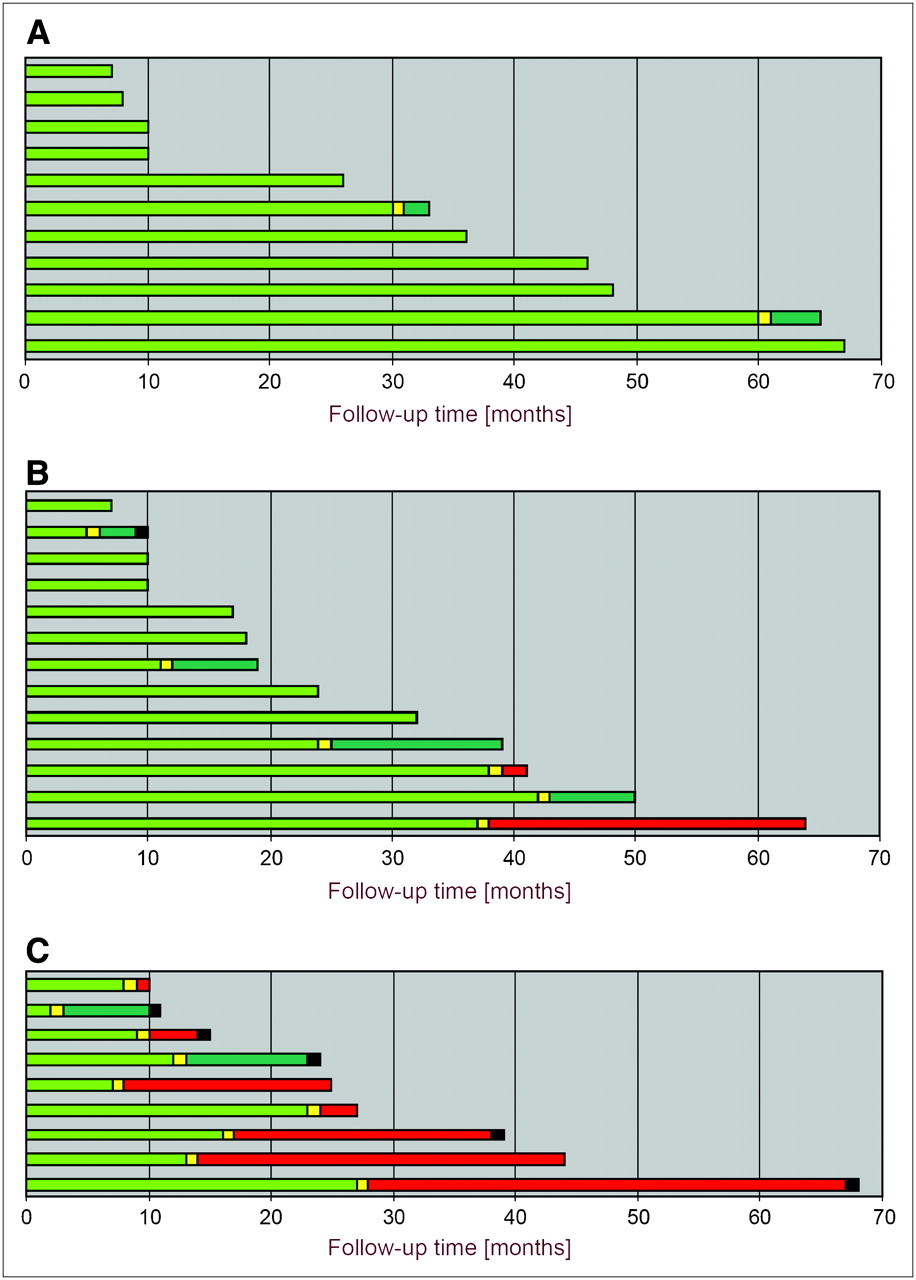
Graph of follow-up results for each patient. Green portion of each bar represents progression-free survival after initial diagnosis of low-grade glioma. Yellow portion indicates time of first tumor progression. If histology of low-grade glioma remained unchanged, color of bar stays green. If malignant transformation to high-grade glioma occurred, bar becomes red. Time of patient death is indicated by black portion of bar. (A) Prognostic group A, with favorable clinical course, rare progression of tumor (18%), and no malignant transformation or death during follow-up. (B) Prognostic group B, with less favorable clinical course, frequent tumor progression (46%), and sometimes early tumor progression. Small subsets of patients showed malignant transformation of tumors (15%) and/or died (8%) during follow-up. (C) Prognostic group C, with rapid clinical course and poor outcome, 100% tumor progression, and usually early tumor progression. Most patients showed malignant transformation of tumors (78%) and died of the disease (56%).
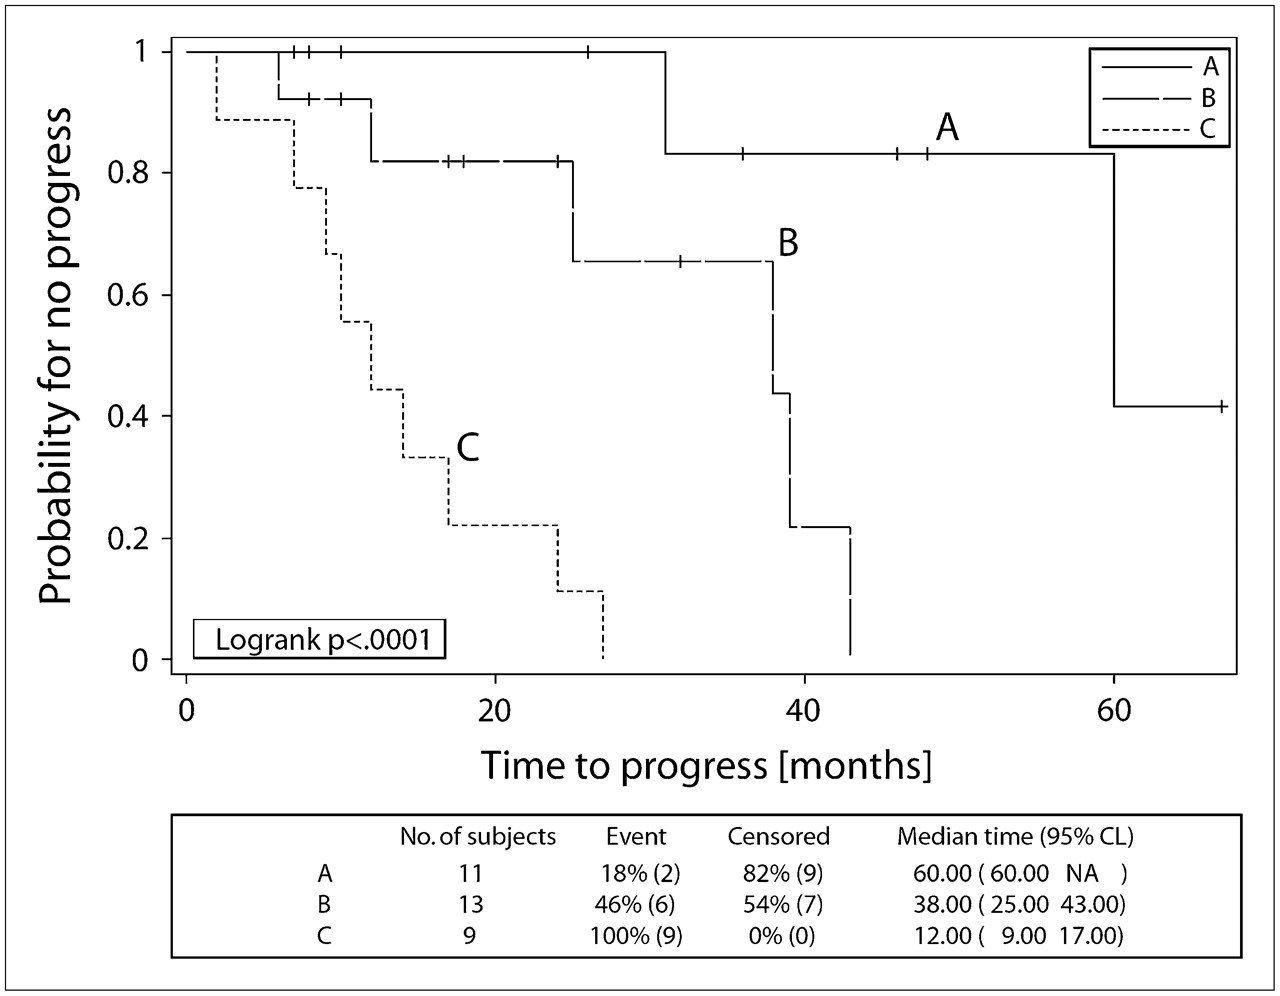
Example Kaplan–Meier plot of follow-up endpoint. Tumor progressed frequently (100%, n = 9) and early in prognostic group C, often (46%, n = 6) and sometimes early in prognostic group B, and rarely (18%, n = 2) and late in prognostic group A. Differences between the 3 groups were highly significant (P < 0.0001).
DISCUSSION
The clinical course and outcome of patients with supratentorial low-grade glioma may be highly variable. Several factors have been identified that are helpful for risk stratification, but a better identification of individuals with either a poor or a favorable prognosis is highly desirable to optimize treatment. Delayed or insufficient treatment of progressive lesions may shorten survival time, whereas too early aggressive treatment may cause unnecessary hospitalization and treatment-related morbidity.
Contrast enhancement on MRI is generally thought to indicate malignant transformation, although a considerable fraction of cases of WHO grade III glioma may lack enhancement (18,21). Because of the inability of conventional radiologic imaging to provide reliable prognostic information, several other imaging modalities are under evaluation for brain tumors.
PET using 18F-FDG is useful for identifying malignant transformation in cerebral gliomas, but 18F-FDG uptake in low-grade glioma is generally low and does not allow for further differentiation of these tumors (13). Radiolabeled amino acids, such as [11C-methyl]-l-methionine (MET), exhibit a variable uptake pattern in low-grade glioma (22), and low 11C-MET uptake before treatment was found to be an important prognostic factor in these tumors (14). Tumor resection was reported to be favorable in low-grade glioma exhibiting high 11C-MET uptake only (14). However, prospective studies dealing with these issues have not yet been published.
Unfortunately, the use of 11C-MET is restricted to few centers because of the short physical half-life of the 11C-label (20 min). In contrast, the amino acid 18F-FET fulfills all requirements for widespread clinical application, that is, efficient radiosynthesis, 18F labeling with a 109-min half-life, in vivo stability, and ideal tracer kinetics for brain tumor imaging (16,19,23,24). Results with 18F-FET PET in brain tumors are similar to those with 11C-MET (24,25), and the diagnostic potential of 18F-FET PET in brain tumors is well documented—for example, a superior delineation of human gliomas by 18F-FET PET compared with MRI (17), a high specificity for the detection of gliomas and biopsy site planning (18), and a reliable distinction between tumor recurrence and benign posttherapeutic changes (26).
The aim of this prospective study was to investigate the prognostic role of baseline 18F-FET uptake in newly diagnosed low-grade glioma in relation to other prognostic parameters. We found that approximately two thirds of patients with low-grade glioma exhibited an increased 18F-FET uptake compared with that in normal brain tissue, whereas one third of patients showed 18F-FET uptake equal to or even less than that in normal brain tissue, a finding similar to previously observed results with 11C-MET (22). In a statistical preevaluation, we found no significant prognostic difference between low-grade glioma with high 18F-FET uptake (mean tumor-to-brain ratio > 2.5), low-grade glioma with moderate uptake (mean tumor-to-brain ratio of 1.6–2.5), and low-grade glioma with low uptake (mean tumor-to-brain ratio < 1.5). Also, the maximum tumor-to-brain ratio (18F-FET uptake within hot-spot areas of the tumor) at a threshold of 2.0, which has been shown to be useful in separating recurrent gliomas from unspecific posttherapeutic changes (26), showed no significant effect on patient course and outcome. The further evaluation of different thresholds for low-grade glioma yielded significant prognostic differences in the mean tumor-to-brain ratio at thresholds of 1.1, 1.3, and 1.5, with a threshold of 1.1 providing the highest significance with regard to prognosis. It appears that the qualitative feature of increased 18F-FET uptake itself is a more important prognostic factor than the degree of 18F-FET uptake; that is, the most favorable prognosis for low-grade glioma is associated with an 18F-FET uptake the same as or less than that of the surrounding brain tissue. Once a low-grade glioma exhibits increased 18F-FET uptake, there seems to be a change in the biologic behavior, which is associated with a poor prognosis.
Somewhat unexpected was the observation that the MRI morphologic variable of a circumscribed versus diffuse tumor appearance had a highly significant influence on patient clinical course and outcome. Well-circumscribed low-grade glioma (prognostic groups A and B in Fig. 1) can be considered the “typical” low-grade glioma, with a homogeneous and usually large lesion that can be diagnosed on MRI at first view. In contrast, diffuse low-grade glioma (prognostic group C in Fig. 1) represent a less typical low-grade glioma variant with an inhomogeneous, often small lesion that is difficult to assess because of the blurred tumor margins. The “diagnosis” of these tumors on the basis of the MRI scan is challenging.
Combination of 2 parameters—baseline 18F-FET uptake at a threshold of 1.1 for mean tumor-to-brain ratio, and a diffuse versus circumscribed tumor pattern on MRI—revealed 3 major prognostic groups of patients (Fig. 1), and the statistical analysis proved that they had significant survival differences. Patients in prognostic group A, with circumscribed, 18F-FET–negative low-grade glioma, generally showed a stable long-term clinical course and long survival without malignant transformation (Fig. 2A). Either total resection in cases of noneloquent tumor location, or otherwise biopsy and MRI follow-up, seems to be the appropriate therapy for these patients. Patients in prognostic group B had circumscribed, 18F-FET–positive tumors. A fraction of these patients exhibited a poorer overall prognosis and early progression and malignant transformation to a high-grade glioma (Fig. 2B). Surgical resection should be attempted in these patients. Patients in prognostic group C had diffuse tumors with 18F-FET uptake invariably associated with early progression, as well as frequent malignant transformation to high-grade glioma and death. Thus, cytoreductive surgery should always be attempted and adjuvant radiotherapy or chemotherapy should be considered in these patients. In addition, short follow-up intervals are warranted.
Except for these 2 survival factors, all other clinical and histologic variables tested in our study did not show a significant prognostic value, probably because of the relatively small number of patients. In contrast, the MRI- and 18F-FET PET–based stratification of patients revealed clear prognostic differences, thus underlining the robustness and paramount clinical significance of this approach. Although MRI is widely available, the PET tracer 18F-FET is not yet commonly on hand. 18F-FET, however, fulfills all the requirements for becoming established on a widespread clinical scale within a short time.
Although tumor biopsy samples were taken using state-of-the-art methods, cell clones with a higher grade of malignancy might have been missed on the initial biopsy in some cases because of the limited tissue sampling. The proceedings in our study, however, reflect the situation under routine conditions, and the significance of our results for clinical practice is not affected. Especially, none of the WHO II astrocytomas in group A showed malignant transformation within the period of observation.
A study period of 7 y represents a long time for a clinical investigation, but a follow-up of 10–15 y will be necessary to cover the average course of low-grade gliomas. Further patient follow-up is needed to evaluate overall survival data, and the recruitment of larger patient cohorts will help to generate additional data about the prognostic value of other potentially relevant parameters.
Recently, it was observed that a dynamic acquisition of 18F-FET uptake may be helpful in differentiating between high-grade and low-grade gliomas (27,28). Although low-grade gliomas exhibited increasing lesion-to-brain ratios from 0 to 10 min after injection, compared with 30–40 min after injection, decreasing lesion-to-brain ratios were observed for high-grade gliomas. Dynamic data are not available for the present study but may be helpful in further studies to attain additional prognostic information from 18F-FET PET data.
CONCLUSION
Our data indicate the existence of 2 strong predictors in determining the clinical course and outcome of adults with newly diagnosed, nonenhancing supratentorial low-grade glioma of WHO grade II: the morphologic feature of circumscribed versus diffuse tumor growth on baseline MRI, and the metabolic feature of the mean 18F-FET uptake on baseline PET. The combination of these 2 variables defined 3 prognostically distinct groups of patients with low-grade glioma. Assignment of patients to these prognostic groups may allow for individually optimized and prognosis-related clinical management and therapy.
Acknowledgments
The authors thank Suzanne Schaden, Elisabeth Theelen, Barbara Elghahwagi, and Gabriele Oefler for assistance in the patient studies and Dr. Kurt Hamacher, Sascha Rehbein, Silke Grafmüller, and Erika Wabbals for radiosynthesis of 18F-FET. This work was supported by the Brain Imaging Center West (BICW) and by a grant (70-3088-Sa I) from the Deutsche Krebshilfe to two of the authors. The facility for MRI at the Institute of Medicine–Research Center Juelich was supported by the Bundesministerium für Bildung und Forschung (grant BMBF 01GO0104).
Footnotes
-
COPYRIGHT © 2007 by the Society of Nuclear Medicine, Inc.
References
- Received for publication November 6, 2006.
- Accepted for publication January 2, 2007.


Jump to section
Related Articles
Cited By...
- Spatial Relationship of Glioma Volume Derived from 18F-FET PET and Volumetric MR Spectroscopy Imaging: A Hybrid PET/MRI Study
- Influence of Bevacizumab on Blood-Brain Barrier Permeability and O-(2-18F-Fluoroethyl)-L-Tyrosine Uptake in Rat Gliomas
- Serial 18F-FET PET Imaging of Primarily 18F-FET-Negative Glioma: Does It Make Sense?
- Prediction of Glioma Recurrence Using Dynamic 18F-Fluoroethyltyrosine PET
- A Meta-Analysis on the Diagnostic Performance of 18F-FDG and 11C-Methionine PET for Differentiating Brain Tumors
- Value of 18F-3,4-Dihydroxyphenylalanine PET/MR Image Fusion in Pediatric Supratentorial Infiltrative Astrocytomas: A Prospective Pilot Study
- Comparison of 18F-FET PET and Perfusion-Weighted MR Imaging: A PET/MR Imaging Hybrid Study in Patients with Brain Tumors
- Focal Changes in Diffusivity on Apparent Diffusion Coefficient MR Imaging and Amino Acid Uptake on PET Do Not Colocalize in Nonenhancing Low-Grade Gliomas
- Dynamic 18F-FET PET in Newly Diagnosed Astrocytic Low-Grade Glioma Identifies High-Risk Patients
- Diagnostic Performance of 18F-FET PET in Newly Diagnosed Cerebral Lesions Suggestive of Glioma
- Role of O-(2-18F-Fluoroethyl)-L-Tyrosine PET for Differentiation of Local Recurrent Brain Metastasis from Radiation Necrosis
- Performance of 18F-Fluoro-Ethyl-Tyrosine (18F-FET) PET for the Differential Diagnosis of Primary Brain Tumor: A Systematic Review and Metaanalysis
- Classification of Peritumoral Fiber Tract Alterations in Gliomas Using Metabolic and Structural Neuroimaging
- Comparison of O-(2-18F-Fluoroethyl)-L-Tyrosine and L-3H-Methionine Uptake in Cerebral Hematomas
- Prognostic Value of 18F-Fluoroethyl-L-Tyrosine PET and MRI in Small Nonspecific Incidental Brain Lesions
- Metabolic Imaging of Cerebral Gliomas: Spatial Correlation of Changes in O-(2-18F-Fluoroethyl)-L-Tyrosine PET and Proton Magnetic Resonance Spectroscopic Imaging
- Differential Uptake of O-(2-18F-Fluoroethyl)-L-Tyrosine, L-3H-Methionine, and 3H-Deoxyglucose in Brain Abscesses