


Abstract
The aims of this study were to investigate and categorize peritumoral fiber tract alterations while considering changes in metabolism and integrity of fiber structures using multimodal neuroimaging—that is, PET with O-(2-18F-fluoroethyl)-l-tyrosine and diffusion tensor imaging evaluated by fiber density mapping—and to correlate categories of fiber alterations with preoperative neurologic deficits and postoperative course. Methods: We examined 26 patients with cerebral gliomas. Fiber density data were used to segment peritumoral fiber structures and were coregistered to anatomic MR images and PET data. Fiber density and O-(2-18F-fluoroethyl)-l-tyrosine uptake values were evaluated as ipsilateral-to-contralateral ratios. Four metabolic categories were defined on the basis of O-(2-18F-fluoroethyl)-l-tyrosine values: tumor-infiltrated tissue, reactive tissue (astrogliosis and microglial activation), normal brain tissue, and tissue with attenuated amino acid metabolism. Fiber density values were grouped in 3 categories for structural integrity: compressed, normal, and attenuated fibers. Results: We evaluated and classified 103 peritumoral fiber structures with 10 patterns of fiber tract alterations. Fiber structures in tumor-infiltrated, reactive, and normal brain tissue showed compressed fibers, displaced fibers, and (partly) destroyed fibers, respectively. Attenuated amino acid metabolism was associated only with attenuated fiber density. Thirteen patients showed white matter–related neurologic deficits (paresis, hypoesthesia, aphasia, or anopia) as initial symptoms. Three patients showed tumor infiltration in the corresponding fiber tracts; all the others had reactive or normal brain tissue. Fiber structures were compressed or attenuated but not normal. The 3 patients with tumor infiltration in the corresponding fiber tracts and 1 with compressed fibers in normal brain showed no improvements or worsening of the deficits in the postoperative course. Eight patients with the corresponding fiber tracts in reactive or normal brain areas showed improvement of deficits. One patient underwent biopsy only. Conclusion: Our multimodal neuroimaging approach provides complementary information and more detailed understanding of peritumoral fiber tract alterations in gliomas which are more complex as described so far. We presented a classification model for systematic assessment of these alterations that may be helpful for treatment planning and prediction of patients’ prognoses.
Gliomas are space-occupying lesions that originate within and propagate throughout the white matter (WM) of the brain. They produce symptoms by a combination of focal neurologic deficits from compression and infiltration of the surrounding brain, vascular compromise, or raised intracranial pressure. In clinical practice, anatomic images from MRI are used for detection, diagnosis, and treatment planning of brain tumors. Infiltration of tumor cells and reactive changes lead to both metabolic (1,2) and structural (3) changes in adjacent white brain matter. However, the main limiting factor of standard MRI methods is the lack of metabolic and structural information of the pathologic changes.
PET is to date the most powerful method for in vivo imaging of cancer metabolism. PET with 18F-FDG is well accepted in grading of brain tumors. However, 18F-FDG PET suffers from limitations in both sensitivity and specificity. Recent studies have shown that radiolabeled amino acid analogs such as O-(2-18F-fluoroethyl)-L-tyrosine (18F-FET) are more specific and sensitive tumor imaging agents because amino acid transport and protein metabolism are significantly upregulated in brain tumors in comparison with normal brain tissue and inflammatory sites (4,5).
MR diffusion tensor imaging (DTI) is the only in vivo method yet available for noninvasively studying the structure of brain WM by detection of directionality of water diffusion in the brain, which is fastest parallel to and slowest perpendicular to the fiber tract (6).
DTI data are usually evaluated by calculation of parametric maps of fractional anisotropy (FA), which describes the anisotropy of water diffusion (7), and manual segmentation of 2-dimensional regions of interest (ROIs) to investigate normal brain structures and pathologic processes (8). However, this strategy has limitations (9,10). FA is a measure for the fraction of the magnitude of the diffusion tensor in an individual voxel (11) but does not either consider surrounding structures or represent a specific marker for fiber density (FD) or myelination (12). Furthermore, single ROIs cannot provide reliable measures of integrity and functionality of WM structures (13,14). Fiber tracking is another method for DTI data processing (15) and enables us to understand 3-dimensional (3D) relationships between different fiber tracts, gray matter structures, or lesions (16). However, fiber tracts do not provide quantitative measures, the definition of appropriate seed ROIs for reconstruction of fiber bundles in the border zone and vicinity of brain tumors is sometimes difficult, and correct reconstruction of anatomic complex pathways (including crossing or branching fibers) is still problematic.
FD mapping (FDM), a new approach for postprocessing of DTI data, avoids these described pitfalls. It provides a quantitative 3D evaluation for the fiber structures of the whole brain. Furthermore, it includes all surrounding WM structures into the calculations of FD values for each voxel, which is as an indicator of the density of WM fibers within the bundle passing through a voxel (17). A recent study (18) demonstrated that FDM provides information complementary to FA maps or fiber tracking for the assessment of the glioma border zones. FD values additionally provide more histologic insight into the whole WM structure and showed stronger correlation with tumor infiltration than FA values.
The aims of this study were to correlate data about anatomy, metabolism, and integrity of WM in the border zone and vicinity of gliomas using multimodal neuroimaging methods (i.e., conventional MRI, FDM, and 18F-FET PET), categorize peritumoral fiber tract alterations while considering changes in metabolism and integrity of fiber structures, and correlate categories of fiber alterations with preoperative neurologic deficits and postoperative course.
MATERIALS AND METHODS
Patients
Twenty-six patients (mean age ± SD, 49 ± 15 y; age range, 23–78 y; 14 women and 12 men) with cerebral gliomas were included in this study. Five patients had a glioma World Health Organization (WHO) grade II, 8 patients had a glioma WHO grade III, 1 patient had a gliomatosis cerebri, and 12 patients had a glioblastoma multiforme WHO grade IV. The initial main symptoms were seizure in 10 patients, headache in 3, paresis in 4, hypoesthesia in 2, aphasia in 3, and anopia in 3. One patient showed paresis and anopia initially. All lesions were confirmed and classified histopathologically with tissue samples obtained from frameless stereotaxy according to the WHO brain tumor classification. PET was performed as part of the routine preoperative diagnostic workup of gliomas in our institution. Our institutional ethic committee gave its approval for the MRI experiments.
Data Acquisition
The MRI examinations were performed on a 1.5-T clinical whole-body scanner (Sonata; Siemens) equipped with the standard head coil. Details about the conventional MRI protocol, which consisted of T2-weighted turbo spin echo, fluid-attenuated inversion recovery (FLAIR), and T1-weighted 3D magnetization-prepared rapid-acquisition gradient echo sequences and details about the DTI sequence were described previously (18,19).
The 18F-FET PET examinations of the brain were performed on a partial-ring PET scanner (ECAT EMERGE; Siemens) equipped with lutetium oxyorthosilicate detectors 10 min after intravenous injection of 18F-FET (7 MBq/kg of body weight). Details for the technical performance of the scanner (20), synthesis of 18F-FET, and PET data acquisition (19) have been described recently.
Data Analysis
DTI data were transferred offline to a workstation (IBM ThinkPad T60p; Lenovo) for analysis. No motion, eddy-currents distortion, or susceptibility distortion corrections were performed on the DTI data. FDM was performed using DTI-Studio (version 3.0.1; Johns Hopkins University) (21). FDM is a 3-step postprocessing procedure consisting of diagonalization of the DTI raw data, reconstruction of the entirety of fiber structures using the fiber assignment by continuous tracking method (15), and calculation of FD maps. The number of fibers was calculated for each individual voxel in which fiber structures could be reconstructed. Details for the FDM procedure were published previously (18). Number of fibers in this context means the number of streamlines that were reconstructed and penetrate the voxel. Hence, this parameter not only includes the fibers started from the voxel but also includes the streamlines started from other voxels and passing through the voxel. Therefore, the number of fibers in an individual voxel measures the FD in this voxel. This parameter has to be interpreted as relative parameters and does not measure the true number of axons passing through a voxel.
For coregistration of T2-weighted MRI (turbo spin echo or FLAIR), 18F-FET PET, and FDM data, the individual datasets were previously coregistered to the 3D magnetization-prepared rapid-acquisition gradient echo dataset, using a rigid registration algorithm as part of the graphical image analysis tool Volume Imaging in Neurologic Research (Max-Planck-Institute for Neurologic Research) (22). The resulting merged dataset consisted of T1- and T2-weighted anatomic MR, PET, and FDM images.
After identification of the lesions on anatomic MR and PET images, ROIs were manually defined on FDM images to segment all fiber structures adjacent to the tumor area and the related fiber structures in contralateral normal WM, respectively. The ROIs were transferred to the coregistered PET and MRI datasets. Mean FD values and mean 18F-FET uptake values for the ROIs on the FDM and PET data, respectively, were calculated. These values were used for the calculation of ipsilateral-to-contralateral ratios (ICRs) of 18F-FET uptake (FET-ICR) and FD (FD-ICR), resulting in pairs of FET-ICR and FD-ICR values for each investigated fiber structure.
For determination of ranges of FET and FD ratio values between normal fiber structures in the contralateral and ipsilateral hemispheres, we evaluated fiber structures that were as far from the lesion as possible, using the same approach as described above. These findings, as well as the results of recently published studies (2,23), were used for the estimation of FET-ICR and FD-ICR limit values to group peritumoral fiber tract alterations.
RESULTS
Multimodal neuroimaging and coregistration of the postprocessed datasets were successfully performed in all 26 patients. To provide ranges of FET and FD ratio values for normal fiber structures, we investigated 92 fiber structures that were a sufficient distance from the lesions. This analysis revealed a range of FET ratio values (0.92–1.09) and FD ratio values (0.85–1.16). In combination with the findings of recently published studies (2,23), we defined the following limit values for FET-ICR and FD-ICR used for classification: FET-ICR of greater than 1.6 for tumor infiltrated tissue; FET-ICR of 1.6 or less and greater than 1.1 for tissue showing reactive changes, such as astrogliosis and microglial activation; FET-ICR of 1.1 or less and greater than 0.9 for normal brain tissue; FET-ICR of 0.9 or less for tissue with decreased amino acid metabolism; FD-ICR of greater than 1.15 for compressed fiber structures; FD-ICR of 1.15 or less and 0.85 or more for normal fiber structures, which were assumed to be altered only by displacement; and FET-ICR of less than 0.85 for attenuated fiber structures. For classification, we introduced a metabolic category based on these FET-ICR values and a category for the integrity of the fiber structure based on the FD-ICR values, respectively. Details for the categories are described in Table 1.
Description of Metabolic and Integrity Category for Classification of Peritumoral Fiber Tract Alterations in Gliomas
Classification of Peritumoral Fiber Tract Alterations
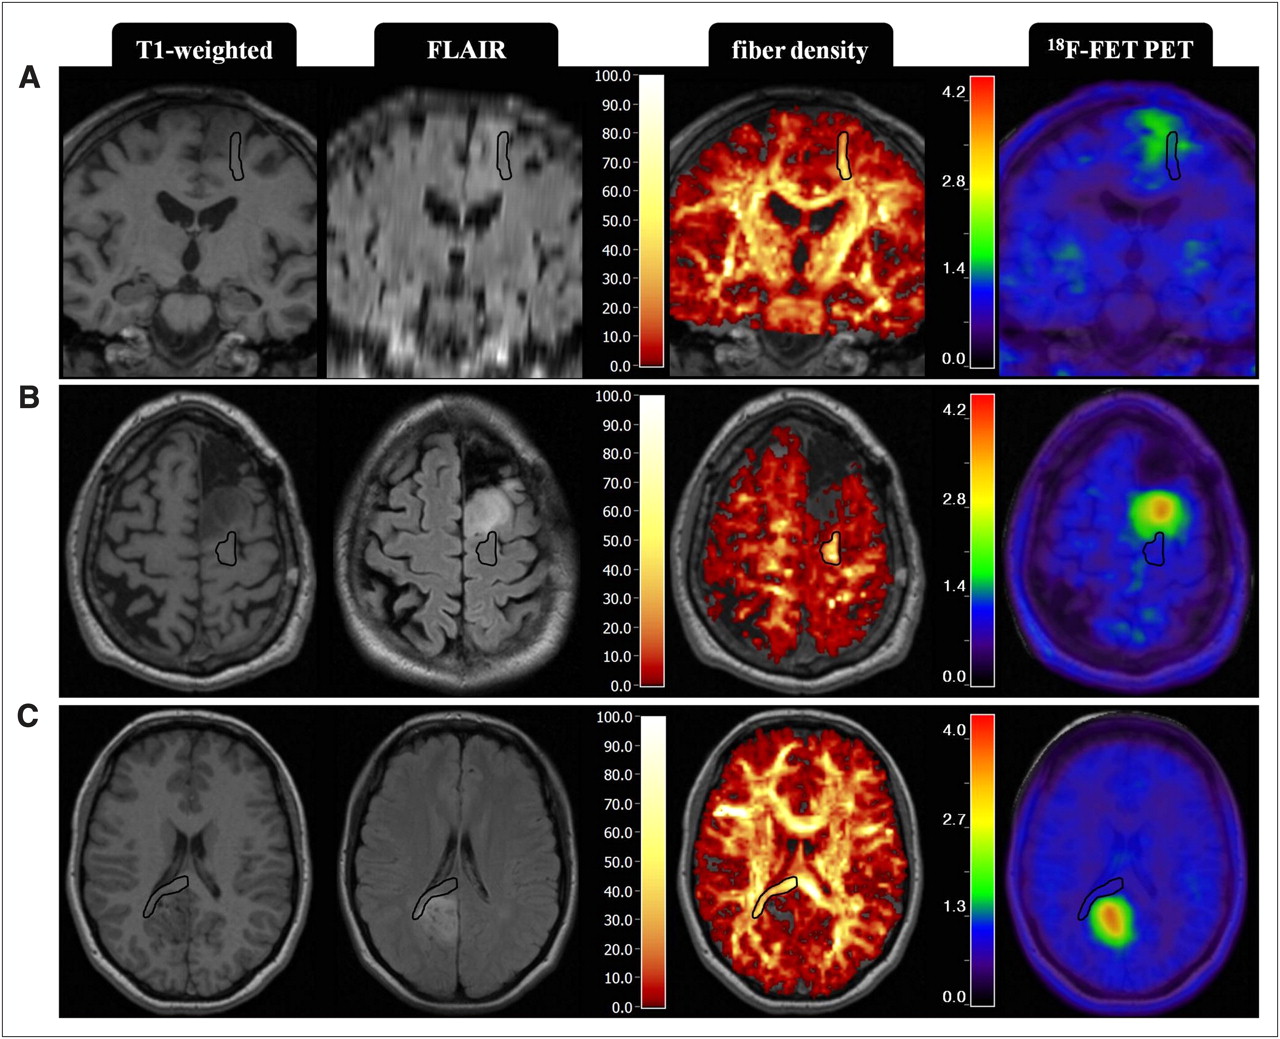
In all 26 patients, 103 peritumoral fiber structures were segmented, evaluated, and classified considering the limit values. In total, 24 fiber structures in 9 patients were identified in peritumoral regions, with an FET-ICR greater than 1.6 (metabolic T category) as an indication for tumor-infiltrated tissue. Among these, we detected 2 fiber structures in 2 patients that showed an FD-ICR of more than 1.15 (category for the integrity of the fiber structure, C)—that is, compressed fiber bundles with tumor infiltration, which nevertheless seem to be intact (Fig. 1A). Following our categories, this structure would then be classified as TC fibers (the metabolic category is written first and the structural integrity category is written second).

Categories of peritumoral fiber structures within tumor-infiltrated brain regions. Metabolic category of shown fiber structures is T. (A) Axial T1-weighted, FLAIR, color-coded FD, and 18F-FET PET images of 51-y-old woman with an astrocytoma WHO grade III. FET-ICR for this fiber structure was 1.81; FD-ICR was 1.31, resulting in a TC category for this fiber structure. (B) Axial T1-weighted, T2-weighted, color-coded FD, and 18F-FET PET images of 66-y-old man with a glioblastoma multiforme (patient 14, Table 3). FET-ICR for this fiber structure was 2.64; FD-ICR was 1.05, resulting in a TN category for this fiber structure. (C) Axial T1-weighted, T2-weighted, color-coded FD, and 18F-FET PET images of 48-y-old woman with oligodendroglioma WHO grade III (patient 10, Table 3). FET-ICR for this fiber structure was 1.79; FD-ICR was 0.20, resulting in a TA category for this fiber structure. Additionally overlaid on these images are manually defined ROIs (black dotted line) to segment fiber structures of TC category with FET-ICR of 1.92 and FD-ICR of 1.45 for this structure. FD and 18F-FET PET images are fused to T1-weighted MR image, with opacity of 100% and 75%, respectively. Overlaid on images are manually defined ROIs (black solid lines), which were defined on FDM images to segment fiber structures. Color codes are at left-hand margins, values at color bar of FD images are number of fibers per voxel, and values at color bar of 18F-FET images are FET-ICRs. T2w = T2-weighted.
For the fiber structures with a metabolic T category, we additionally found 7 structures in 5 patients with normal FD-ICR (Fig. 1B) (category, TN) and 15 structures in 6 patients with an FD-ICR less than 0.85 (category, TA) as an indicator for attenuated integrity of the fiber structure (Fig. 1C).
On this occasion, one has to state that each patient showed more than 1 category of peritumoral fiber tract alterations. Details for the fiber structure alterations of the T category are presented in the top section of Table 2. FD values of ipsilateral fiber structures ranged between 2 and 85 fibers per voxel (31 ± 16) and those in the contralateral hemisphere between 13 and 75 fibers per voxel (35 ± 15).
Details for Categories of Fiber Structure Alterations
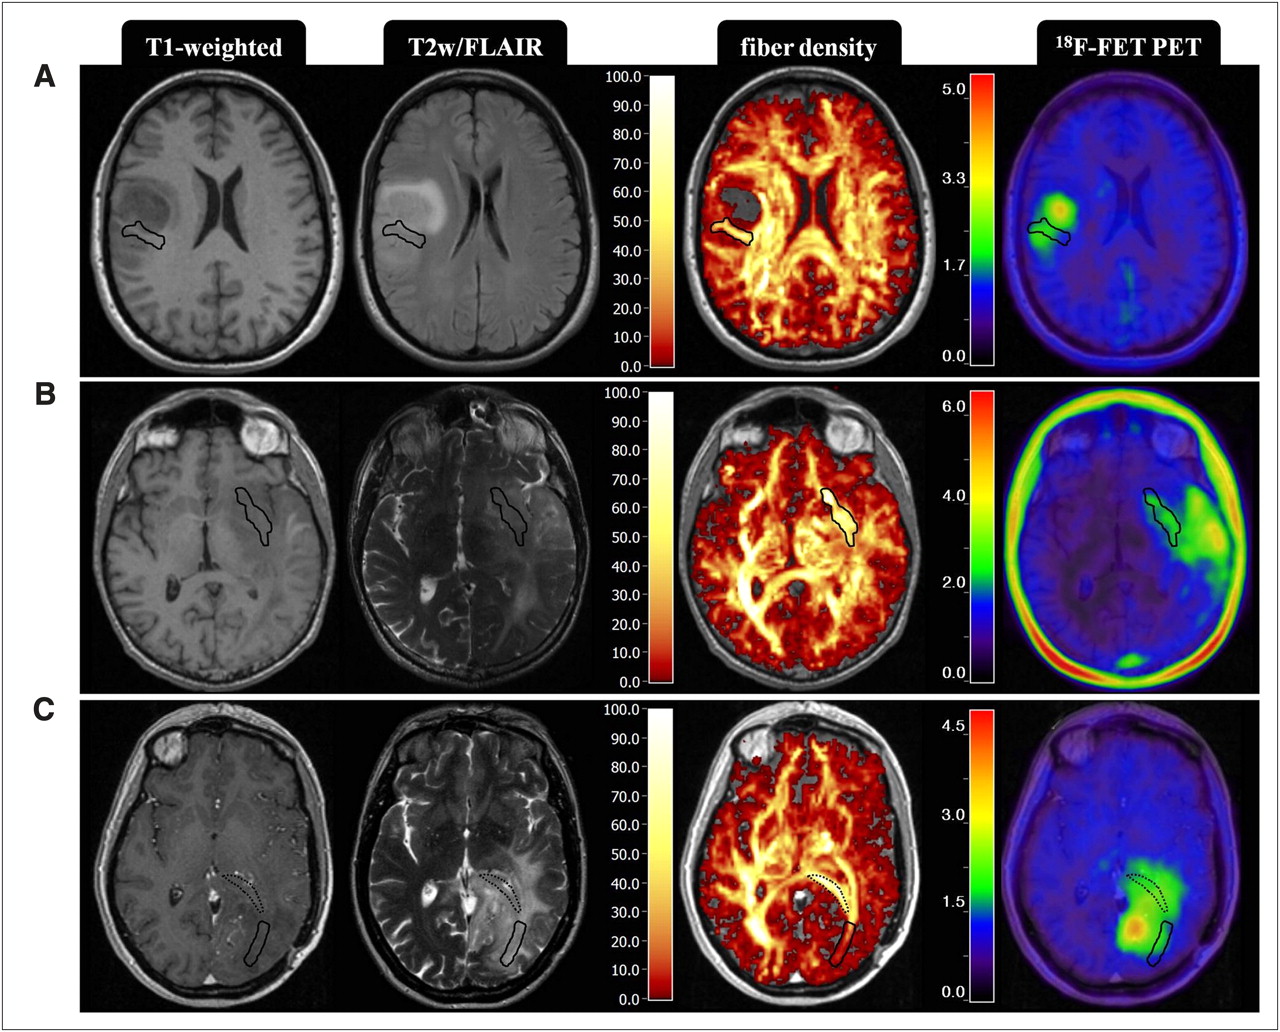
In peritumoral areas with an FET-ICR of 1.6 or less and greater than 1.1 as an indication for reactive changes (metabolic R category), such as astrogliosis or microglial activation, we detected 38 fiber structures in 20 patients. Again we identified fiber structures with an FD-ICR of greater than 1.15 as indicating compression of the fiber structures (RC fibers; Fig. 2A), fiber structures with an FD-ICR of less than 1.15 and greater than 0.85 as indicating normal fibers, (RN fibers; Fig. 2B), and fiber structures with an FD-ICR of less than 0.85 as indicating attenuation of the integrity of the fiber structures (RA fibers; Fig. 2C). Details for the fiber structures of the R category are presented in the second section of Table 2.
Categories of peritumoral fiber structures within brain regions showing reactive astrogliosis or microglial activation. Metabolic category of shown fiber structures is R. (A) Coronal T1-weighted, FLAIR, color-coded FD, and 18F-FET PET images of 54-y-old man with astrocytoma WHO grade III. FET-ICR for this fiber structure was 1.20; FD-ICR was 1.18, resulting in an RC category for this fiber structure. (B) Axial T1-weighted, FLAIR, color-coded FD, and 18F-FET PET images of same patient as in A. FET-ICR for this fiber structure was 1.23; FD-ICR was 0.98, resulting in an RN category for this fiber structure. (C) Axial T1-weighted, FLAIR, color-coded FD, and 18F-FET PET images of a 23-y-old woman with oligoastrocytoma WHO grade II. FET-ICR for this fiber structure was 1.27; FD-ICR was 0.57, resulting in a TA category for this fiber structure. FD and 18F-FET PET images are fused to T1-weighted MR image, with opacity of 100% and 75%, respectively. Overlaid on images are manually defined ROIs (black lines), which were defined on FDM images to segment fiber structures. Color codes are at left-hand margins, values at color bar of FD images are number of fibers per voxel, and values at color bar of 18F-FET images are FET-ICR values.
Examples for patients with peritumoral fiber structures in brain regions with normal FET-ICR (i.e., with an FET-ICR of 1.1 or less and greater than 0.9, also referred to as metabolic N category) are shown in Supplemental Figure 1 (supplemental materials are available online only at http://jnm.snmjournals.org). For this metabolic category, the alterations in FD also showed the gamut of already described changes. We detected 17 compressed fiber structures (with an FD-ICR of greater than 1.15) in 12 patients—that is, of the NC category. Furthermore, 11 structures in 7 patients showed both a normal FD ratio in a brain area with normal 18F-FET uptake ratio, which we therefore labeled NN fibers, and 9 fiber structures in 9 patients showed an attenuated integrity (NA fibers). Only 2 patients showed brain areas with distinctly decreased 18F-FET uptake, compared with the contralateral side. This attenuation in amino acid metabolism was associated with an attenuation of the integrity of the fiber bundles (Supplemental Fig. 2). Hence, only AA fibers were found and categorized. Details for the peritumoral fiber structures of N and A categories are presented in the third and fourth sections of Table 2, respectively.
Patients with White Matter–Related Neurologic Deficits (WMRDs)
Thirteen patients (mean age ± SD, 51 ± 15 y; age range, 23–72 y; 7 men and 6 women) showed paresis, hypoesthesia, aphasia, or anopia as initial main symptoms. We summarized these as WMRDs. We acknowledge, however, that these kind of neurologic deficits are possibly related to cortical impairments too. On the other hand, seizure and headache are solely caused by impairment of cortical structures or dural compression.
For the subgroup of patients with suspected WMRD, we investigated in more detail the alterations in the peritumoral structures of fiber tracts that were related to the neurologic deficits, for example, peritumoral fiber structures of the superior longitudinal fasciculus or arcuate fasciculus in patients with aphasia. All 13 patients showed at least 1 category of alterations in the corresponding fiber structure: 9 patients showed 1 category, 3 patients showed 2 different categories, and the 1 patient who showed initially 2 neurologic deficits (paresis and anopia) had 1 category (TA fibers) in both respective fiber structures. This resulted in overall 17 fiber structure alterations: 4 of category TA (tumor infiltrated with attenuated integrity), 1 of category RC and 5 of category RA (reactive metabolism with compressed and attenuated fibers), and 5 of category NC and 2 of category NA (normal metabolism with compressed and attenuated fibers). Interestingly, no category of fiber alterations with normal FD was detected.
The postoperative course over a period up to 6 mo was investigated to assess changes in neurologic deficits. Eight patients showed minor improvements up to almost complete regression of the deficits. The categories of peritumoral fiber structure alterations in these patients and in the corresponding WM fiber tracts were as follows: 4 fiber structures of RA, 4 of NC, and 2 of NA categories. Intraoperative anatomic MR and FD images of a patient with an astrocytoma WHO grade III are depicted in Supplemental Figure 3.
Three patients showed no improvements and 1 patient even a worsening of the neurologic deficits in the postoperative course. The alterations in the corresponding 6 peritumoral fiber structures were of the following categories: 4 fiber structures of TA (tumor metabolism and attenuated FD), 1 of RC (reactive metabolism and compressed fiber structure), 1 of RA (reactive metabolism and attenuated FD), and 1 fiber structure of NC (normal metabolism and compressed fiber structure) categories. The patient with the worsening of deficits showed TA and RC fibers.
One patient underwent frameless stereotactic biopsy only. The deficits of this patient remained unchanged. Details about the clinical characteristics of the patients with WMRDs, including the investigated fiber tract, the detected category of alterations, and the postoperative course, are depicted in Table 3.
Clinical Characteristics of Patients with WMRD
DISCUSSION
This study correlated information about anatomy, amino acid metabolism, and integrity of WM structures in the border zone and the vicinity of gliomas using multimodal neuroimaging data. We introduced a system for classification of these alterations while considering changes in amino acid metabolism and integrity of fiber structures. The classification system consisted of 10 categories composed of 4 metabolic (tumor, reactive, normal, and attenuated) and 3 structural integrity (compressed, normal, and attenuated) subcategories. In the subgroup of patients with neurologic deficits that might be WM-related, we correlated these deficits with the categories of alterations in corresponding fiber structures. After the postoperative course for these patients, we found that fiber structures in tumor-infiltrated (metabolic T category), reactive (metabolic R category), and normal brain tissue (metabolic N category), as well as compressed fiber structures (integrity category, C) and those with attenuated FD (integrity category, A), may be associated with these WMRDs but not fiber structures with normal FD (integrity category, N). Patients with fiber alterations of metabolic T category in the fiber tract, which was related to the WMRDs, showed no improvement or worsening of the deficits postoperatively. Patients with metabolic R and N categories, on the other hand, showed at least minor improvements. Therefore, this approach may be helpful for both preoperative planning and prediction of postoperative outcome—that is, neurologic deficits that are related to T fibers will certainly persist, whereas those related to R or N fibers have a chance for improvement or even complete regression. In this context, WM tracts with alterations of metabolic R and N categories could be interpreted as fiber structures at risk in preoperative planning.
Recent studies investigated WM structures in the vicinity of brain tumors using DTI in combination with color-coded FA maps. Field et al. (24) described 4 basic patterns of fiber tract alterations by qualitative analysis of tract location and calculation of FA values. A normal FA value with abnormal tract location or tensor directions was associated with displacement induced by space-occupation; a decreased FA with normal tract locations was observed in regions of vasogenic edema; a decreased FA with abnormal hues on directional color maps was speculated to be associated with tumor infiltration; and near isotropy diffusion was assigned to fiber tracts completely disrupted by tumor. The authors concluded that further study was needed to determine the clinical utility of their observations (25). However, they did not describe space-occupation–induced displacement and compression of fiber bundles, which is associated with increased anisotropy as described by others (3). These authors also did not include any metabolic information in their evaluation, which allows for, when compared with anatomically MR images, a more reliable identification of tumor infiltration and reactive changes. Furthermore, a mixture of these 4 (or 5) mechanisms may exist. This diversity leads to poor specificity of FA, which characterizes the eccentricity of the diffusion ellipsoid in a voxel (12), for characterization of WM changes.
Recent studies described strategies to overcome limitations. Lu et al. (26) introduced a tumor infiltration index that allowed them to distinguish presumed tumor-infiltrated edema of gliomas from purely vasogenic edema, which occurs in extraaxial lesions such as meningiomas and metastatic disease. Roberts et al. (17) established a so-called FD index as a quantitative description of the number of fiber paths traversing a manually defined ROI to encompass corticospinal and corticopontine fibers. Their approach included the methods of fiber tracking to obtain additional information for tissue characterization. However, the limitations of ROI-based evaluation strategies have to be considered for the FD index calculations. FD index values were not available for either the entire vicinity of the tumor or the contralateral normal WM. The approach by Roberts et al. also did not allow for a visual assessment of FD in the whole brain because it is possible with FD maps.
Here, using a multimodal neuroimaging approach for detection of both structural integrity and metabolism, we were able to investigate the relationship between the effects on the fiber structures—that is, the alterations to structures and their cause—in more detail.
Limitations of our study are related to the spatial distortions inherent in the echo-planar imaging sequence, so registration with the anatomic MR image data may have caused some inaccuracy, especially for fiber structures in most frontal brain regions. We tried to consider these errors by excluding these fiber structures from evaluation. The application of parallel imaging techniques would allow reduction in susceptibility artifacts. However, because of reduction in the signal-to-noise ratio involved with this technique, it would be necessary to apply higher magnetic field strengths. Additionally, a DTI sequence with diffusion gradient encoding in 6 directions introduces uncertainty to fiber tracking (27) aside from those of the FDM approach (18). The number of patients with WMRD was relatively small (n = 13), and the relationship between these deficits and the fiber tract alterations was not absolutely assured. The latter, however, is generally hard to achieve. One has also to consider that about one third of low-grade gliomas are negative on 18F-FET PET (28), and solid tumors may fall into the NN category. Further studies are required using our approach in combination with a more advanced design of the DTI experiments (more gradient directions) to investigate peritumoral regions of meningiomas, metastatic lesions, and gliomas in combination with histopathologic findings from stereotactic biopsies and a more detailed evaluation of the postoperative course.
CONCLUSION
Multimodal neuroimaging using conventional MRI, 18F-FET PET, and FDM provides complementary information and a more detailed understanding of peritumoral fiber tract alterations. We defined 10 categories of peritumoral fiber tract alterations while considering changes in metabolism and integrity of fiber structures and correlated these categories of fiber alterations with pre- and postoperative neurologic deficits. A multimodal imaging strategy providing both metabolic information of the tumor for more sensitive delineation of pathologic processes and quantitative information about the integrity of all peritumoral WM structures is required for a detailed assessment of peritumoral fiber tract alterations in gliomas, which in turn is essential for treatment planning and prediction of patients’ prognoses.
DISCLOSURE STATEMENT
The costs of publication of this article were defrayed in part by the payment of page charges. Therefore, and solely to indicate this fact, this article is hereby marked “advertisement” in accordance with 18 USC section 1734.
Acknowledgments
No potential conflict of interest relevant to this article was reported.
- © 2011 by Society of Nuclear Medicine
REFERENCES
- Received for publication March 16, 2011.
- Accepted for publication May 20, 2011.


