


Abstract
Low-grade gliomas (LGGs) may harbor malignant foci, which are characterized by increased tumor cellularity and angiogenesis. We used diffusion-weighted MR imaging (apparent diffusion coefficient [ADC]) and PET with the amino acid O-(2-18F-fluorethyl)-l-tyrosine (18F-FET) to search for focal changes of diffusion (ADC) and amino acid uptake and to investigate whether focal changes in these parameters colocalize within LGGs. Methods: We retrospectively selected 18 patients with nonenhancing LGG. All patients had undergone 18F-FET PET and MR imaging for preoperative evaluation or for therapy monitoring in recurrent or progressive LGG. Region-of-interest analysis was performed to compare 18F-FET uptake and ADC values in areas with focal intratumoral maximum metabolic activity and diffusion restriction and between tumor and normal brain. 18F-FET uptake was normalized to the mean cerebellar uptake (ratio). ADC values were also compared with the 18F-FET uptake on a voxel-by-voxel basis across the whole tumor. Results: The mean focal maximum (mean ± SD, 1.69 ± 0.85) and global 18F-FET uptake in tumors (1.14 ± 0.41) exceeded that of normal cortex (0.85 ± 0.09) and cerebrospinal fluid (0.82 ± 0.20). ADC values in the area with most restricted diffusion (1.07 ± 0.22 × 10⁻³ mm2/s) and in the whole tumor (1.38 ± 0.27 × 10⁻³ mm2/s) were in the range between normal cortex (0.73 ± 0.06 × 10⁻³ mm2/s) and cerebrospinal fluid (2.84 ± 0.09 × 10⁻³ mm2/s). 18F-FET uptake did not correlate with corresponding (colocalizing) ADC values, either in the area with focal maximum metabolic activity or in the area with most restricted diffusion or in the whole tumor. Conclusion: There is no congruency between 18F-FET uptake and diffusivity in nonenhancing LGG. Diffusion restriction in these tumors most likely represents changes in brain and tumor cell densities as well as alteration of water distribution and is probably not directly correlated with the density of tumor cells.
Low-grade gliomas (LGGs) are generally slowly growing tumors. According to the World Health Organization (WHO) (1), they are characterized by low tumor cell density, absence of angiogenesis, and low proliferation rates (WHO grade II). However, at the microscopic level, LGGs may harbor anaplastic tumor cell foci, which may lead to rapid malignant transformation (2,3). In anaplastic gliomas (WHO grade III), increased cellularity and proliferation are found. Hallmarks of WHO grade IV tumors (glioblastoma multiforme [GBM]) are microvascular proliferation and necrosis (1). A diagnostic biopsy only may be necessary due to an eloquent tumor location but is associated with a risk of underestimating the tumor grade as the achieved tissue sampling may not be representative for the whole tumor. This underestimation may lead to inappropriate treatment of the residual tumor. Therefore, there is a need for imaging surrogate markers, which may help to identify regions of higher tumor grade. The absence of contrast enhancement on standard MR imaging, which is found in many LGG patients, does not exclude higher tumor grade (4,5). With regard to the WHO grading criteria of cellularity and angiogenesis, 2 noninvasive imaging tools may be applied in LGG. Diffusion-weighted imaging provides information on water diffusivity (6). Diffusivity can be reduced in gliomas of various grades (6,7) and may correspond to tumor cell density (8,9). PET with radiolabeled amino acids (e.g., 11C-methyl-methionine, O-(2-18F-fluoroethyl)-l-tyrosine [18F-FET]) provides information about facilitated amino acid transport across the blood–brain barrier (BBB) (10–12). Amino acid uptake correlates with microvessel density (13) but also with BBB disruption and tumor blood flow. Gliomas of various WHO grades may show increase in amino acid transport in the absence of BBB disruption as assessed by MR imaging (14). This increase allows the identification of focal maximum metabolic activity, which is suitable for stereotactic biopsy in patients not amenable for tumor resection (15). Our current study was prompted by the observation of colocalization of substantially reduced diffusivity on diffusion-weighted imaging and increased 18F-FET uptake in a patient with a nonenhancing tumor, histopathologically diagnosed as GBM (WHO IV), as shown in our index case (Fig. 1). Assuming that dense tumor cell clusters focally promote angiogenesis as expressed by higher microvessel density, the aim of our study was to assess the spatial relationship of diffusivity and amino acid uptake in nonenhancing LGGs as measured by 18F-FET PET and apparent diffusion coefficient (ADC) MR imaging. We hypothesized that focal tumor cell clusters lead to reduced diffusivity but increased microvessel density and thereby to an inverse correlation between amino acid uptake and diffusivity.

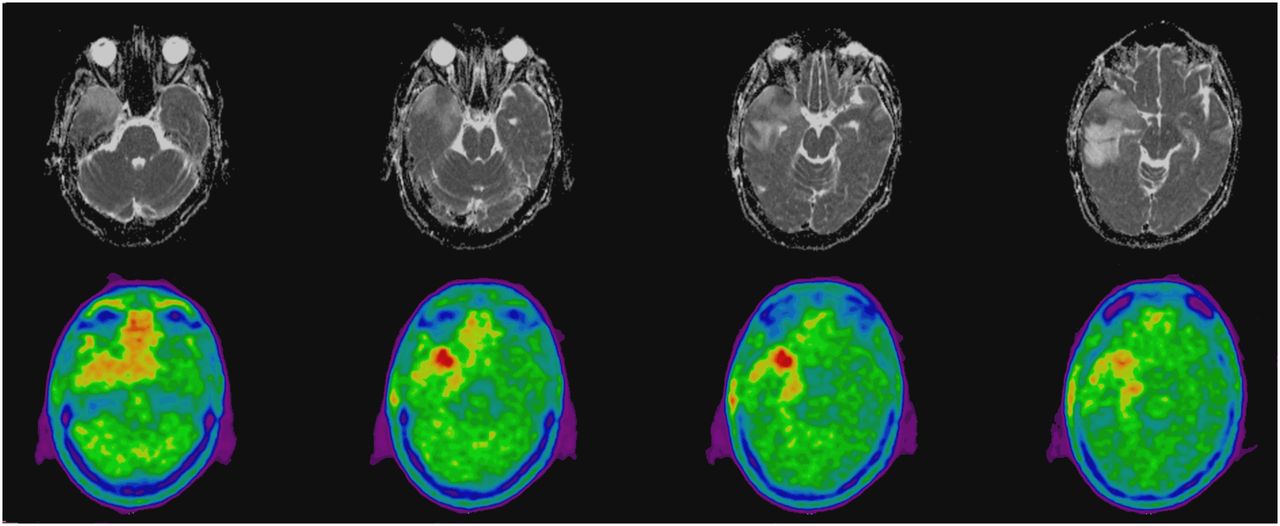
Index case. A 47-y-old left-handed man suffered from partial seizures with speech arrest and aphasia. Nonenhancing space-occupying lesion suggestive of LGG was identified in right temporal lobe. Because of eloquent location, 18F-FET PET was performed to detect most active tumor area suitable for diagnostic biopsy. Histopathologic examination revealed GBM. Adjacent axial ADC MR (top) and 18F-FET (bottom) images are presented. Maximum 18F-FET uptake (tumor-to-cerebellum uptake ratio, 1.41) spatially colocalizes with focally reduced intratumoral diffusivity (ADC, 0.82 × 10⁻³ mm2/s). In tumor areas with lower 18F-FET uptake (most left and right image), local ADC is indistinguishable from surrounding tumor parts. Data suggest inverse correlation between both imaging modalities in heterogeneous tumors in this particular case.
MATERIALS AND METHODS
Patients
We selected 18 patients with supratentorial nonenhancing LGGs from our center (10 men, 8 women; mean age ± SD, 48 ± 11 y). 18F-FET PET and MR imaging were performed for preoperative evaluation at first presentation or to monitor response to therapy in patients with recurrent or progressive LGGs. Eleven patients were studied at initial tumor presentation and 7 at either recurrence or progression (mean interval from first operation, 52 mo). The latter 7 patients did not undergo reoperation; however, the absence of tumor gadolinium enhancement and the clinical course during the further follow-up period were compatible with the assumption that these tumors were of WHO grade II at the time of our study. No patient received previous radiation therapy. One patient (patient 4) was treated with temozolomide 4 y before tumor recurrence. No other patients received chemotherapy. MR and PET imaging were performed within 24 ± 12 d of each other (mean ± SD). No patient received dexamethasone. Details are presented in Table 1. The institutional review board (local ethics committee) approved this retrospective study, and the requirement to obtain informed consent was waived. The application of 18F-FET PET was approved by the Swiss authorities (Swissmedic).
Clinical and Imaging Results
MR Imaging Procedure
All MR images were obtained using a 1.5-T Avanto or Espree scanner (Siemens Healthcare) with an 8-channel head array coil. A clinical MR image of the head was obtained, including a T1-weighted series before and after administration of 0.1 mmol/kg of the contrast agent gadobutrol (Gadovist; Bayer) and a T2-weighted turbo spin-echo series with fat suppression in the axial direction. Imaging parameters were repetition times of 3,330 (Espree) and 3,222 ms (Avanto), echo times of 14 and 127 ms (Espree) and 12 and 124 ms (Avanto), an echo train length of 5, imaging matrix of 224 × 512, slice thickness of 6 mm, and 3 averages. Diffusion-weighted images were acquired using the diffusion-weighted single shot echo-planar imaging sequence (Stejskal and Tanner) (repetition time and echo times, Avanto: 2,600 and 89 ms, respectively, and Espree: 4,500 and 130 ms, respectively; matrix, 192 × 192; slice thickness, 5 mm; 4 averages). Diffusion-weighted images were obtained with b values of 0 and 1,000 s/mm2 in the read, phase, and slice directions. The ADC values for the echo-planar imaging sequences were calculated as previously described (6).
PET Imaging Procedure
The injected 18F-FET activities for PET ranged from 1.7 to 4.5 MBq/kg of body weight (mean activity, 3.1 MBq/kg). Static 18F-FET PET scans were obtained 30–50 min after tracer injection. Twelve patients underwent the PET scan on an Allegro PET scanner (Philips). Images were reconstructed by a 3-dimensional row-action maximum-likelihood algorithm in a zoom mode for the brain, and calculated attenuation correction was performed using an elliptic region of interest (ROI) covering the entire skull. Six patients were scanned on a Biograph MCT PET scanner (Siemens) using high-resolution reconstruction software, also incorporating the time-of-flight information in the reconstruction algorithm. Low-dose CT scans of the head were used for attenuation correction of the PET images. Both PET scanners were fully calibrated, cross-calibrated, and tested for quantitative accuracy; these procedures were performed according to the manufacturer’s recommendations and based on the regulations of the Swiss health authorities.
Image Analysis
18F-FET PET images were coregistered to the ADC MR images using the software PMOD (PMOD Technologies Ltd.). Thus, the image matrix and voxel size of the 18F-FET PET images were matched to the ADC MR images, allowing the free exchange of ROIs between both modalities, for example, to define a tumor ROI on the ADC MR image and then apply it on the PET scan. On an empiric basis, we applied a 5-mm gaussian filter to the ADC MR images before coregistration, which we found to ease the process of coregistration. For further data processing, only unfiltered MR and PET images were used.
We first drew irregular global ROIs on 3 adjacent axial planes of the ADC sequence showing the maximum tumor diameter. These ROIs encompassed the whole region displaying an abnormal ADC signal. All tumors showed practically the same aspect and size on ADC and T2-weighted images (e.g., Fig. 2). The summed voxel volume from these 3 adjacent planes was referred to as the tumor volume. ROIs were then transferred to the PET images and were used to measure the mean global tumor ADC values and the 18F-FET uptake ratios. Absolute ADC values were obtained from MR images. 18F-FET tumor uptake ratios were obtained from the PET images for which the cerebellar uptake served as a reference. One ROI encompassing both hemispheres of the cerebellum was positioned on the ADC MR images on 2 adjacent planes with the largest diameter of the cerebellum and was then transferred to the PET images. The mean ROI values were averaged to represent the cerebellar 18F-FET uptake.

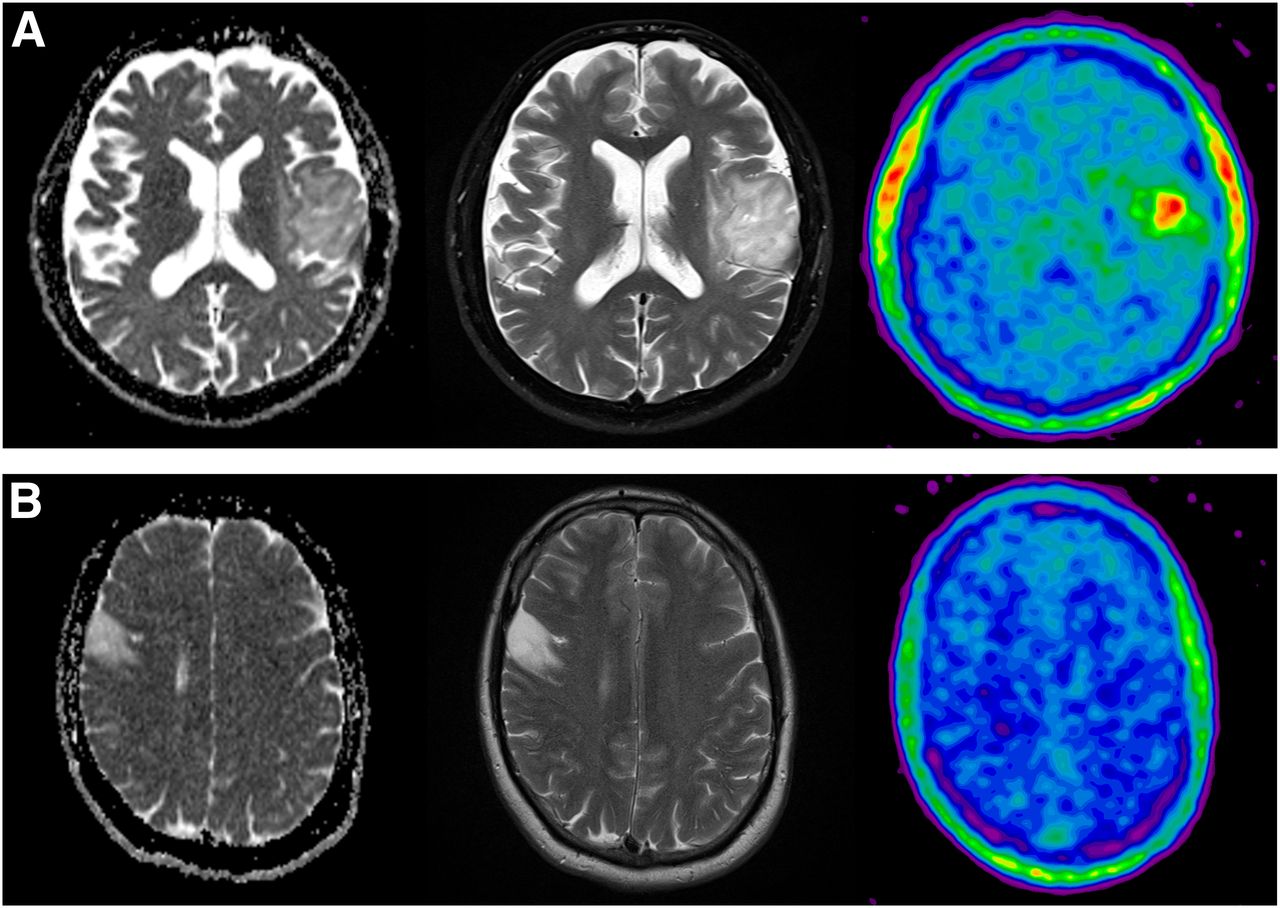
Absence of 18F-FET ADC colocalization in nonenhancing LGG is illustrated in patients 4 (A) and 17 (B). Corresponding ADC (left), T2-weighted (middle), and 18F-FET PET (right) images are shown. High focal 18F-FET uptake (uptake ratio, 2.22) is not associated with focal diffusion abnormality as measured with ADC (A).
Because the focus of our study was to search for an inverse relation between diffusivity and 18F-FET uptake, the area with the maximum 18F-FET uptake within the tumor was identified by 2 nuclear medicine physicians and marked by a 4-mm-diameter circular ROI. This ROI was then transferred to the ADC sequences of the MR images (18F-FET PET–guided approach). Values for 18F-FET uptake ratios and ADC were then calculated. In addition, 2 board-certified neuroradiologists, who were masked to the PET results, positioned ROIs on ADC images within the tumor area showing the most restricted diffusion (i.e., lowest ADC values). These ROIs were then transferred to the PET images, and corresponding values for ADC and 18F-FET uptake ratios were calculated (ADC-guided approach). In addition, we used the global tumor ROI for a voxelwise image analysis comparing 18F-FET PET with MR imaging ADC values to test for a positive or negative correlation of voxel values. We further placed irregular reference ROIs outside of tumor over normal brain in the contralateral hemisphere to obtain normal values of ADC and 18F-FET uptake values for the white matter, cerebrospinal fluid, and frontal and parietal cortex. The volumes of these ROIs ranged from 0.2 to 3.7 × 10⁻⁶ m3.
Statistics
18F-FET uptake is presented as a tumor-to-cerebellum uptake ratio (unitless). ADC values are expressed in units of 10−3 mm2/s. The correlations between 18F-FET uptake and ADC were tested using linear regression with SigmaStat (Systat Software, version 3.5; SyStat, Inc.).
RESULTS
18F-FET Uptake and ADC Values in Tumors
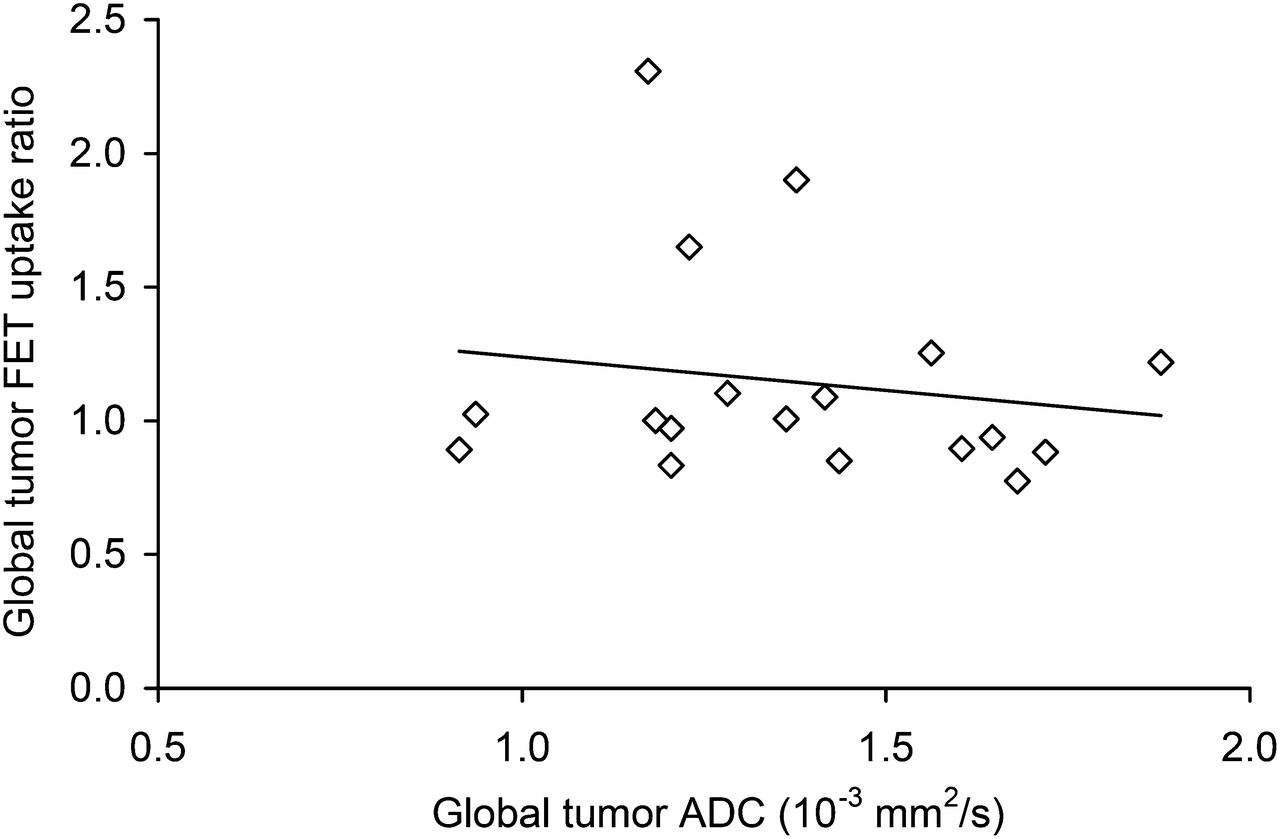
In global tumors, the mean 18F-FET uptake ratio was 1.14 ± 0.41, and the mean global ADC was 1.38 ± 0.27 × 10⁻³ mm2/s (Table 1). In contrast to our index case with a GBM (Fig. 1), visual inspection of PET and MR images of the LGG patients did not show a spatial correlation (colocalization) between 18F-FET uptake and diffusivity (examples given in Fig. 2). Using the 18F-FET PET–guided approach, we found 18F-FET uptake ratios in the areas with the maximum focal metabolic activity in the range of 0.95–3.80 (mean ± SD, 1.69 ± 0.85). In these areas, the mean ADC was 1.38 ± 0.35 × 10⁻³ mm2/s. There was no correlation between 18F-FET uptake and ADC values (linear regression r2 = 0.178, P = 0.517). Using the ADC-guided approach, we found in the tumor areas with most restricted diffusion ADC values in the range of 0.82–1.57 × 10⁻³ mm2/s (mean ± SD, 1.07 ± 0.22 × 10⁻³ mm2/s). In these areas, the mean 18F-FET uptake ratio was 1.12 ± 0.55. Again, we observed no correlation between these values (linear regression r2 = 0.039, P = 0.781). In addition, there was no correlation between global tumor 18F-FET uptake and ADC values for the whole group of 18 patients (r2 = 0.189, P = 0.519, Fig. 3). Furthermore, the intraindividual voxel-by-voxel analysis of global tumor ROIs, which was performed for all patients, revealed no significant negative or positive correlations between ADC values and 18F-FET uptake (Fig. 4).

To test hypothesis of inverse correlation between amino acid uptake and diffusivity, mean global ADC values were plotted against mean global 18F-FET uptake values in tumors. Linear regression, R2 = 0.189, P = 0.519.

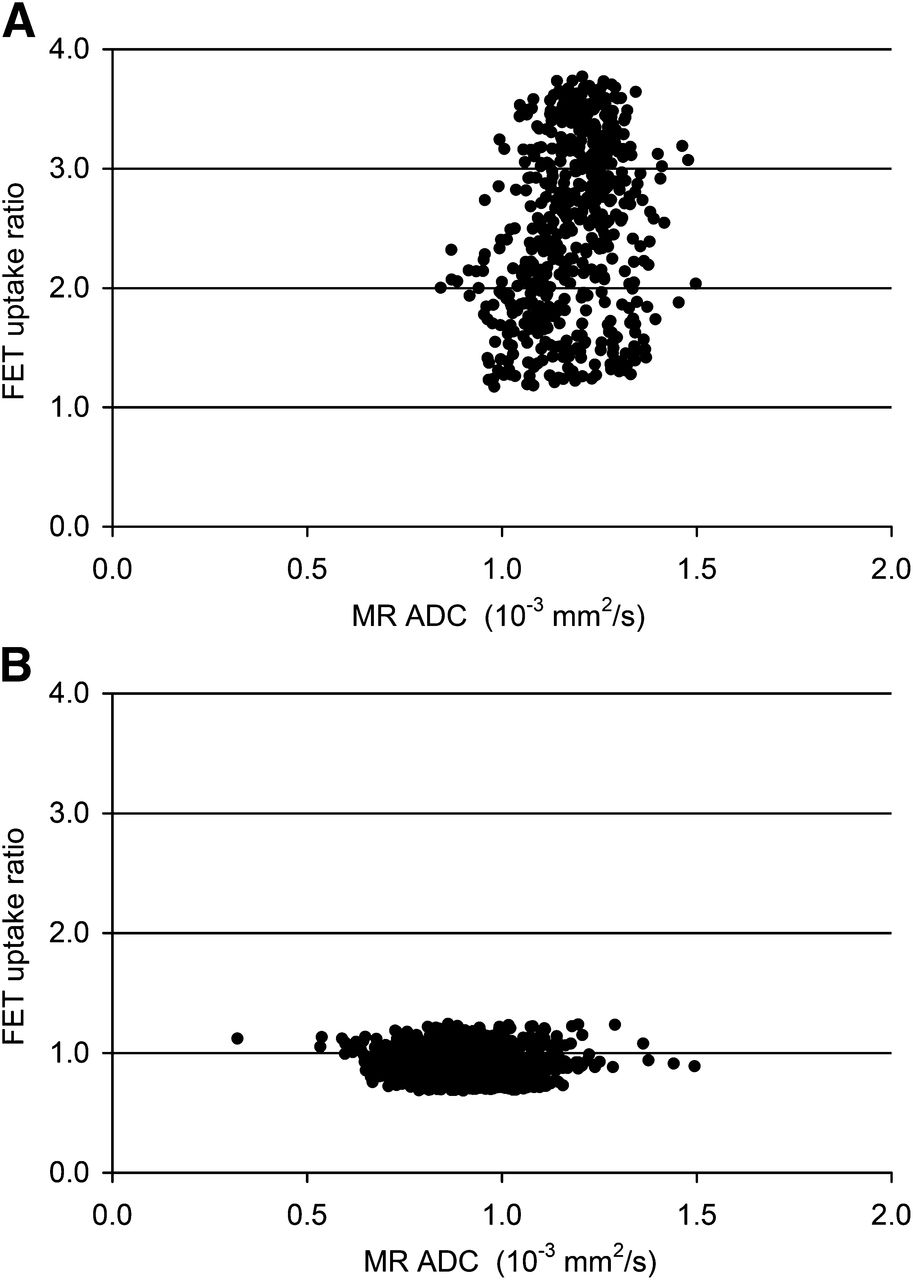
Voxel-by-voxel plots of global tumor ROIs. (A) Patient with highest 18F-FET uptake ratio (patient 8). (B) Patient with lowest 18F-FET uptake ratio (patient 18).
Comparison with Normal Brain
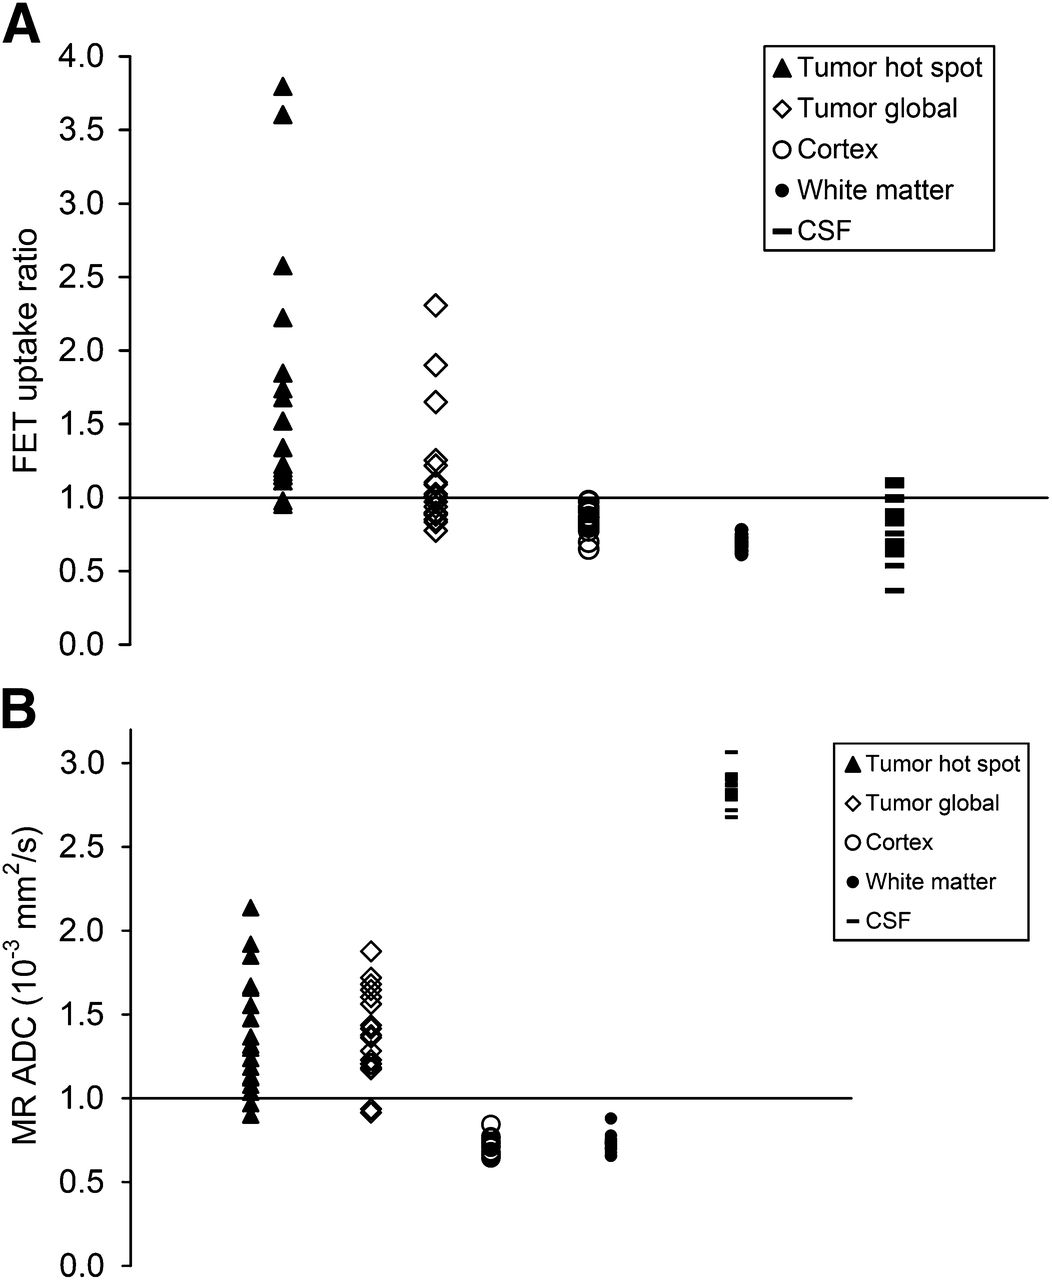
Figure 5 illustrates 18F-FET uptake (Fig. 5A) and ADC values (Fig. 5B) in the tumor area with highest 18F-FET uptake and normal brain. The maximum 18F-FET uptake ratio (1.69 ± 0.85) and global tumor 18F-FET uptake ratio (1.14 ± 0.41) were higher than the uptake ratios in the normal cortex (0.85 ± 0.09), white matter (0.69 ± 0.04), and cerebrospinal fluid in the lateral ventricles (0.82 ± 0.20). Mean ADC in the tumor area with the most restricted diffusion (1.07 ± 0.22 × 10⁻³ mm2/s) and mean global tumor ADC (1.38 ± 0.27 × 10⁻³ mm2/s) were in between the values for cerebrospinal fluid (2.84 ± 0.09 × 10⁻³ mm2/s), normal cortex (0.73 ± 0.06 × 10⁻³ mm2/s), and white matter (0.73 ± 0.05 × 10⁻³ mm2/s).

Distribution of 18F-FET uptake (A) and ADC values (B) in area of focal maximum 18F-FET uptake (hot spot), global tumor, frontal cortex, white matter, and cerebrospinal fluid (CSF).
DISCUSSION
The 18F-FET uptake in tumor areas with maximum metabolic activity did not colocalize with alterations in focal diffusivity within individual tumors (ADC) (Fig. 2). When all 18 patients were considered, neither global nor maximum tumor 18F-FET uptake showed a correlation with the corresponding ADC values. Our findings may indicate that cellularity of nonenhancing LGGs most likely shows a smaller effect on the ADC signal than other tissue properties such as the density of normal cells, microvessels, the volume of the extracellular space, and distribution of macromolecules such as proteoglycans and adhesion proteins (16,17). All these components may constitute a relatively homogeneous biologic background in LGGs, which may result in a difficulty in detecting tumor cells that form dense cell clusters during an early stage of malignant transformation. Holodny et al. (18) reported a colocalization of 18F-FDG uptake and diffusion restriction in ADC images in 10 of 12 patients with high-grade gliomas. This colocalization is conceivable because both 18F-FDG uptake (19) and ADC maps (8,9) are considered to provide information on cell density. However, increased amino acid uptake in nonenhancing LGGs, as measured with PET, is dominated by facilitated amino acid transport across the BBB (10). The magnitude of the amino acid PET signal therefore correlates with the density of microvessels, which exhibit the amino acid carriers (13). Although one might expect that the formation of new microvessels is triggered by tumor cell clusters, this could not be demonstrated using combined ADC and 18F-FET PET imaging in our series. To address this issue in more detail a prospective study might use amino acid PET–guided biopsies to reveal focal patterns of microvessel and cell density in tumor regions with focally increased amino acid uptake.
In a series of 22 newly diagnosed gliomas, nonenhancing WHO grade II tumors showed lower maximal 18F-FET uptake ratios and cell densities (measured from tissue specimens) than nonenhancing grade III tumors (20). 18F-FET uptake in these tumors was in the range of 1.3–4.2 in 21 of 22 patients and showed a linear relationship with cell and microvessel density. However, no ADC data were presented. In our series, 50% of patients showed maximal 18F-FET uptake ratios below 1.3. In line with the observation in our index case, this suggests that focally increased 18F-FET uptake and diffusion restriction on ADC images might occur if ADC values were to fall below a yet unidentified threshold. This may also imply that ADC values in a low range of 18F-FET uptake are not specific to changes in cellularity but also reflect tissue alterations such as the volume and composition of the extracellular space (17).
Several reports show that the level of amino acid uptake in astrocytic WHO grade II tumors yields prognostic information (21,22). ADC data from studies in LGGs with longer follow-up are not available; therefore, the prognostic value of ADC is unknown. In high-grade gliomas, serial ADC imaging has been applied to study the behavior of these tumors (23). CIMPLE (cell invasion, motility, and proliferation level estimate) maps have been developed to investigate focal ADC changes over time (23). This approach enables the separation of patients responding to chemoradiation from nonresponders (24) and prediction of the development of new contrast-enhancing tumors in residual nonenhancing lesions after antiangiogenic treatment in glioblastoma (23).
CONCLUSION
Tumor ADC values in nonenhancing LGGs fall in the range between normal brain and the cerebrospinal fluid. They may therefore reflect changes in brain and tumor cell densities and alterations of the extracellular space and water distribution. Here, we showed in LGGs that the tumor ADC values do not correlate with the 18F-FET uptake. On the other hand, 18F-FET uptake is a well-recognized means to identify biopsy targets in brain tumors—that is, to localize a representative tumor area. In the case of LGGs, we believe that diffusion-weighted MR imaging is limited in this respect and cannot replace the information provided by 18F-FET PET.
DISCLOSURE
The costs of publication of this article were defrayed in part by the payment of page charges. Therefore, and solely to indicate fact, this article is hereby marked “advertisement” in accordance with 18 USC section 1734. No potential conflict of interest relevant to this article was reported.
Footnotes
Published online Feb. 24, 2014.
- © 2014 by the Society of Nuclear Medicine and Molecular Imaging, Inc.
REFERENCES
- Received for publication August 19, 2013.
- Accepted for publication November 1, 2013.


