


Abstract
The goal of this study was to evaluate the effect on the average standardized uptake value (avgSUV) and maximum standardized uptake value (maxSUV) of changing the number of iterations in the reconstruction process on studies acquired with PET/CT. Methods: Data from 50 human tumors were acquired on a PET/CT scanner, using the CT portion for attenuation correction. Reconstruction was performed using the 2-dimensional reconstruction method of ordered-subsets expectation maximization (OSEM) with 28 subsets and with 1, 2, 3, 4, 5, 10, 20, and 40 iterations. The standardized uptake value (SUV) of the studies was analyzed by positioning a region of interest tightly around the tumor and reproducing the same area on all same-study iterations for SUV measurements. Results: The differences in mean avgSUV and mean maxSUV were statistically different across different iteration groups. SUV data demonstrated that the avgSUV measurements have the most significant differences between 1 versus 2 iterations and 2 versus 3 iterations. The P values for these comparisons were less then 0.001. For maxSUV, all differences had P values less than 0.001. There also was a systematic increase in the SUVs as the number of iterations increased. The avgSUV increased at early iterations (less than 5), with just 50%–60% increasing after 5 iterations. However, maxSUV increased systematically at early iterations, and this trend continued as the number of iterations increased. Conclusion: The OSEM algorithm converges sooner for avgSUV than for maxSUV. The likely reason is that avgSUV depends on low-frequency features that are recovered with fewer iterations. The differences in maxSUV were likely due to noise, which increased with the number of iterative updates, and to increased resolution and recovery of high-frequency features (i.e., tumor heterogeneity) with a larger number of iterations. Factors that determine the quantitative accuracy of iterative reconstruction may have played an additional role. Given the continued change in maxSUV with iterations, great care must be taken in selecting the number of iterative updates when using it to assess tumors and their response to chemotherapy and radiation therapy. Because 2–5 iterations with 8–28 subsets are being used in clinical settings, these data are pertinent when comparing the SUVs of a tumor before and after therapy.
Studies have shown that 18F-FDG PET is useful for diagnosis and staging of malignant tumors (1). The uptake of 18F-FDG into cells reflects membrane transport and phosphorylation of radiolabeled deoxyglucose by viable cells. Because of this process, the 18F-FDG concentration increases in metabolically active tumor cells, resulting in high contrast between tumor and normal tissues (1). Although much of 18F-FDG PET oncology is practiced by qualitative interpretation, quantitative indices are used to assess tumors and to follow up their response to therapy (1–3). The metabolic pathway of 18F-FDG allows for the quantitative estimation of glucose use in tumors.
Standardized uptake values (SUVs) are quantitative measurements of radioactivity concentrations at a fixed time, with the SUV in tumors increasing continuously as a function of time after 18F-FDG intravenous administration. For SUV measurement, the 18F-FDG concentration in the tumor is normalized to the injected dose of 18F-FDG and body weight. The tumor region of interest (ROI) with the highest SUV (maxSUV) is thought to represent the malignant grade of the tumor overall, as that ROI corresponds to the most metabolically active region of the tumor and correlates linearly with tumor proliferation rate (4). A high proliferation rate is thought to indicate a tumor associated with poor prognosis in the absence of preoperative chemotherapy (4). In sum, maxSUV can be used as a noninvasive measure of tumor grade and patient prognosis (1,3,5,6).
For the maxSUV computation, the boundaries of the tumor ROI have been drawn at thresholds of the peak activity within each lesion (5). However, studies indicate the complexity and variation of glucose uptake in tumors (7). Accurately reproducible SUV measurements are critical for reliable use in evaluation of therapy. Variables to be considered when evaluating an SUV include the radiopharmaceutical used (e.g., SUV of 18F-FDG vs. SUV of fluorinated ethyltyrosine), measurement of radiotracer uptake by tissues, biologic factors, tracer kinetics, the acquisition and reconstruction parameters of the radiotracer study, strategies in image analysis, and phasic respiratory physiology (1,6–8).
Our study specifically looked at the reconstruction process and evaluated the effect on the average SUV (avgSUV) and maxSUV of changing the number of iterations in the reconstruction process for studies acquired with a PET/CT system.
MATERIALS AND METHODS
Data from 50 human tumors were acquired on a Discovery LS PET/CT scanner (General Electric Medical Systems). CT scans were acquired using 80 mA and 140 kV(p). PET emission acquisitions used the 2-dimensional mode, 6 bed positions, and an acquisition time of 6 min per bed position. Two-dimensional reconstruction was performed using the ordered-subsets expectation maximization (OSEM) algorithm. The manufacturer recommends use of 28 subsets × 2 iterations (56 iterative updates). The following reconstruction parameters were used in this study: 28 subsets, a postreconstruction 3-dimensional filter of 3.0 mm in full width at half maximum (FWHM), and a loop filter of 5.30 mm FWHM. Both the loop filter and the postreconstruction filter are gaussian filters with a FWHM entered from the reconstruction U/l. The loop filter is applied to the ratio sinogram, which is basically the ratio of the measured PET data to the forwarded projected image estimate for the current reconstructed image. A Hanning filter was used in all studies. Each tumor was processed using 1, 2, 3, 4, 5, 10, 20, and 40 iterations; all other reconstruction parameters were unaltered. Measured attenuation correction was also applied.
SUV analysis of the studies began with viewing of the transaxial images for each study. A single transaxial slice was chosen in which the tumor was subjectively best outlined, and an ROI was drawn and manually placed to encompass the entire tumor. The ROI was drawn at a 90% threshold of the maximum activity concentration in all tumors. The reason for not choosing a small ROI in the tumor is explained later. The same tumor ROI was reproduced to assess the effects of changing 1, 2, 3, 4, 5, 10, 20, and 40 iterations. For each tumor the same transaxial slice was examined, and an identically sized ROI was placed at the same location for all iterations. For 4 tumors, we assessed several times whether the pixel with maxSUV could vary between iterations, and we found that indeed it could.
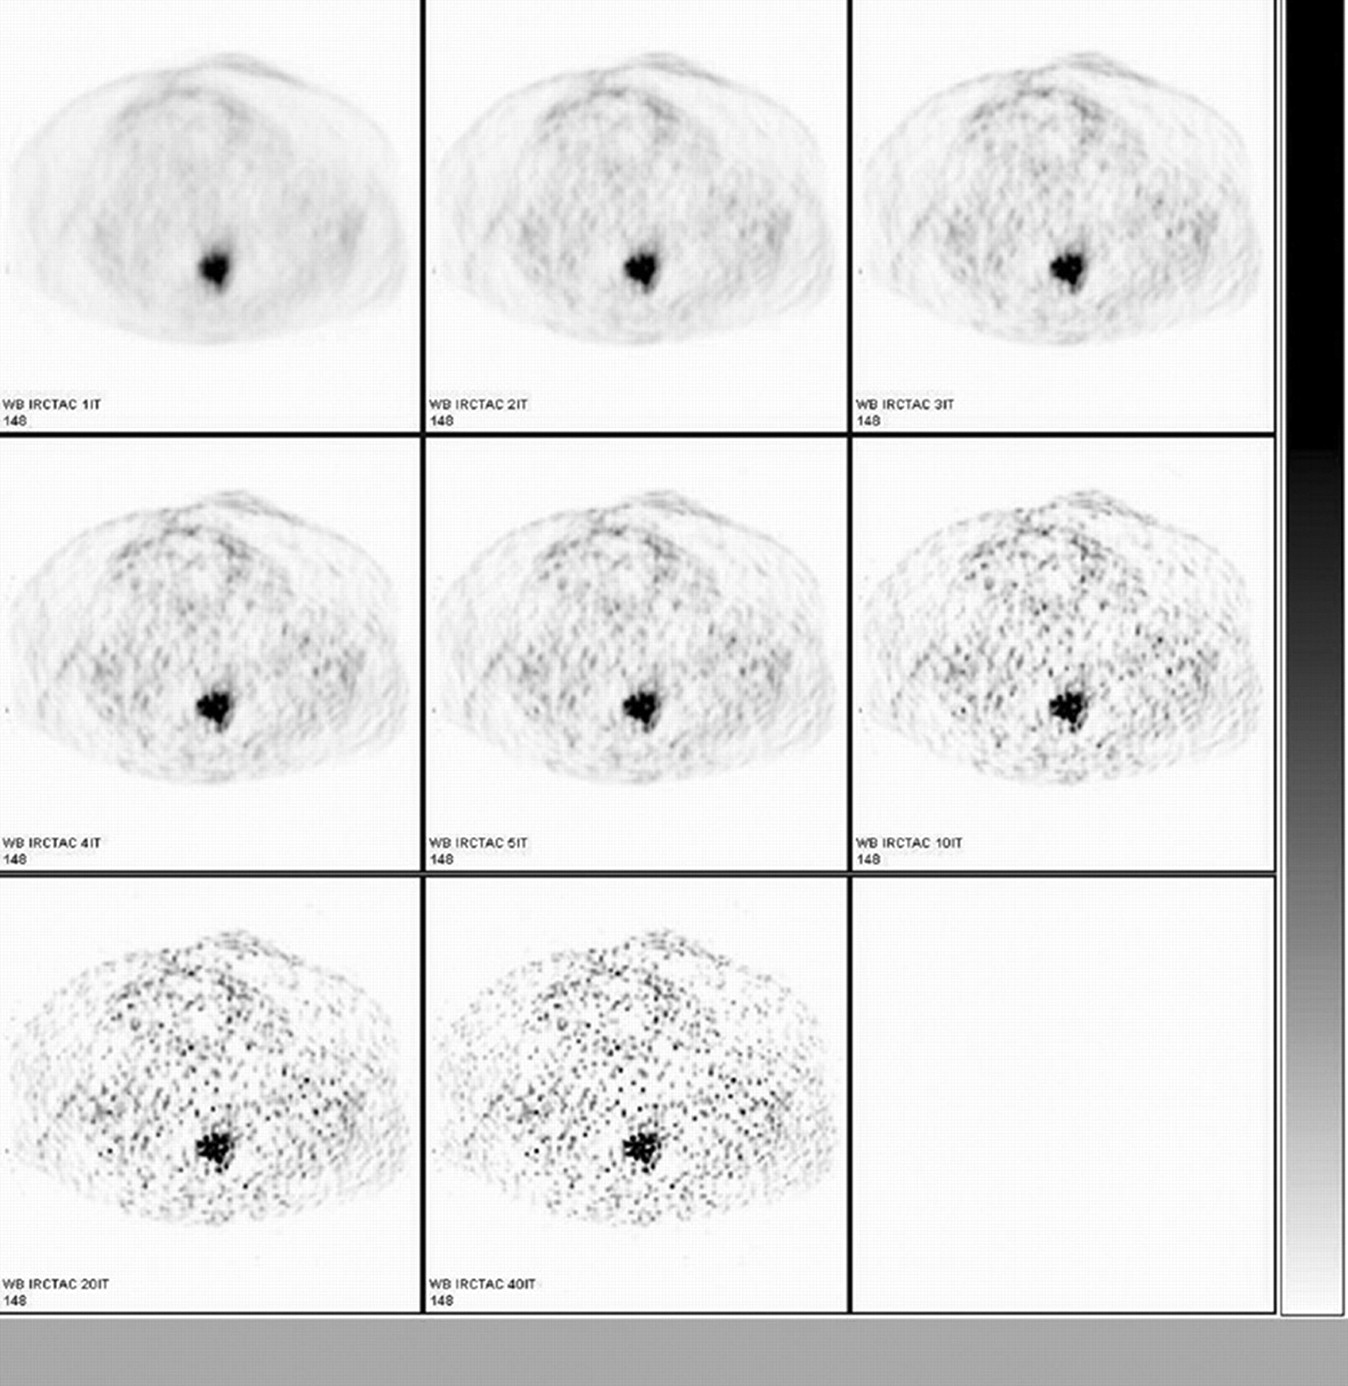
The intrinsic nonisotropic, that is, transaxial and axial, spatial resolutions of our PET/CT system are between 4.9 and 4 mm at the center of the scanner (9). Assuming the often-quoted final image resolution of 8 mm for clinical PET, and because of the partial-volume effect, radionuclide count recovery by our system is less than 100% in objects less than twice the image resolution. Figure 1 shows images of ovarian cancer. This example shows continuing changes in image appearance from 1 iteration to 40 iterations. The data show progressively noisier images, but with less smoothing and more spatial features as the number of iterations increases.

Changes in image appearance of ovarian cancer as number of iterations is increased from 1 (top row, left image) to 40 (bottom row, middle image).
Means ± SEMs for maxSUV and avgSUV and for each number of iterations were computed. Repeated-measures ANOVA was performed to test for differences in the means across iterations. Percentage change between successive iteration groups was also calculated, and paired t tests were computed to ascertain whether the differences between successive groups were statistically significant. Additionally, we calculated the number of tumors for which the measurement at a given iteration was larger than the measurement at the previous iteration.
RESULTS
For the ROI of the 50 tumors, the mean number of pixels was 71 (minimum, 16; maximum, 176), the median number was 62, and the SD was 44. The mean area was 8.7 cm2 (minimum, 1.9 cm2; maximum, 23.4 cm2), the median area was 7.6 cm2, and the SD was 5.9 cm2.
Table 1 shows that the differences in mean avgSUV and maxSUV were statistically significant across the iteration groups. The percentage change in SUV across successive iterations is also presented, as is the percentage change in avgSUV and maxSUV from 5 to 40 iterations. The percentage change was much larger for maxSUV than for avgSUV (28% vs. 1%).
Differences in Mean avgSUV and maxSUV Across Iteration Groups
To determine where the differences were occurring, iterations 1 versus 2, 2 versus 3, 3 versus 4, 4 versus 5, 5 versus 10, 10 versus 20, and 20 versus 40 were tested. A simple Bonferroni correction was applied to adjust for the 14 tests, with P values less than 0.05/14, or 0.0035, taken to be statistically significant. Applying this correction, we showed that for avgSUV, differences for 1 versus 2 and 2 versus 3 were significant, whereas for the rest they were not. For maxSUV, all the differences between numbers of iterations had P values < 0.001 (Table 2).
Statistical Significance of Differences Between Number of Iterations
Another interesting aspect to the measurements is that there appeared to be systematic increases in the means as the number of iterations increased. From these data, it also became obvious that a possible interpretation of the results was that the OSEM algorithm was converging much more rapidly for avgSUV than for maxSUV.
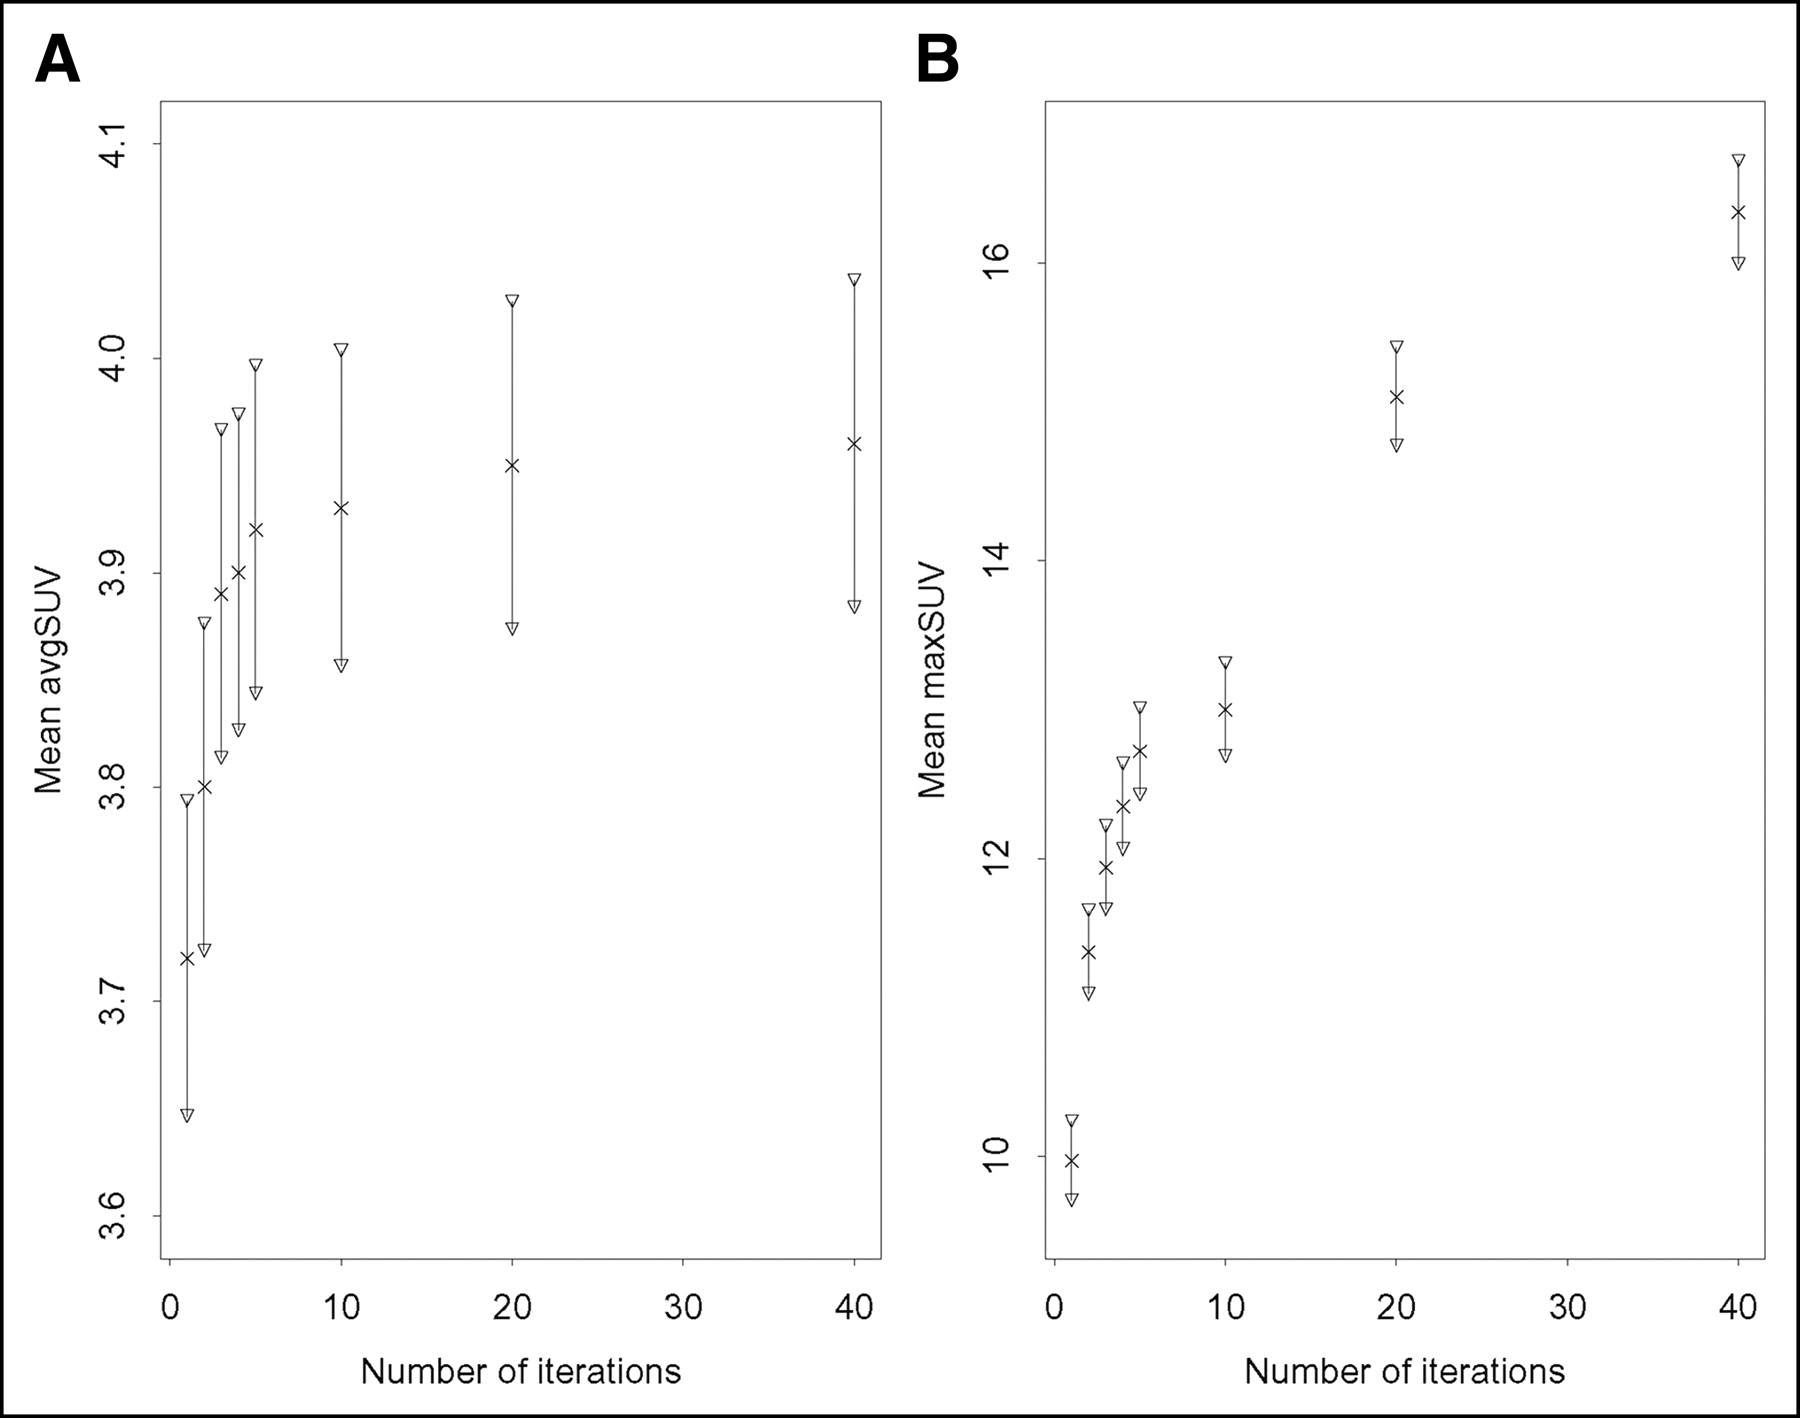
We computed the number of tumors for which avgSUV or maxSUV increased from 1 to 2, 2 to 3, 3 to 4, 4 to 5, 5 to 10, 10 to 20, or 20 to 40 iterations. The results are shown in Table 3. For avgSUV, the measurements tended to increase at early iterations (<5) but diminished at later iterations, settling down between 50% and 60% after 5 iterations (Fig. 2). However, for maxSUV, the measurements increased systematically at early iterations (>90%), and this trend continued as the number of iterations increased (Fig. 2). From 10 to 20 iterations, 98% of the maxSUV measurements increased, and from 20 to 40 iterations, 100% increased.

Plots of mean avgSUV (A) and mean maxSUV (B) vs. number of iterations, with 95% confidence intervals for the means at each iteration.
Number of Tumors for Which SUV Increased with Increase in Iterations
DISCUSSION
Our research demonstrated that when the numbers of iterations in the OSEM procedure increased, the differences in mean avgSUV and mean maxSUV were statistically significant across different iteration groups. The results of the SUV data analyses demonstrated that the avgSUV measurements had the most significant differences between 1 versus 2 iterations and 2 versus 3 iterations. The P value for these comparisons was less than 0.001. For maxSUV, all differences as a function of the number of iterations had P values less than 0.001.
The avgSUV tended to increase at a smaller number of iterations (fewer than 5), with just 50%–60% increasing after 5 iterations. However, maxSUV measurements increased systematically at few iterations, and this trend continued as the number of iterations increased. The percentage change from 5 to 40 iterations was 28% for maxSUV but only 1% for avgSUV.
The avgSUV thus converged with fewer iterative updates than did maxSUV. The likely cause is the relative insensitivity of avgSUV to high-frequency features (e.g., radiotracer uptake heterogeneity). These high-frequency features tend to be more fully recovered with a larger number of iterations. The calculation of avgSUV acts as a low-pass filter, and this is relatively insensitive to increases in high-frequency noise that result from increasing numbers of iterations. The effective glycolytic tumor volume assesses the metabolic activity and mass of an entire tumor and can include the areas of high and low (even necrotic) metabolic activity (2) with variable tracer uptake heterogeneity that a low-pass filter cannot recover but that are recovered with an increased number of iterations, explaining the continuing increase in maxSUV observed in this study.
Additionally, the differences in maxSUVs may be due, in part, to lesion size, as 18F-FDG uptake expressed as noise equivalent counts and maxSUV may be determined by partial-volume averaging (4). However, none of the ROIs chosen among the 50 tumors in this investigation had dimensions smaller than the scanner image resolution of 8 mm × 2, or 1.6 cm. To recover all counts in an object with our scanner, the object has to be larger than 1.6 cm, as was true for all tumors in this study. The observed changes in maxSUV cannot be explained by reduced partial-volume effects in a tumor with uniform activity resulting from improved resolution with iteration. The changes must be due to increases in noise pixel values or reduced partial-volume effects for intratumor heterogeneities.
When the iterative reconstruction algorithm is applied, the strategy is to avoid noise amplification and optimize processing time. It is imperative, then, to accurately evaluate the number of iterations needed to obtain the best image quality (9). The method used in this study was the statistical maximum-likelihood expectation maximization (MLEM), modified as OSEM, which accelerates the convergence of the iterative reconstruction process.
Ridell et al. (10) used OSEM iterative reconstruction (3 iterations × 21 subsets, or 63 iterative updates of the regular MLEM) and noticed that relative to filtered backprojection, OSEM improves the signal-to-noise ratio, particularly in regions with fewer counts, because of better localization of noise (10). Indeed, for MLEM reconstruction, the variance in pixel values is approximately proportional to the pixel value (11,12). This property can be generalized to OSEM reconstruction (13).
Boellard et al. (14) extended the observations of Riddell et al. (10) by demonstrating that for OSEM, cold regions within a hot background converge more slowly on iterative reconstruction than do small hot areas within a cold background. This observation was thought to be pertinent for tumors and for the myocardium. Additionally, for hot regions, noise was greater with OSEM than with filtered backprojection. They used OSEM with 24 iterative updates and OSEM with 64 iterative updates with and without smoothing, as well as filtered backprojection reconstructions. Their data also indicated that assessment of image noise versus convergence as a function of the number of OSEM iterations was object specific. For instance, for brain studies, OSEM with 4 × 16, or 64, iterative updates is required to obtain images with sufficient full convergence.
Finally, the accuracy of quantitating activity in iterative reconstruction depends on lesion radioactivity and background activity levels, counting statistics, physical factors included in the modeling, number of iterations, filtering, and other factors (15).
CONCLUSION
In summary, the OSEM algorithm converges sooner for avgSUV than for maxSUV, likely because avgSUV depends on low-frequency features that are recovered quickly with fewer iterative updates. In contrast, for the iterations and filters used in this study, maxSUV did not converge. Increases in maxSUV with iteration observed in this study were likely due to increased noise and to resolution of small inhomogeneities in tumor uptake. In addition to differences in the tumor population in this investigation, factors that determine the quantitative accuracy of iterative reconstruction may have played a role. The lack of convergence of maxSUVs demonstrates that care should be taken when using it as an index of tumor metabolic activity. In particular, values for maxSUV will depend strongly on details of the reconstruction, including number of iterations and subsets, as well as on filtering after or during reconstruction.
Footnotes
Received Mar. 30, 2004; revision accepted Nov. 2, 2004.
For correspondence or reprints contact: Jesus A. Bianco, MD, Department of Radiology, University of Wisconsin-Madison, 600 Highland Ave., E3/311 CSC, Madison, WI 53792-3252.
E-mail jabianco{at}wisc.edu
REFERENCES
In this issue


Jump to section
Related Articles
Cited By...
- Impact of PET reconstruction on A{beta}-amyloid quantitation in cross-sectional and longitudinal analyses
- Consensus Recommendations on the Use of 18F-FDG PET/CT in Lung Disease
- Assessing PET Parameters in Oncologic 18F-FDG Studies
- Revisiting Weight-Normalized SUV and Lean-Body-Mass-Normalized SUV in PET Studies
- Use of a Qualification Phantom for PET Brain Imaging in a Multicenter Consortium: A Collaboration Between the Pediatric Brain Tumor Consortium and the SNMMI Clinical Trials Network
- Is FDG-PET/CT Useful for Diagnosing Pulmonary Metastasis in Patients with Soft Tissue Sarcoma?
- Molecular Imaging to Plan Radiotherapy and Evaluate Its Efficacy
- Phantom and Clinical Evaluation of the Bayesian Penalized Likelihood Reconstruction Algorithm Q.Clear on an LYSO PET/CT System
- Risk Stratification of Gallbladder Polyps (1-2 cm) for Surgical Intervention with 18F-FDG PET/CT
- Assessment of Interobserver Reproducibility in Quantitative 18F-FDG PET and CT Measurements of Tumor Response to Therapy
- Standards for PET Image Acquisition and Quantitative Data Analysis
- 18F-FDG PET for Mediastinal Staging of Lung Cancer: Which SUV Threshold Makes Sense?
- Partial-Volume Effect in PET Tumor Imaging
- Dynamic Threshold for Radiation Target Volume by PET/CT
- Partial-Volume Correction in PET: Validation of an Iterative Postreconstruction Method with Phantom and Patient Data
- 18F-FDG PET Definition of Gross Tumor Volume for Radiotherapy of Non-Small Cell Lung Cancer: Is a Single Standardized Uptake Value Threshold Approach Appropriate?