


Abstract
Q.Clear, a Bayesian penalized-likelihood reconstruction algorithm for PET, was recently introduced by GE Healthcare on their PET scanners to improve clinical image quality and quantification. In this work, we determined the optimum penalization factor (beta) for clinical use of Q.Clear and compared Q.Clear with standard PET reconstructions. Methods: A National Electrical Manufacturers Association image-quality phantom was scanned on a time-of-flight PET/CT scanner and reconstructed using ordered-subset expectation maximization (OSEM), OSEM with point-spread function (PSF) modeling, and the Q.Clear algorithm (which also includes PSF modeling). Q.Clear was investigated for β (B) values of 100–1,000. Contrast recovery (CR) and background variability (BV) were measured from 3 repeated scans, reconstructed with the different algorithms. Fifteen oncology body 18F-FDG PET/CT scans were reconstructed using OSEM, OSEM PSF, and Q.Clear using B values of 200, 300, 400, and 500. These were visually analyzed by 2 scorers and scored by rank against a panel of parameters (overall image quality; background liver, mediastinum, and marrow image quality; noise level; and lesion detectability). Results: As β is increased, the CR and BV decreases; Q.Clear generally gives a higher CR and lower BV than OSEM. For the smallest sphere reconstructed with Q.Clear B400, CR is 28.4% and BV 4.2%, with corresponding values for OSEM of 24.7% and 5.0%. For the largest hot sphere, Q.Clear B400 yields a CR of 75.2% and a BV of 3.8%, with corresponding values for OSEM of 64.4% and 4.0%. Scorer 1 and 2 ranked B400 as the preferred reconstruction in 13 of 15 (87%) and 10 of 15 (73%) cases. The least preferred reconstruction was OSEM PSF in all cases. In most cases, lesion detectability was highest ranked for B200, in 9 of 15 (67%) and 10 of 15 (73%), with OSEM PSF ranked lowest. Poor lesion detectability on OSEM PSF was seen in cases of mildly 18F-FDG–avid mediastinal nodes in lung cancer and small liver metastases due to background noise. Conversely, OSEM PSF was ranked second highest for lesion detectability in most pulmonary nodule evaluation cases. The combined scores confirmed B400 to be the preferred reconstruction. Conclusion: Our phantom measurement results demonstrate improved CR and reduced BV when using Q.Clear instead of OSEM. A β value of 400 is recommended for oncology body PET/CT using Q.Clear.
- positron emission tomography
- image reconstruction
- Bayesian penalized likelihood
- NEMA
- image quality
- optimization
PET/CT is commonly performed in the staging of malignancy and in determining disease response, most commonly with 18F-FDG, although one of the limitations of PET is its relatively low, 5-mm, spatial resolution (1), which leads to failure to detect small lesions due to an underestimation of tracer uptake. Additionally, the use of semiquantitative analyses for differentiating benign from malignant disease with 18F-FDG, for instance, in pulmonary nodules and mediastinal lymph nodes in patients with lung cancer, is partially limited in its acceptance because there is no agreed standardized uptake value (SUV) for their differentiation (2). This is in part because technical factors such as the image reconstruction methodologies used affect the accuracy and reproducibility of SUV measurements (3,4).
Recently, GE Healthcare introduced a penalized-likelihood iterative PET reconstruction in their commercial software, termed Q.Clear, which is available on GE Healthcare PET/CT scanners. It includes point-spread function (PSF) modeling (5) and controls the noise through the use of a penalty term. Although penalized-likelihood algorithms have been in existence since 1987 (6), their clinical use has so far been limited. This Q.Clear algorithm includes a relative difference penalty (7), which is a function of the difference between neighboring voxels and a function of their sum (8). This penalty function acts as a noise suppression term and is controlled by a penalization factor (termed β), which is the only user-input variable to the algorithm with the γ factor in the penalty function set to 2. Modified block sequential regularized expectation maximization is used as an optimizer for this Q.Clear algorithm, which, because of the penalty function, allows an effective convergence to be achieved in images, potentially providing a more accurate SUV (8,9). This is in contrast to ordered-subset expectation maximization (OSEM) reconstructions, which have to be stopped before contrast convergence to prevent image noise increasing excessively (5,10). Accordingly, Q.Clear has been shown to significantly improve signal-to-noise in clinical scans, compared with OSEM (11–14), particularly in small faintly avid abnormalities (15,16).
The aim of this study was to determine the optimum penalization factor (β) for clinical use; this was achieved by masked clinical scoring of a subset of β values, which were determined from phantom studies.
MATERIALS AND METHODS
Phantom
A National Electrical Manufacturers Association (NEMA) image-quality phantom (17) was scanned on a Discovery 690 scanner (GE Healthcare), with the 4 smallest spheres filled with an activity concentration in a 4-to-1 ratio to the background activity concentration. The phantom was scanned following the NEMA procedure (17), repeating the scan 3 times. Images were reconstructed using our center’s standard time-of-flight (ToF) OSEM protocol (2 iterations, 24 subsets, 6.4-mm gaussian filter), a ToF OSEM PSF protocol (3 iterations, 24 subsets, 2-mm gaussian filter) (18), and Q.Clear (number of iterations is variable and dependent on the sinogram size) over a range of β values (100, 200, up to 1,000).
The data were analyzed using the NEMA analysis tool (GE Healthcare) to determine contrast recovery (CR) and background variability (BV) for each sphere (j) and reconstruction in addition to the residual lung error (LE) using methods defined by the NEMA standard (17), shown in Equations 1–3. Eq. 1
Eq. 1 Eq. 2
Eq. 2 Eq. 3Where CH,j is the average counts within a region of interest (ROI) drawn on each sphere j on the central PET slice, CB,j the average background counts for ROIs of the same size, aH the activity concentration in the hot spheres, aB the activity concentration in the background, SDj the SD of the background ROI counts, Clung,i the average counts for an ROI drawn in the lung insert on slice i, and CB,i the average background counts for slice i (17). LE is then given by the average of LEi for all PET slices. Contrast-to-noise ratio was defined as CR/BV. Paired t tests were used to test the significance of the differences between the reconstructions.
Clinical Evaluation
Case Selection
Informed consent is not necessary for retrospective reviews of this nature in our institution. Fifteen 18F-FDG PET/CT scans were retrospectively selected. The scans were selected to represent a range of pathology, all with prior histologic confirmation: subcentimeter pulmonary nodules, mildly 18F-FDG–avid mediastinal lymph nodes in non–small cell lung cancer, and small liver metastases. These were obtained between March 2011 and November 2013 for pulmonary nodule evaluation (5 scans), staging of non–small cell lung cancer (5 scans), and staging of colorectal cancer with known liver metastases (5 scans). There were 9 men and 6 women, with a weight range of 37–106 kg and a median weight of 72 kg.
18F-FDG PET/CT scans were acquired on a 3-dimensional mode ToF Discovery 690 PET/CT system with lutetium yttrium orthosilicate (LYSO) crystals (GE Healthcare). The patients were required to fast for at least 6 h before their scan. Their blood glucose was measured before intravenous injection of 18F-FDG (4 MBq/kg). Imaging commenced 90 min after injection and covered the skull base to upper thighs. The PET images were acquired under normal tidal respiration for 4 min per bed position. The CT was obtained using a pitch of 0.984, 120 kV, and automA with a noise index of 25.
Reconstruction and Analyses
PET images were reconstructed using 3 different algorithms, each of which used the CT scan for attenuation correction and the same normalization correction factors with scatter and randoms corrected as has been previously described (19–21). The standard PET reconstruction algorithm used at our center is ToF OSEM (VPFX; GE Healthcare), used with 2 iterations, 24 subsets, and 6.4-mm filter. The sinograms generated at the time of scanning were retrospectively processed using a ToF OSEM PSF protocol (3 iterations, 24 subsets, 2-mm filter) and the new Q.Clear reconstruction algorithm for penalization factors (β): 200, 300, 400, and 500.
Visual analyses of the OSEM, OSEM PSF, and Q.Clear PET images, 6 reconstructions per case, were performed by 2 consultants (designated scorer 1 and 2) with double accreditation in clinical radiology and nuclear medicine, and 11 and 3 y consultant experience, respectively. Images were viewed on an Advantage Workstation (AW4.6; GE Healthcare). The reconstructions were labeled A–F in a randomized order, with the CT component available for image fusion. Cases were reviewed sequentially, and the reconstructions were ranked (from 1 to 6) according to 6 image quality (IQ) parameters: overall IQ (1, excellent; 5, worst), background liver IQ (1, excellent; 5, worst), background mediastinum IQ (1, excellent; 5, worst), background marrow IQ (1, excellent; 5, worst), noise level (1, minimal; 5, unacceptable), and lesion detectability (1, excellent; 5, poor).
Scorers also indicated their most and least preferred reconstruction for each case. Interrater agreement on ranking within each of the 6 IQ parameters was assessed using Cohen’s κ statistic. The proportions of the highest- and lowest-ranked reconstructions were calculated for each parameter. Alongside the highest frequencies of the most and least preferred reconstruction indicated by the scorers, scores by both scorers for all parameters across the cases were summated for each reconstruction to confirm this quantitatively.
Statistical analyses were performed using SPSS Statistics 22.0 (IBM Corp.). κ values were interpreted using the guidelines laid out by Landis and Koch (22).
RESULTS
The results for the phantom study are summarized in Table 1, Figures 1–3, and Supplemental Figure 1 (supplemental materials are available at http://jnm.snmjournals.org). As the noise penalization factor (β) was increased, the CR and BV decreased for all spheres sizes whereas the LE increased (Table 1). Q.Clear reconstructions generally gave higher CR and lower BV than OSEM (Fig. 1; Supplemental Fig. 1). Q.Clear (independent of β) had a significantly (P < 0.0005) reduced LE, compared with both OSEM and OSEM PSF reconstruction (Fig. 2).
Mean CR and BV for Hot and Cold Spheres

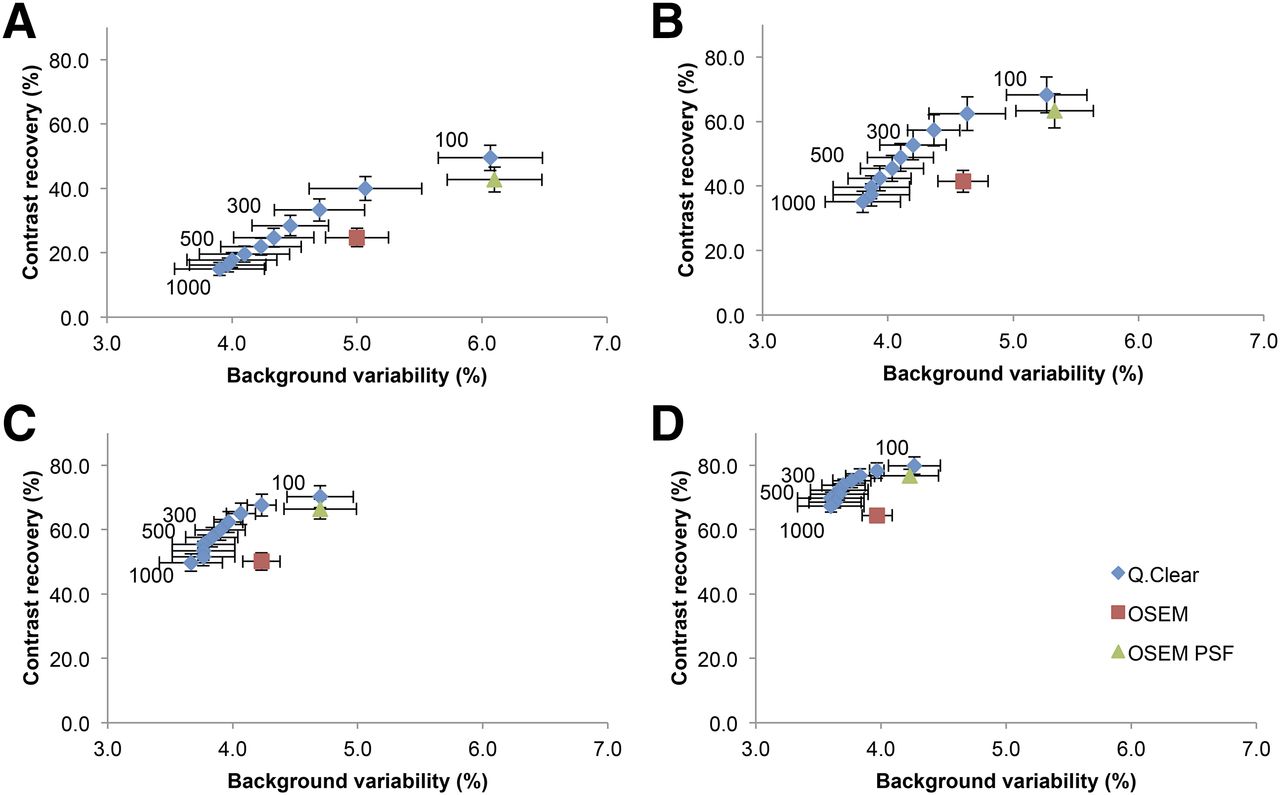
Graphs show mean CR and BV for hot spheres with diameters of 10 (A), 13 (B), 17 (C), and 22 mm (D) (cold spheres in Supplemental Fig. 1). These are shown for OSEM (2 iterations, 24 subsets, 6.4-mm filter), OSEM PSF (3 iterations, 24 subsets, 2-mm filter), and Q.Clear (β = 100–1,000, as labeled on the points). Error bars shown are 1 SD.

Graph of mean residual LE for OSEM (2 iterations, 24 subsets, 6.4-mm filter), OSEM PSF (3 iterations, 24 subsets, 2-mm filter), and Q.Clear (β = 100–1,000). Error bars shown are 1 SD.
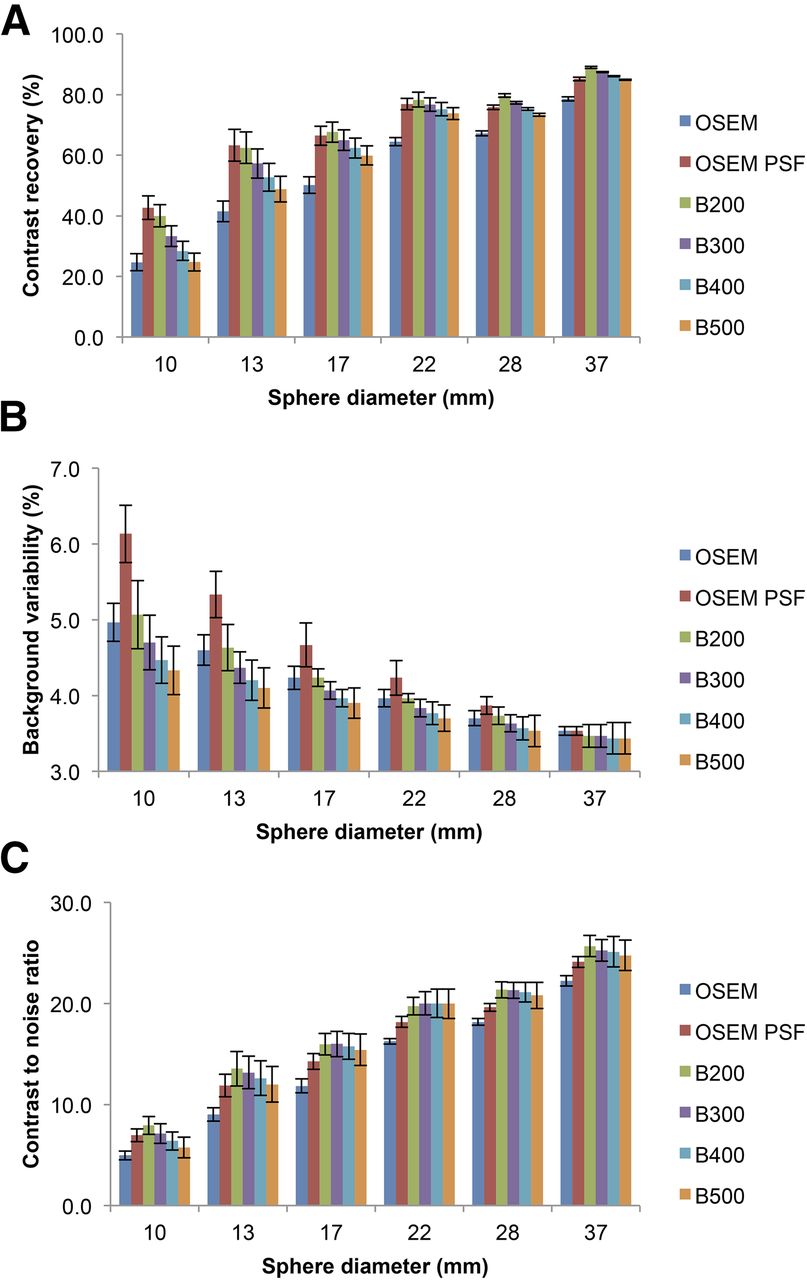
Graphs showing mean CR (A), BV (B), and contrast-to-noise ratio (C) for all spheres in NEMA IQ phantom (10, 13, 17, and 22 mm were hot and 28 and 37 mm cold). These are shown for OSEM (2 iterations, 24 subsets, 6.4-mm filter), OSEM PSF (3 iterations, 24 subsets, 2-mm filter), and Q.Clear (β = 200–500). Error bars shown are 1 SD.
In the clinical evaluation, there was moderate to substantial agreement between the 2 scorers on ranking the IQ parameters (Table 2). In most cases (87% and 73% by scorers 1 and 2, respectively), both scorers chose B400 (Bn indicates a Q.Clear reconstruction with a β value of n) as their most preferred reconstruction. The least preferred reconstruction was OSEM PSF in all cases. This was confirmed by the combined scores for each reconstruction: 570, 792, 494, 258, 262, and 862 (OSEM, B200, B300, B400, B500, and OSEM PSF, respectively).
Clinical Evaluation of Interrater Agreement and Individual IQ Parameter Rankings
For all of the individual IQ parameters, with the exception of lesion detectability, B400 and B500 were the most consistently highest-ranked and OSEM PSF the lowest-ranked reconstruction (Table 2).
For lesion detectability, both scorers ranked B200 the highest in all lung nodule cases and in most of the mediastinal node cases (scorer 1, 5/5 cases; scorer 2, 4/5 cases). There was more variation in ranking the liver metastases cases, in which B400 and B200 were ranked highest in 3 of 5 cases by scorers 1 and 2, respectively (Fig. 4). OSEM PSF was the lowest-ranked construction for all the liver metastases cases (Fig. 4) and most of the mediastinal node cases (scorer 1, 3/5 cases; scorer 2, 5/5 cases) because of the degree of inherent noise in these respective organs. In contrast, OSEM PSF ranked second highest for lesion detectability in most of the lung nodule cases (scorer 1, 5/5 cases; scorer 2, 4/5 cases) (Fig. 5), which is explained by low noise levels observed in the lungs.

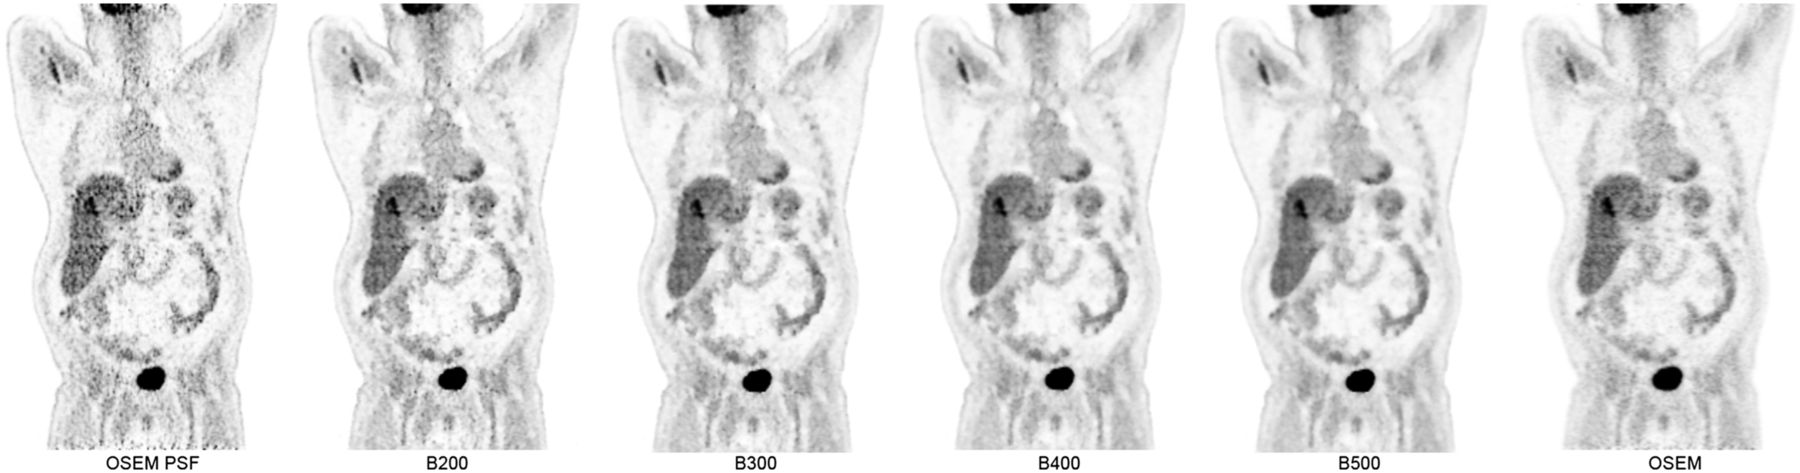
Coronal PET images demonstrating 18F-FDG–avid liver metastasis across OSEM and Q.Clear reconstructions. Smooth homogeneous appearance of background liver on Q.Clear reconstruction renders metastasis more conspicuous than OSEM PSF. Conversely, there is also risk of false-positive findings for small foci on OSEM PSF reconstruction because of high level of background noise. All images are displayed on SUV scale 0–6.
Axial PET images demonstrating 18F-FDG–avid 7-mm right upper lobe lung nodule. This was mildly 18F-FDG–avid on OSEM, but degree of uptake was shown to be higher using Q.Clear reconstruction. Despite similar degree of uptake on OSEM PSF, there was still low level of background noise from within lungs, which was reduced even on B200. Improvement in background noise within mediastinum, compared with OSEM PSF, is also illustrated. All images are displayed on SUV scale 0–6.
DISCUSSION
The aim of this study was to determine the optimum penalization factor (β) for the clinical use of Q.Clear. The phantom work was used to narrow the choice of β values used in the clinical part of the investigation and to investigate the properties of the new Q.Clear reconstruction.
Most Q.Clear reconstructions have a higher CR and lower BV than OSEM, suggesting that Q.Clear is an improved reconstruction (Table 1; Fig. 1). Although the increased CR with Q.Clear can be partly accounted for by the effective convergence achieved in Q.Clear (8,9), another reason to consider, especially for the small spheres, is the inclusion of PSF modeling into the Q.Clear algorithm. To consider this, OSEM PSF has also been included in the results. When Q.Clear is compared with OSEM PSF, some Q.Clear reconstructions have a higher CR and some lower, depending on the β value. With the exception of B100, Q.Clear reconstructions have lower BV than OSEM PSF. There is no statistically significant difference (P > 0.05) between BV from OSEM PSF or B100. There is therefore a choice to be made between increased CR (from OSEM PSF) and decreased BV (from Q.Clear). Ideally these points on the graph would lie in the top left of each figure (Fig. 1).
In our center, OSEM PSF is not used because of the noise seen in the clinical images (23), and so the B100 reconstruction can be discounted for the clinical part of the investigation because of its similarity to OSEM PSF. For high β values, it is possible to get a lower CR than OSEM, which is not ideal, despite the lower BV. For the smallest sphere (10 mm), there is a significant increase in CR for B100–400 (P < 0.003), no significant difference for B500 (P = 0.3), and a significant decrease in CR for B600–1,000 (P < 0.001) (Fig. 1A), confirming that it is appropriate to examine Q. Clear in the B200–500 range as that is where the main improvements can be seen, compared with standard OSEM reconstructions.
Considering the reconstructions assessed as part of the clinical investigation (OSEM, OSEM PSF, B200–B500) for all spheres, OSEM PSF and Q.Clear had higher CR than OSEM (Fig. 3A), which was significant (P < 0.003) for all but B500 for the smallest sphere. For the 2 smallest sphere sizes, OSEM PSF had the highest CR whereas for the remaining 4 sphere sizes B200 had the highest (Fig. 3A). The significances of these differences (between CR OSEM PSF and B200) for the 6 spheres from smallest to largest was a P value of 0.02, 0.0007, 0.006, 0.03, 0.001, and 0.0007, respectively. The absolute mean BV was less for Q.Clear than OSEM; however, this was not significant (P > 0.05) (Fig. 3B). OSEM PSF had higher BV than OSEM, and this was significant (P < 0.03) for all but the largest sphere (P = 0.3) (Fig. 3B). The contrast-to-noise ratio for all spheres was higher for Q.Clear than OSEM, which was significant (P < 0.05) for all but B500 for the largest and smallest sphere (both P = 0.08) (Fig. 3C). There was no statistical difference (P > 0.05) between the CNR from Q.Clear and OSEM PSF except for B200 for the 2 smallest spheres (P < 0.02).
The visual analysis of OSEM, OSEM PSF, and Q.Clear reconstructions of clinical scans mirrors the results of the phantom study. Overall, the IQ of reference organs and noise level was judged to be the best in Q.Clear reconstructions, specifically between B400 and B500, which produced a relatively smooth and homogeneous appearance of background structures (Figs. 4 and 5). OSEM PSF had the lowest ranking in these IQ parameters, where the degree of noise in background structures had been previously deemed unsuitable for use in our center. These results collectively reflect the aforementioned differences in BV between the various reconstructions.
CR was highest in most spheres using B200, followed by OSEM PSF, which was reflected in lesion detectability being ranked highest in the lung nodule cases on B200 and visually appearing similar to OSEM PSF (Fig. 5; Table 2). However, OSEM PSF and B200 were the lower ranked reconstructions in the cases of mildly 18F-FDG–avid mediastinal lymph nodes in non–small cell lung cancer and small liver metastases. This can be explained by the degree of inherent noise in the mediastinum and liver (Fig. 4), in comparison to the lung.
In most cases, B400 was selected as the most preferred reconstruction by both scorers. Considering the observed fall in CR beyond B500, this to some extent again corroborates the findings of the phantom study, suggesting that B400 would be the most appropriate choice that strikes a balance between optimizing CR and image noise levels.
The use of Q.Clear may have implications for the assessment and quantification of treatment response in cancer, in particular the improved detection of small foci, as demonstrated by the high CR and low BV in phantom work for B400. This may be particularly useful where abnormalities are surrounded by a degree of background tracer uptake (e.g., liver and mediastinum) and may increase the detection and diagnostic confidence of abnormalities in these areas.
There are several limitations to consider in this report. The number of cases and scorers used is small, and it is possible that increasing either or both of these variables may alter the preferred β value. It was also not possible to mask the scorers to the 2 different reconstruction algorithms, because Q.Clear has a visual appearance different from OSEM PSF at all β values, and this may have introduced bias. Additionally, this analysis is restricted to oncologic 18F-FDG PET/CT; neurologic PET/CT would require different parameters as is the case for standard OSEM. Caution should also be exercised where SUV thresholds for the diagnosis of likely malignant involvement are used in clinical practice as these may have to be adjusted if Q.Clear is adopted.
CONCLUSION
Q.Clear subjectively improves image quality and increases CR and decreases BV in phantom studies, compared with standard OSEM reconstructions. A β value of 400 appears to be the optimal value in 18F-FDG oncology PET/CT using the new Q.Clear reconstruction algorithm.
DISCLOSURE
The costs of publication of this article were defrayed in part by the payment of page charges. Therefore, and solely to indicate this fact, this article is hereby marked “advertisement” in accordance with 18 USC section 1734. A portion of this work was funded by a National Institute for Health Research (NIHR) Healthcare Scientist Chief Scientific Officer Doctoral Award. The research was supported by the NIHR Oxford Biomedical Research Centre Programme. This paper presents independent research funded by the NIHR. The views expressed are those of the authors and not necessarily those of the NHS, NIHR, or U.K. Department of Health. No other potential conflict of interest relevant to this article was reported.
Acknowledgments
We thank Alice Asseraf and Hugo Arques at GE Healthcare for their assistance in the processing of sinograms using Q.Clear.
Footnotes
↵* Contributed equally to this work.
Published online Jul. 9, 2015.
- © 2015 by the Society of Nuclear Medicine and Molecular Imaging, Inc.
REFERENCES
- Received for publication April 16, 2015.
- Accepted for publication July 7, 2015.


Jump to section
Related Articles
Cited By...
- Advantages and Challenges of Total-Body PET/CT at a Tertiary Cancer Center: Insights from Sun Yat-sen University Cancer Center
- Performance Characteristics of a New-Generation Digital Bismuth Germanium Oxide PET/CT System, Omni Legend 32, According to NEMA NU 2-2018 Standards
- Data-Driven Respiratory Gating Outperforms Device-Based Gating for Clinical 18F-FDG PET/CT
- Evaluation of Penalized-Likelihood Estimation Reconstruction on a Digital Time-of-Flight PET/CT Scanner for 18F-FDG Whole-Body Examinations
- Embrace Progress
- Studies of a Next-Generation Silicon-Photomultiplier-Based Time-of-Flight PET/CT System
- Performance Characteristics of the Whole-Body Discovery IQ PET/CT System
- Optimization of Image Reconstruction for 90Y Selective Internal Radiotherapy on a Lutetium Yttrium Orthosilicate PET/CT System Using a Bayesian Penalized Likelihood Reconstruction Algorithm