


Abstract
The resolution and quantitative accuracy of PET are highly influenced by the reconstruction method. Penalized-likelihood estimation algorithms allow for fully convergent iterative reconstruction, generating a higher image contrast than ordered-subsets expectation maximization (OSEM) while limiting noise. In this study, a type of penalized reconstruction known as block-sequential regularized expectation maximization (BSREM) was compared with time-of-flight OSEM (TOF OSEM). Various strengths of noise penalization factor β were tested along with various acquisition durations and transaxial fields of view (FOVs) with the aim of evaluating the performance and clinical use of BSREM for 18F-FDG PET/CT, both quantitatively and in a qualitative visual evaluation. Methods: Eleven clinical whole-body 18F-FDG PET/CT examinations acquired on a digital TOF PET/CT scanner were included. The data were reconstructed using BSREM with point-spread function recovery and β-factors of 133, 267, 400, and 533—and using TOF OSEM with point-spread function—for various acquisition times per bed position and various FOVs. Noise level, signal-to-noise ratio (SNR), signal-to-background ratio (SBR), and SUV were analyzed. A masked evaluation of visual image quality, rating several aspects, was performed by 2 nuclear medicine physicians to complement the analysis. Results: The lowest levels of noise were reached with the highest β-factor, resulting in the highest SNR, which in turn resulted in the lowest SBR. A β-factor of 400 gave noise equivalent to TOF OSEM but produced a significant increase in SUVmax (11%), SNR (22%), and SBR (12%). BSREM with a β-factor of 533 at a decreased acquisition duration (2 min/bed position) was comparable to TOF OSEM at a full acquisition duration (3 min/bed position). Reconstructed FOV had an impact on BSREM outcome measures; SNR increased and SBR decreased when FOV was shifted from 70 to 50 cm. The evaluation of visual image quality resulted in similar scores for reconstructions, although a β-factor of 400 obtained the highest mean whereas a β-factor of 267 was ranked best in overall image quality, contrast, sharpness, and tumor detectability. Conclusion: In comparison with TOF OSEM, penalized BSREM reconstruction resulted in an increased tumor SUVmax and an improved SNR and SBR at a matched level of noise. BSREM allowed for a shorter acquisition than TOF OSEM, with equal image quality.
- PET/CT
- FDG
- image reconstruction
- penalization factor
- block-sequential regularized expectation maximization
PET/CT with 18F-FDG is a well-established powerful tool for noninvasive quantitative imaging of physiologic and pathologic processes in vivo. The quantitation accuracy of tracer uptake is affected by several factors, including the transformation of collected emission data into reconstructed images. This study investigated the performance of a new penalized-likelihood reconstruction algorithm and its impact on image quality and quantification of tracer accumulation (SUV), as compared with the standard nonregularized ordered-subsets expectation maximization (OSEM).
Statistical iterative reconstruction methods such as maximum-likelihood expectation maximization were first mentioned in the late 1970s (1,2), and OSEM, a modified expectation maximization method, has been used for clinical image reconstruction for more than 20 y (3). In contrast to analytic methods, there are no closed-form solutions available using statistical approaches. The algorithm must be stopped before convergence is reached in order to avoid image degradation due to excessive noise. However, stopping before convergence leads to a bias in the final image estimate toward the initial estimate, as well as a nonuniform convergence in which large volumes of high tracer activity converge more rapidly than adjacent small volumes and low-activity areas. Penalized-likelihood expectation maximization allows for fully convergent iterative reconstruction, leading to higher image contrast than for OSEM while limiting noise.
Block-sequential regularized expectation maximization (BSREM) (Q.Clear; GE Healthcare) is a penalized-likelihood estimation reconstruction algorithm recently developed to improve quantitation accuracy while maintaining high image quality (Eq. 1) (4). By adding a penalty function to the objective function, the algorithm enforces conditions on the image estimate that allow for full convergence and edge preservation (Eq. 2) (5,6). Fully convergent iterative methods require excess computational time, but the block-sequential approach reduces computational time (3). Previous shortcomings of penalized reconstruction methods, such as blocky artifacts and patchy images, are overcome by activity-dependent smoothing and spatially modulated penalty parameters. The image estimates using BSREM are based on priors, and the algorithm can be expressed by the following objective function: Eq. 1where x is the image estimate based on PET measurements y, L is the Poisson log likelihood, and R describes the relative-difference penalty function (7):
 Eq. 2In Equation 2, Nj is a set of neighbors of the jth voxel, wj and wk are weights of the relative-difference function, and γ in the potential function controls edge preservation. The β-factor is a positive regularization parameter that controls the trade-off between noise level and resolution and is the only user-input variable in the commercially available version of the Q.Clear software (8).
BSREM has been shown to provide better quantitation accuracy than OSEM in phantom studies and clinical studies with simulated lesions (9–11). Lesion detectability with BSREM has also been found to be higher than or equal to that with OSEM (11,12). A few evaluations of visual image quality have been conducted, and they showed that images acquired with BSREM are considered equal to or better than images acquired with OSEM (9,13). A recent observer study investigated the clinical performance of BSREM with 4 different β-factors of between 300 and 400 (13). A combined phantom and observer study found a β-factor of 400 to be the optimal penalization factor based on signal-to-background ratio (SBR). A semiquantitative and visual analysis was performed with a β-factor of 400 for diagnosis of mediastinal lymph nodes and pulmonary nodules and found that SBR, signal-to-noise ratio (SNR), and SUVmax increased compared with OSEM, although no improvement in accuracy could be seen (9,14,15).
In the present study, the performance of BSREM was investigated for 4 different penalization factors β within the range of 133–533 to evaluate clinical use for whole-body 18F-FDG PET/CT on a digital time-of-flight (TOF) PET/CT scanner. The primary aim was to compare quantitative results with the standard reconstruction method, TOF OSEM with point-spread function (PSF) recovery, together with a visual assessment of image quality by 2 observers. The secondary aim was to investigate the effect of different transverse fields of view (FOVs) and image acquisition times per bed position on BSREM.
MATERIALS AND METHODS
Data Acquisition
PET Scanner
All scans were performed on a Discovery MI PET/CT device (GE Healthcare). This TOF-capable scanner has lutetium yttrium oxyorthosilicate detectors coupled to silicon photomultipliers, with axial and transaxial FOVs of 20 and 70 cm, respectively, producing 71 image planes with a 2.79-mm slice thickness. The TOF resolution of the scanner is approximately 370 ps, sensitivity is 14 cps/kBq, and intrinsic spatial resolution is about 4.0 mm at the center of the FOV (16).
National Electrical Manufacturers Association (NEMA) Phantom
A NEMA image quality phantom with sphere diameters of 10, 13, 17, 22, 28, and 37 mm was used (17). The phantom background was filled with approximately 20 MBq of 18F, and the spheres were filled with a 4 times higher radioactivity concentration. The phantom was scanned until 100 million prompt counts were acquired.
Clinical Data
Data from the 3-dimensional whole-body 18F-FDG PET/CT scans of 11 patients were included in this study. For 8 oncologic patients, the intravenously administered activity was 3.7 ± 0.2 MBq/kg (mean ± SD; range, 3.6–4.0 MBq/kg) and the uptake time between administration and imaging was 67 ± 6 min (range, 58–75 min). For the remaining 3 patients, who were imaged because of suspected inflammatory disease, the administered activity was 5.9 ± 0.1 MBq/kg (range, 5.8–5.9 MBq/kg) and the uptake time was 187 ± 5 min (range, 183–194 min). All PET/CT examinations were performed from the proximal femur to the base of the skull with an acquisition time of 3 min per bed position (min/bp). The images were anonymized before reconstruction and further analysis and were not used for clinical patient diagnosis; this study was therefore not covered by the Swedish law on ethics review for research in humans, and no application to the ethics review board was required.
Image Reconstruction
NEMA Phantom
Images were reconstructed using TOF OSEM (3 iterations, 16 subsets, and a 5-mm gaussian postprocessing filter) with PSF compensation, as recommended by the manufacturer for standard clinical image reconstruction, and also using TOF BSREM including PSF (from here on referred to as BSREM) with β-factors of 133, 267, 400, and 533. A 50-cm FOV was used with a 256 × 256 matrix, resulting in a 1.95 × 1.95 × 2.79 mm pixel size.
Clinical Data
For each patient’s PET/CT examination, 20 reconstructions were produced for analysis using the manufacturer’s software (version Columbia PET.96). PET images were reconstructed in the same manner as for the phantom, with a transaxial FOV of both 50 and 70 cm, resulting in a nearly isotropic pixel size of 2.73 × 2.73 × 2.79 mm for the 70-cm FOV. In addition to the 3 min/bp reconstruction, list-mode files were rebinned using only the first 2 and 1 min/bp and reconstructed again using the 70-cm FOV.
Image Analysis
NEMA Phantom
Using in-house–developed software in MATLAB (MathWorks), regions of interest (ROIs) were automatically placed to include the spheres, background, and lung insert of the phantom images, as specified by the NEMA protocol. In addition, spheric volumes of interest (VOIs) with diameters identical to each sphere were placed to include the spheres.
Background variability as a measure of image noise was defined as the SD of the activity concentration in all individual voxels in the largest background ROIs located ±4 cm from the plane containing the sphere centers, divided by the mean activity of these background ROIs. Contrast-to-noise ratio (CNR) was calculated as contrast recovery (Eq. 3) divided by background variability, and lung residual correction error was calculated as the mean counts in the lung VOI divided by the mean counts in the background ROIs. Eq. 3where C is counts and a is activity in hot and background ROIs (subscript H and B, respectively).
Clinical Data
Images were analyzed using the PET/CT Review tool on an Advantage Workstation (AW 4.7 extension 8; GE Healthcare). Level of noise was defined as SD normalized to SUVmean of a large spheric reference VOI placed in normal liver. SNR was calculated as lesion SUVmax divided by noise level, and SBR was calculated as lesion SUVmax divided by SUVmean of the liver reference. Lesions were delineated using a 41% threshold of the maximum voxel value in the TOF OSEM image; a bookmark containing the location of the delineated lesion was then propagated to the BSREM reconstructed images, creating new VOIs using 41% thresholding. In this study, the optimal β-factor was defined in terms of yielding a noise level equivalent to that of TOF OSEM.
Visual Evaluation
The quantitative analysis was supplemented by a visual evaluation of image quality by 2 nuclear medicine physicians with more than 20 y of experience in diagnostic 18F-FDG PET. Ten examinations were assessed, each including 5 reconstructions (TOF OSEM and BSREM with β-factors of 133, 267, 400, and 533). Before assessment, all data were anonymized with regard to patient identity and reconstruction method. The 3-dimensional PET image sets were evaluated one by one in a randomized order and scored per an arbitrary 4-grade scale (poor, moderate, good, and very good) for 7 different parameters (overall image quality, contrast, sharpness, presence of artifacts, noise level, homogeneity of liver background, and tumor detectability). A first case was used as a training case and read by both reviewers in consensus. All PET examinations in the visual evaluation were reconstructed using a 50-cm FOV and 3 min/bp. A coregistered intravenous contrast-enhanced CT examination was available with each reconstruction to provide an anatomic reference.
Statistical Analysis
A paired Student t test was used to investigate differences in assessment scores between reconstruction methods. Statistical significance was considered present for P values of less than 0.05. Spearman rank correlation (ρ) was used to determine the association between different parameters.
RESULTS
NEMA Phantom
Phantom results are displayed in Figure 1. The residual correction error of the lung was lower for all BSREM β-factors than for TOF OSEM (∼2.5% vs. 7%, respectively). Background variability increased with decreasing β-factor, whereas CNR decreased with decreasing sphere diameter and decreasing β-factor. The difference in CNR between reconstruction methods increased with increasing sphere diameter: With a β-factor of more than 267, CNR was higher for BSREM than for TOF OSEM for all spheres, with 61% higher CNR for a β-factor of 533 for the 10-mm sphere (CNR: 9.7 vs. 6.0 for BSREM vs. TOF OSEM, respectively).

NEMA image quality phantom reconstruction data showing background variability (A) and CNR as function of sphere diameter (B). Reconstruction methods were TOF OSEM (3 iterations, 16 subsets, 5-mm gaussian postprocessing filter, and PSF) and BSREM (including TOF and PSF) with β-factors of 133, 267, 400, and 533 and 50-cm FOV.
Clinical Data
Eleven clinical PET/CT examinations with 25 lesions in total were included in the analysis. The mean lesion size was 9.6 ± 15.6 cm3 (range, 0.5–69.4 cm3), with an SUVmax of 11.2 ± 6.6 (range, 2.6–28.4), measured in TOF OSEM images with a 3 min/bp acquisition and a 70-cm FOV. The mean liver reference volume was 19.2 ± 0.6 cm3 (range, 18.0–19.6 cm3), with an SUVmean of 2.1 ± 0.3 (range, 1.6–2.6) (Table 1).
Quantitative Measures of Reference Sphere in Healthy Liver Tissue Using TOF OSEM and BSREM
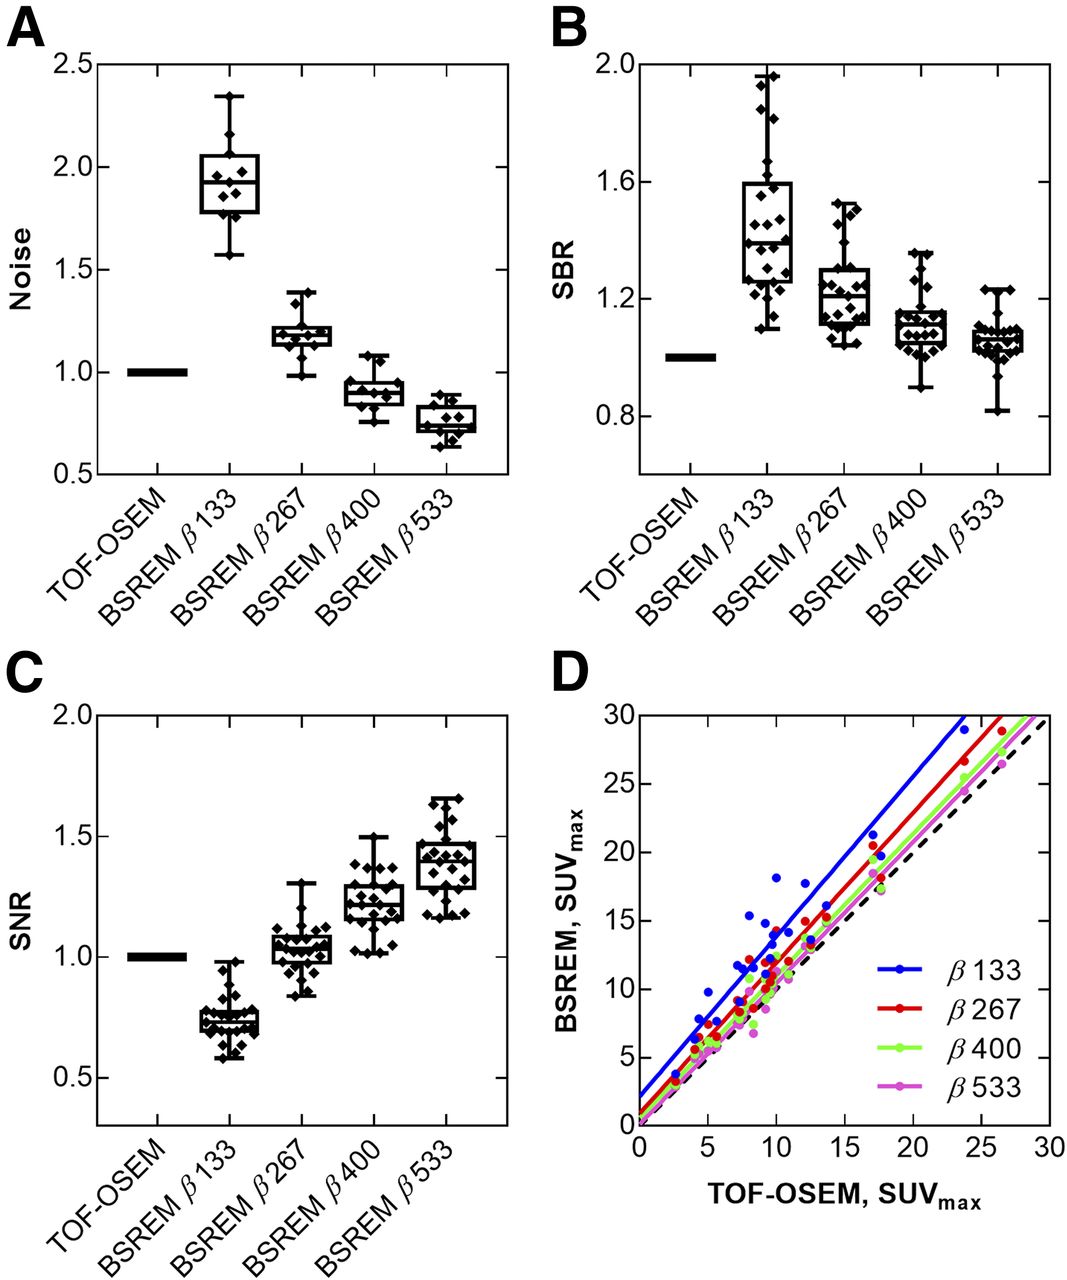
The choice of penalization factor influenced the image both visually and quantitatively as shown by the example in Figure 2. The lowest level of noise was reached with the highest β-factor, resulting in the highest SNR and in turn the lowest SBR. Compared with TOF OSEM, BSREM with a β-factor of 400 produced—in reconstructions with a 70-cm FOV and a 3-min acquisition—a mean lesion SUVmax that was increased by 11% (from 11.2 to 12.2), a mean SNR that was increased by 22% (from 99.3 to 120.6), and a mean SBR that was increased by 12% (from 5.4 to 6.0) (Fig. 3). Applying an SUVmean threshold of greater than 3 resulted in more lesions detected with BSREM than with TOF OSEM, regardless of β-factor (24 lesions with BSREM with β-factors of 133, 267, 400, and 533, vs. 21 lesions with TOF OSEM).

Coronal whole-body 18F-FDG PET images of patient with inflammatory disease, demonstrating ovarian uptake (arrows) by SUVmax obtained with respective reconstruction method. Images were reconstructed with 70-cm FOV and 3 min/bp acquisition, using TOF OSEM (3 iterations, 16 subsets, 5-mm gaussian postprocessing filter, and PSF) and BSREM (including TOF and PSF) with β-factors of 133, 267, 400, and 533.

Quantitative data from 18F-FDG PET/CT examinations of 11 patients with total of 25 lesions. Box plots show noise level (A), SBR (B), and SNR (C) for different reconstruction methods, and correlation plot shows SUVmax (D) for BSREM compared with TOF OSEM. Reconstruction methods were TOF OSEM (3 iterations, 16 subsets, 5-mm gaussian postprocessing filter, and PSF) and BSREM (including TOF and PSF) with β-factors of 133, 267, 400, and 533; 70-cm FOV; and 3 min/bp acquisition. All data were normalized to data obtained by TOF OSEM. Dashed line represents line of identity.
Lesion Size Dependence
In comparisons of BSREM with TOF OSEM, the relative difference in SUVmax was generally larger for smaller lesions, irrespective of β-factor. The mean increase in SUVmax for BSREM with a β-factor of 400 was 16% for lesions with volume of less than 3 cm3 and 8% for a volume of more than 3 cm3, and the trend was similar for SNR (26% and 18%, respectively) and SBR (17% and 9%, respectively). There was a small negative association between percentage increase in SUVmax and lesion volume over the entire cohort (ρ = −0.3).
Acquisition Duration
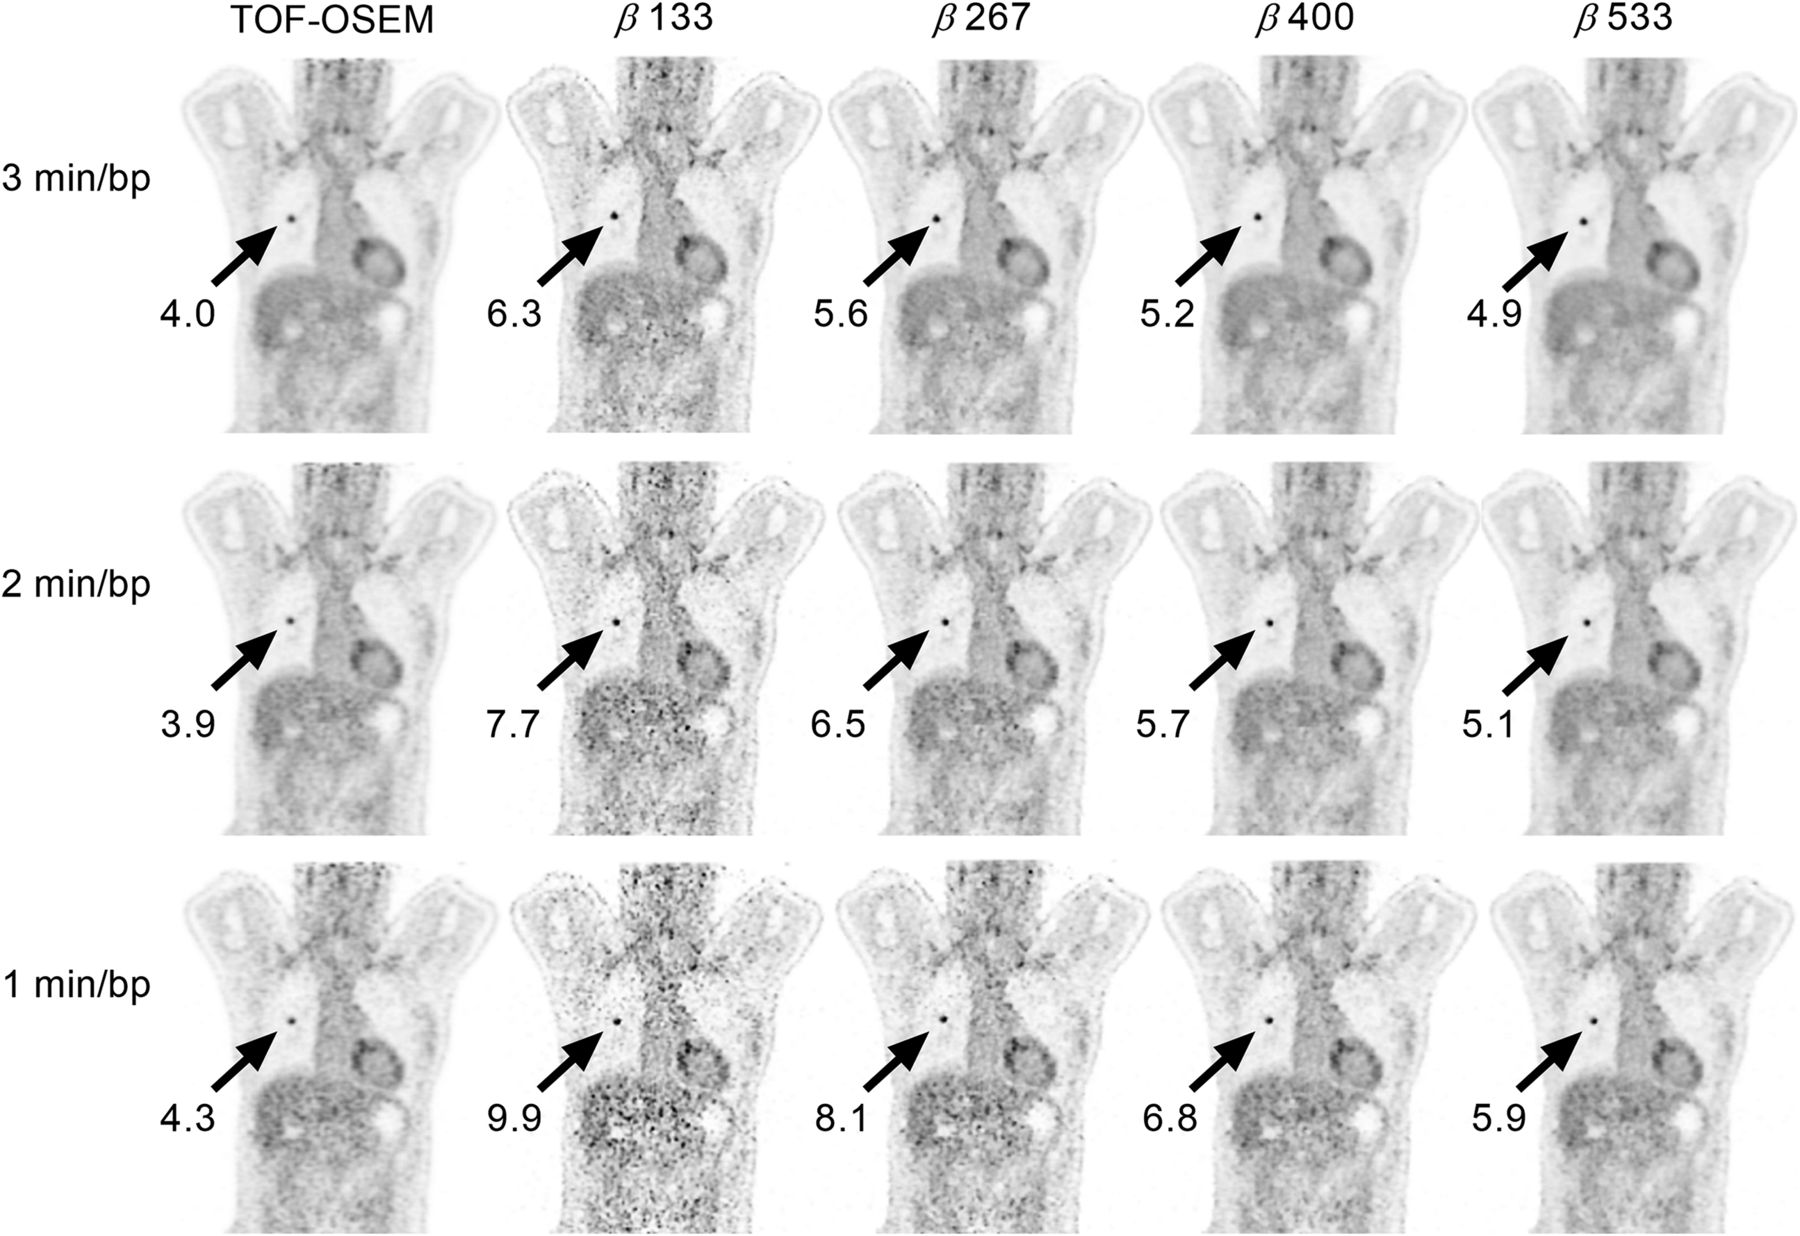
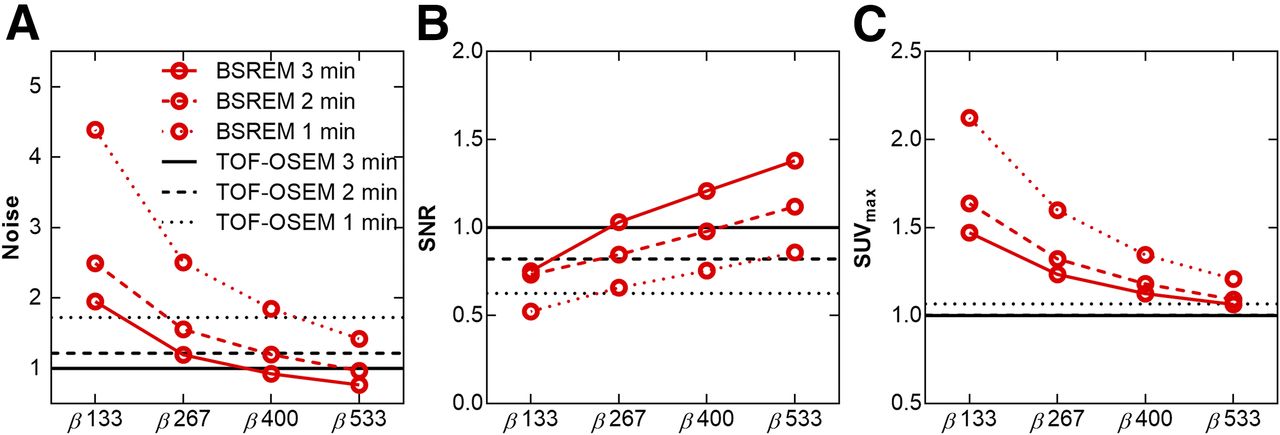
Visual and quantitative differences in various acquisition times are exemplified in Figure 4. Decreasing the acquisition from 3 to 2 min/bp changed the optimal β-factor to 533 to reach a noise level equivalent to that of 3 min/bp TOF OSEM images while maintaining a higher SNR (Fig. 5). For BSREM with a β-factor of 533 at a 2 min/bp acquisition duration, SUVmax increased by 9%, SNR by 12%, and SBR by 10%, compared with TOF OSEM at a full acquisition duration. The noise level was higher than in 3 min/bp TOF OSEM images for all β-factors using a 1 min/bp acquisition.

Coronal whole-body 18F-FDG PET images of patient with adenocarcinoma, demonstrating SUVmax of lesion (arrows) obtained with respective reconstruction method (gray scale 0–6). Images were reconstructed with 70-cm FOV using TOF OSEM (3 iterations, 16 subsets, 5-mm gaussian postprocessing filter, and PSF) and BSREM (including TOF and PSF) with β-factors of 133, 267, 400, and 533 for 3, 2, and 1 min/bp acquisitions.

Mean noise level (A), SNR (B), and SUVmax (C) for different reconstruction methods and PET acquisition durations (3, 2, and 1 min/bp). Reconstruction methods were TOF OSEM (3 iterations, 16 subsets, 5-mm gaussian postprocessing filter, and PSF) and BSREM (including TOF and PSF) with β-factors of 133, 267, 400, and 533 and 70-cm FOV. All data were normalized to data obtained by TOF OSEM.
FOV Dependence
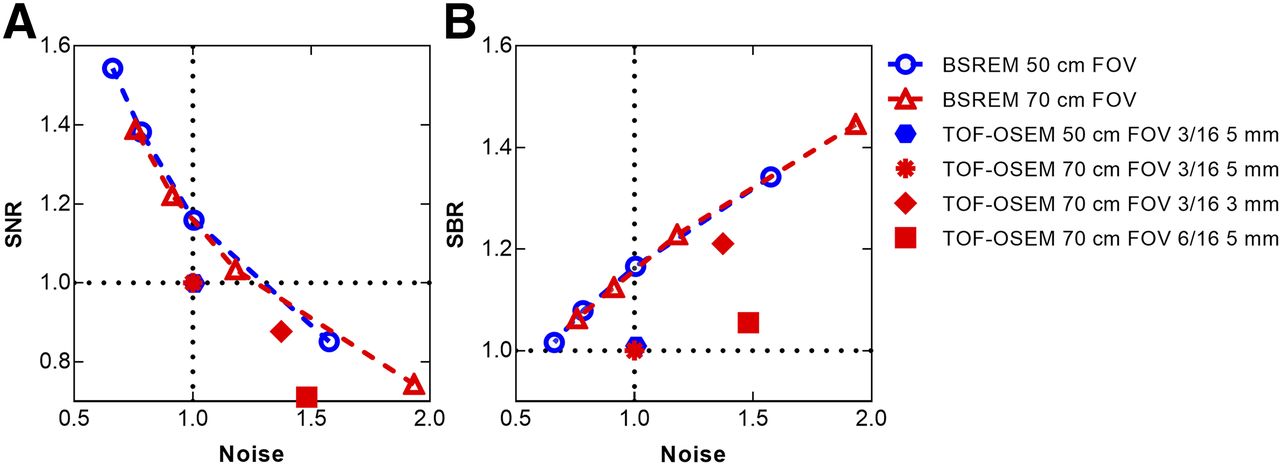
Quantitative measures using TOF OSEM were not affected by a change in reconstructed FOV from 70 to 50 cm, as opposed to BSREM, for which SNR increased and SBR decreased. Background noise decreased with a smaller FOV, giving a noise level equivalent to that of TOF OSEM with a β-factor of 267 instead of a β-factor of 400. The trade-off between SNR and noise, and between SBR and noise, using different FOVs followed the same curvatures (Fig. 6). At noise equivalence, there was an increase in both SNR and SBR for BSREM compared with TOF OSEM.

Trade-off curves showing SNR vs. noise (A) and SBR vs. noise (B) for reconstructions using TOF OSEM (3 iterations, 16 subsets, 5-mm gaussian postprocessing filter, and PSF) and BSREM (including TOF and PSF) with β-factors of 133, 267, 400, and 533 and transaxial FOV of 50 cm (blue) and 70 cm (red). Decreasing β-factor is seen with increasing noise for BSREM data points in both plots. All data were normalized to TOF OSEM with 70-cm FOV, and data points represent mean values. For reference, additional reconstructions with 70-cm FOV using TOF OSEM with PSF and 3 iterations, 16 subsets, and 3-mm gaussian postprocessing filter, and TOF OSEM with PSF and 6 iterations, 16 subsets, and 5-mm gaussian postprocessing filter, are also shown in both graphs.
Visual Evaluation
Reconstruction using BSREM with a β-factor of 267 was ranked highest in the observers’ assessment concerning overall image quality, whereas BSREM with a β-factor of 400 obtained a higher total mean for all aspect scores (Fig. 7; Supplemental Table 1; supplemental materials are available at http://jnm.snmjournals.org). Images with lower β-factors were considered to have good contrast but a high level of noise compared with TOF OSEM and higher β-factors. TOF OSEM was ranked higher than BSREM with β-factors of 400 and 533 regarding contrast and sharpness but lower regarding noise level and liver background. BSREM with β-factors of 267, 400, and 533 were regarded as better than TOF OSEM in terms of tumor detectability. The evaluation resulted in overall minor differences between reconstruction methods, not only in the total score but also within each category. Interobserver agreement was good for the presence of artifacts and tumor detectability but lower for scoring contrast, whereas interobserver agreement concerning reconstruction method was best for TOF OSEM and a β-factor of 267 and worst for a β-factor of 133. The total mean score of both observers ranked a β-factor of 133 as the least preferred reconstruction, with TOF OSEM next to last, and a β-factor of 400 as most favored.
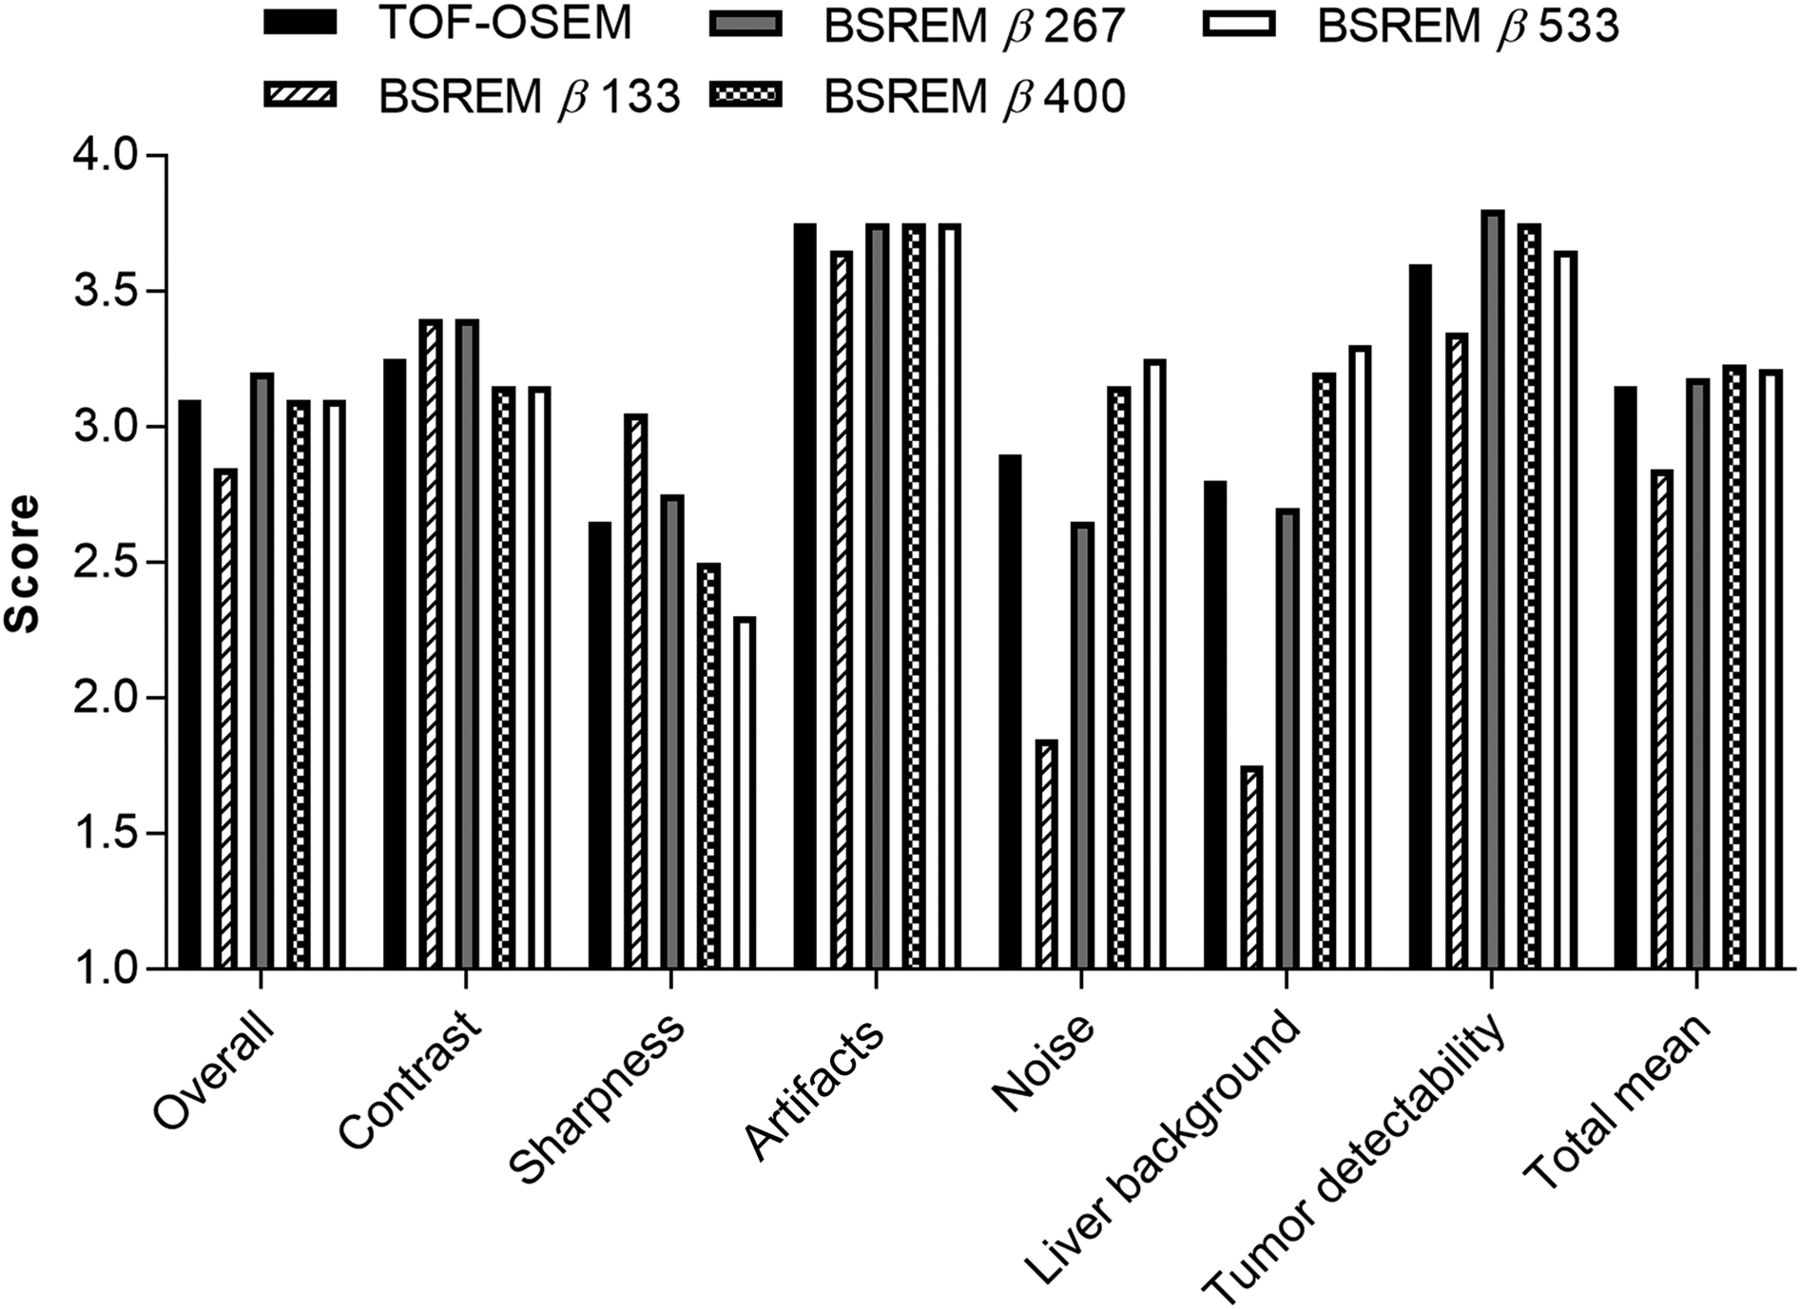
Visual scoring of image quality by 2 observers per arbitrary scale (1, poor; 2, moderate; 3, good; 4, very good). Seven different aspects of image quality were considered, and last category in plot represents summarized total mean score. There were 5 sets of images for each of 10 patients. Reconstruction used TOF OSEM (3 iterations, 16 subsets, 5-mm gaussian postprocessing filter, and PSF) and BSREM (including TOF and PSF) with β-factors of 133, 267, 400, and 533; 50-cm FOV, and 3 min/bp acquisition.
DISCUSSION
This study addressed the relationship between noise level and resolution in BSREM-reconstructed images and evaluated the optimal algorithm settings for clinical diagnosis in oncologic patients and patients with inflammatory or infectious disease. This relatively new algorithm has been investigated previously, but not for data acquired on a digital TOF PET/CT scanner and not while varying the acquisition time and FOV. The digital silicon photomultiplier detector technology and improved timing resolution of the Discovery MI result in improved sensitivity and count rate statistics compared with conventional PET/CT systems (16,18,19). This investigation showed that it is challenging to specify one β-factor that is overall optimal. The choice of β-factor depends on whether the primary requirement is shorter acquisition, lower radiation dose, higher image quality, or better lesion depiction. In clinical PET/CT imaging, all these factors need to be considered and harmonized to generate, on the one hand, the best possible image quality and, on the other hand, a low radiation dose to the patient and reasonable acquisition times to achieve a swift workflow.
BSREM was compared with TOF OSEM using 3 iterations, 16 subsets, and a 5-mm gaussian postprocessing filter. Evaluation of TOF OSEM with a larger number of iterations or a narrower filter would have led to a higher SBR and higher noise levels, and correspondingly to noise equivalent to BSREM for lower β-factors. However, we chose to use the settings recommended by the manufacturer as our reference, and further optimization of OSEM was outside the scope of this work. Nevertheless, to illustrate the effect of a narrower filter or more iterations in TOF OSEM, we included some additional data in Figure 6. This shows that the signal obtained using TOF OSEM will never increase to match that of BSREM without a simultaneous increase in noise to a higher level than for BSREM.
The range of β-factors—from 133 to 533 in steps of 133—chosen in this work may seem somewhat peculiar and in need of further explanation. These values were based on the implementation of BSREM in the Discovery MI pilot reconstruction software, for which β-factors were initially 50% too high in terms of background noise, compared with β-factors used on other GE Healthcare systems. The β-factors were corrected in the final release of the software, so that a β-factor of 200 in the pilot software translated to 133 in the final software, and so on. Our initially chosen β-factors of 200–800 in steps of 200 thus translated into 133–533 in steps of 133.
The phantom study showed both similarities to and differences from the clinical image assessment. In the phantom study, the lowest background variability and highest CNR were for BSREM with a β-factor of 533; however, for clinical image reading, noise level and SNR were optimal for a β-factor of 533, whereas a β-factor of 133 resulted in the best SBR. For clinical whole-body 18F-FDG PET/CT imaging purposes, BSREM with a β-factor of 400, resulting in a high SNR, a high SBR, and a noise level like that of TOF OSEM with a 5-mm gaussian postprocessing filter, would probably be the optimal choice, also considering the EANM guidelines suggesting a maximum coefficient of variation below 15%, which is consistently reached only for β-factors of 400 and higher (20).
In the visual evaluation, 7 image quality criteria were assessed using a 4-grade arbitrary scale. The scoring methods of previous studies vary considerably in number of quality criteria and grading scales. Usually, merely a few grades are applied for each image criterion, but a 100-grade slide-ruler scale has also been used (9,13–15). In the present study, a 4-grade scale was, however, considered sufficient to avoid ranking difficulties. Ranking of all PET examinations for each patient, from best to worst, constitutes an alternative scoring method that was not considered appropriate for the present study.
The 2 observers were masked to patient identity and order of reconstruction method but were well aware of the principles of BSREM and the influence of the β-factor on the resulting images. When assessing a new technique in imaging, there is always an inherent problem in that the observers are trained to read images reconstructed with a well-known technique and applying standard parameters. Consequently, the observers in the present study were well acquainted with TOF OSEM images and might therefore have been biased and rated these higher than the BSREM images. All PET/CT examinations had been performed on patients in whom disseminated cancer with clearly 18F-FDG–avid metastases—or inflammatory or infectious disease with clearly 18F-FDG–avid foci—had been diagnosed on PET/CT with a high level of confidence. Possible differences in image quality grading between reconstruction methods might therefore have been more evident had the evaluation been done using images from patients with smaller and less 18F-FDG–avid lesions. Furthermore, a group larger than the 11 patients in the present study might also have increased these differences. Analysis of a larger number of tumor lesions over a wider volume range could also have improved the results concerning SUV lesion volume dependence. The results of this study were, however, in concordance with previous study results (11,12,14,15).
A shorter image acquisition is preferable in terms of both patient comfort and patient throughput, allowing for more PET/CT examinations per day. This study showed that the acquisition can be reduced from 3 to 2 min/bp when BSREM is used instead of TOF OSEM, for a mean saving of 5 min for a scan of 5 bed positions. Reducing the acquisition to 1 min/bp would, however, require a higher β-factor than was tested in the present study to result in noise levels similar to those of TOF OSEM. Another option is to lower the administered activity instead of shortening the acquisition, allowing for reduced radiation doses, which would be especially favorable for younger patients.
Image noise increased when the transaxial FOV was extended, causing a shift to the right in the trade-off curves illustrating the relationship between SNR and noise as well as SBR and noise (Fig. 6). The shift can be related to the specific penalty modulation of the BSREM algorithm (Steve Ross of GE Healthcare, written communication, December 2017).
Differences in uptake and biodistribution between PET tracers might influence the choice of β-factor. The optimal settings of the BSREM algorithm for whole-body 18F-FDG PET/CT may therefore not necessarily produce the desired results for PET/CT with other tracers and should therefore be evaluated separately for each PET tracer in a clinical setting. Further future research should also investigate the relation between intensity variations in dynamic PET acquisitions and SUV measurements.
CONCLUSION
In comparison with TOF OSEM, penalized-likelihood BSREM reconstruction resulted in an increased tumor SUVmax and an improved SNR and SBR at a matched level of noise. BSREM allowed for a shorter acquisition per bed position than TOF OSEM, with equal image quality.
DISCLOSURE
This work was partly financed by research collaboration between Uppsala University Hospital and GE Healthcare. No other potential conflict of interest relevant to this article was reported.
Acknowledgments
We acknowledge the team at the Uppsala University Hospital PET Centre for their assistance in image acquisition, reconstruction, and data handling. We also thank Tarik Cengiz, Dr. Charles Stearns, and Dr. Steve Ross from GE Healthcare for discussions, assistance, and support.
Footnotes
Published online Feb. 15, 2018.
- © 2018 by the Society of Nuclear Medicine and Molecular Imaging.
REFERENCES
- Received for publication August 22, 2017.
- Accepted for publication January 25, 2018.


