


Abstract
The aim of this study was to assess the physical performance of a new PET/CT system, the Discovery IQ with 5-ring detector blocks. Methods: Performance was measured using the National Electrical Manufacturers Association NU2-2012 methodology. Image quality was extended by accounting for different acquisition parameters (lesion-to-background ratios [8:1, 4:1, and 2:1] and acquisition times) and reconstruction algorithms (VUE-point HD [VPHD], VPHD with point-spread-function modeling [VPHD-S], and Q.Clear). Tomographic reconstruction was also assessed using a Jaszczak phantom. Additionally, 30 patient lesions were analyzed to account for differences in lesion volume and SUV quantification between reconstruction algorithms. Results: Spatial resolution ranged from 4.2 mm at 1 cm to 8.5 mm at 20 cm. Sensitivity measured at the center and at 10 cm was 22.8 and 20.4 kps/kBq, respectively. The noise-equivalent counting rate peak was 124 kcps at 9.1 kBq/cm3. The scatter fraction was 36.2%. The accuracy of correction for count losses and randoms was 3.9%. In the image quality test, contrast recovery for VPHD, VPHD-S, and Q.Clear ranged from 18%, 18%, and 13%, respectively (hot contrast; 10-mm sphere diameter; ratio, 2:1), to 68%, 67%, and 81%, respectively (cold contrast; 37-mm sphere diameter; ratio, 8:1). Background variability ranged from 3.4%, 3.0%, and 2.1%, respectively (ratio, 2:1), to 5.5%, 4.8%, and 3.7%, respectively (ratio, 8:1). On Q.Clear reconstruction, the decrease in the penalty term (β) increased the contrast recovery coefficients and background variability. With the Jaszczak phantom, image quality increased overall when a reconstruction algorithm modeling the point-spread function was used, and use of Q.Clear increased the signal-to-noise ratio. Lesions analyzed using VPHD-S and Q.Clear had an SUVmean of 6.5 ± 3 and 7 ± 3, respectively (P < 0.01), and an SUVmax of 11 ± 4.8 and 12 ± 4, respectively (P < 0.01). No significant difference in mean lesion volume was found between algorithms. Conclusion: Among the various Discovery bismuth germanium oxide–based PET/CT scanners, the IQ with 5-ring detector blocks has the highest overall performance, with improved sensitivity and counting rate performance. Q.Clear reconstruction improves the PET image quality, with higher recovery coefficients and lower background variability.
PET imaging has the ability to offer valuable functional information, playing a key role in the diagnosis, staging, and evaluation of cancer; the planning of radiotherapy; and the diagnosis of some types of dementia (1). Improvements in hardware and reconstruction methods have improved the performance of PET scanners (2). Since the introduction of hybrid PET/CT scanners, and especially with the latest-generation tomographs, most commercial manufacturers have opted to include high–time-resolution detectors, based on lutetium oxyorthosilicate (3,4) and lutetium-yttrium oxyorthosilicate (5–8) crystals, to improve time-of-flight localization. However, GE Healthcare maintains a line of PET/CT scanners based on bismuth germanium oxide (BGO) detectors (9,10), opting for a higher sensitivity at a lower detector price. Higher PET scanner sensitivity has also been achieved by adopting the 3-dimensional mode, without any interplane septa, which increases sensitivity by a factor of 4–6 over the 2-dimensional mode (2). Extension of the axial field of view (FOV) is an additional method to improve sensitivity, with an 81% gain having been reported (11).
Recently, GE Healthcare departed from its non–time-of-flight PET/CT scanner series in designing the Discovery IQ (D-IQ), which introduces a new configuration of the detector block allowing the number of detector rings to be increased from 2 to 5 along the axial FOV and hence improving system sensitivity. The scanner also includes a new reconstruction algorithm, Q.Clear, which has been shown to significantly improve signal-to-noise ratio and SUV quantification in a lutetium-yttrium oxyorthosilicate PET/CT scanner (6), when compared with ordered-subsets expectation maximization.
Our first purpose in this study was to test the physical performance of the new D-IQ PET/CT scanner in its 5-ring configuration. We used the National Electrical Manufacturers Association (NEMA) NU2-2012 (12)—the gold standard for acceptance testing and comparison of systems—as well as some additional tests. Our second purpose was to evaluate the possible advantages of using Q.Clear in both phantom and clinical images.
MATERIALS AND METHODS
Scanner Characteristics
The D-IQ combines a BGO-based PET tomograph with a 16-slice CT scanner. When used in its 5-ring configuration (D-IQ-5), the system enables an axial and transaxial physical FOV of 26 and 70 cm, respectively, with 79 image planes and 3.27-mm plane spacing. The typical bed overlap ranges from 19% to 24% (representing 50–60 mm). Its LightBurst unit has 5 blocks of detectors in the axial direction, consisting of 6.3 × 6.3 × 30 mm BGO crystals, configuring an 8 × 8 matrix for each block. There are 36 detector units per ring and, in total, 720 photomultipliers. The ring diameter is 74 cm. The coincidence window is 9.5 ns, and the lower and higher energy thresholds are 425 and 650 keV, respectively. The manufacturer introduced a dual-channel acquisition to optimize performance in low– and high–counting rate acquisitions, reducing dead-time losses and pileup. In addition, each detector block includes 4 temperature sensors to model detection performance upon temperature variations. The system allows 3-dimensional and 4–dimensional acquisition modes, with an axial coincidence acceptance of ±39 planes.
The CT component can cover a scanning FOV of 50 cm and a reconstruction FOV of 70 cm to match the PET images. Its HiLight Matrix II detector, with 21,888 elements, consists of 24 detector rows covering 20 mm (sixteen 0.625-mm rows and eight 1.25-mm rows).
Reconstruction Algorithms
The D-IQ-5 software includes 2 principal algorithms, VUE-point HD (VPHD) and Q.Clear. VPHD uses fully 3-dimensional maximum-likelihood ordered-subsets expectation maximization incorporating corrections for scatter and random coincidences, dead time, attenuation, and normalization into the iterative reconstruction. VPHD also has the option of including point-spread-function modeling (VPHD-S) (13). The variable parameters are iterations, subsets, and filtering. The software can specify an in-plane gaussian filter with a specific cutoff and a light, standard, or heavy z-axis filter.
Q.Clear is the commercial name for a Bayesian penalized likelihood reconstruction algorithm available in the new generation of PET/CT scanners from the manufacturer. It includes point-spread-function modeling and regularization controlled by a penalty term (β), which is the only user input. The penalty function acts as a noise suppression term (14); a more detailed description can be found in the supplemental materials (available at http://jnm.snmjournals.org). Filtered backprojection is not included as a reconstruction method.
Scanner Performance Evaluation
The performance of the PET scanner was evaluated mainly following the NEMA NU2-2012 standard (12), using the software included in the scanner and in-house software. The different tests are briefly described below, as well as the changes introduced to extend them.
Spatial Resolution
Spatial resolution is a measure of the ability to distinguish between two points after the image is reconstructed. Measurements were performed by preparing 3 hematocrit capillary tubes filled with a pointlike 18F drop. The prepared point sources were less than 1 mm in diameter, and the activity in each drop was approximately 4.5 MBq. They were placed using a source holder, and the acquisition fulfilled NEMA specifications (12).
Data were reconstructed using the VPHD algorithm (matrix, 256 × 256; FOV, 25; 12 iterations; 12 subsets; gaussian filter with 2-mm cutoff). Spatial resolution was calculated as full-width at half-maximum and full-width at tenth-maximum of the reconstructed point-spread function using the manufacturer’s software.
Sensitivity
The sensitivity test measures the rate of coincidence detection events that the scanner creates for every unit of activity in the FOV. Measurements were made for different amounts of attenuating material, with the results extrapolated to give the sensitivity for no attenuating material. The random coincidences were subtracted from prompts to obtain the trues-only sensitivity results.
We used the NEMA PET sensitivity phantom (Data Spectrum Corp.), which meets NEMA specifications (12). The tube was filled with 3.33 MBq of 18F, in order to assume that count losses are negligible. For each sleeve surrounding the line source, successive measurements were performed with the phantom suspended in the center of the transaxial FOV and at a radial distance of 10 mm from the scanner axis. For each aluminum sleeve, data were acquired for 60 s.
Scatter Fraction and Counting Rate
The count losses and randoms portion of this test measures the counting rate performance of the scanner as a function of the present activity, and the scatter fraction measures the relative system sensitivity to scattered radiation.
The phantom used NEMA specifications (12). The line source was filled with an activity concentration of approximately 50 MBq/mL at the time of acquisition. Data were acquired for 17.5 h, resulting in 36 frames. Frames 1–20 were acquired consecutively for 15 min each. Frames 21–25 were acquired for 25 min each with a delay of 25 min between each consecutive pair. The remaining 2 frames were acquired for 25 min each but without delay. The scatter fraction and noise-equivalent counting rate were determined as described in the NEMA NU2-2012 standard using software provided by the manufacturer.
Count Losses and Randoms Corrections
The accuracy of count losses and randoms corrections was measured by comparing the trues rate calculated using count losses and randoms corrections, with the trues rate extrapolated from a weighted least-squares fit assuming negligible count losses and randoms. Data recorded for the scatter fraction and counting rate test were reconstructed with an 18-cm FOV in a 128 × 128 matrix, using VPHD (with 2 iterations, 12 subsets, a gaussian filter with a 6.4-mm cutoff, and a standard z-axis filter), and corrected for dead time, randoms, scatter, and attenuation.
Image Quality
The NEMA International Electrotechnical Commission body phantom—consisting of 6 spheres with diameters of 10, 13, 17, 22, 28, and 37 mm and a cylindric lung insert—and the NEMA scatter phantom were used to evaluate image quality. Both phantoms were positioned according to NEMA standards (12). The activity in the line source of the scatter phantom was 100 MBq at the start of the first acquisition. The body phantom was filled with an initial radioactivity concentration of 5.5 kBq/cm3. The 2 largest spheres were filled with nonradioactive water, and the remaining spheres had lesion-to-background ratios (LBRs) of 4:1 and 8:1 (as stated by the NEMA test) and 2:1. Three sequential measurements of 350 s each were acquired for a single bed position in list mode.
All data were corrected for random coincidences, normalization, dead-time losses, scatter, and attenuation. Images were reconstructed with VPHD and VPHD-S, both using a clinical protocol of 4 iterations, 12 subsets, and a 4.8-mm gaussian filter and Q.Clear with a β of 350 (matrix, 256 × 256; FOV, 70 cm). To evaluate the effect of the reconstruction parameters, images were also reconstructed with the following settings: VPHD and VPHD-S using 8 iterations, 12 subsets, and a 2.0-mm gaussian filter, and Q.Clear with a β of 50.
The acquisition time and reconstruction parameters for the image quality testing were those suggested by the manufacturer for acceptance testing and did not reproduce our clinical settings for a 70-kg patient with a 185-MBq injected activity and a 2-min acquisition per bed position. From the phantom list-mode acquisitions, three 60-s frames were generated to simulate the same statistics as are acquired for a patient, and the images were reconstructed using Q.Clear with a β of 350. The data were processed using custom software developed in-house using MATLAB (The MathWorks) and following NEMA specifications to obtain cold and hot contrast recovery coefficients, lung residual error, and background variability.
The Jaszczak phantom (Data Spectrum Corp.) was used to assess image quality and resolution when different reconstructions were applied. This phantom is a cylinder fillable with water, with an internal diameter of 21.6 cm. The lower portion of the cylinder contains 6 sets of acrylic rods arranged in a pie-shaped pattern and with the following diameters: 4.8, 6.4, 7.9, 9.5, 11.1, and 12.7 mm. This allows evaluation of spatial resolution in the transaxial direction. The phantom was filled with a total activity of 25 MBq, providing a concentration of approximately 4.2 kBq/cm3, and the acquisition lasted 350 s. The data were reconstructed with VPHD, VPHD-S, and Q.Clear, using a 70-cm FOV and the same reconstruction parameters as for the other image quality tests.
Patient Studies
Thirty lesions from 16 patients (mean body weight, 69 ± 14 kg) were analyzed to account for differences in clinical 18F-FDG SUVs between algorithms. The administered activity was 2.5 MBq/kg (mean, 187 ± 38 MBq), and the images were acquired 60 min after injection. The Q.Clear and VPHD-S reconstruction times were about 5 min and 2 min, respectively, per bed position. For VPHD-S, images were reconstructed using 4 iterations, 12 subsets, a 4.8-mm filter, and a standard z-axis filter. For Q.Clear (β = 350), images were reconstructed using a 256 × 256 matrix and a 70-cm FOV. For each patient, lesions were analyzed in 3 ways: by a volume of interest drawn using a 41% segmentation threshold, by SUVmax and SUVmean, and by lesion volume (corresponding to the segmented volume). In addition, a spheric 5-cm3 volume of interest was positioned on the healthy liver to account for possible differences in noise variability; noise was defined as the ratio of SUVmean to the SD of uptake in the liver volume of interest (15). Data normality was determined using the Shapiro–Wilks test. The paired 2-tailed Student t test was used to compare lesion parameters between VPHD-S and Q.Clear.
RESULTS
Scanner Performance
The tangential, axial, and radial resolutions for the different point source positions, reconstructed using VPHD, are summarized in Table 1, which lists FWHMs and FWTMs for 1, 10, and 20 cm as an average over both axial positions stated by the NEMA procedure. The sensitivity was 22.80 cps/kBq at the center and 20.43 cps/kBq at 10 cm. Figure 1 presents the sensitivity profile depending on the offset.
Spatial Resolution for D-IQ-5 According to NEMA Procedure Using VPHD

Axial sensitivity profile for measurements in center of FOV and at 10-cm radial offset.
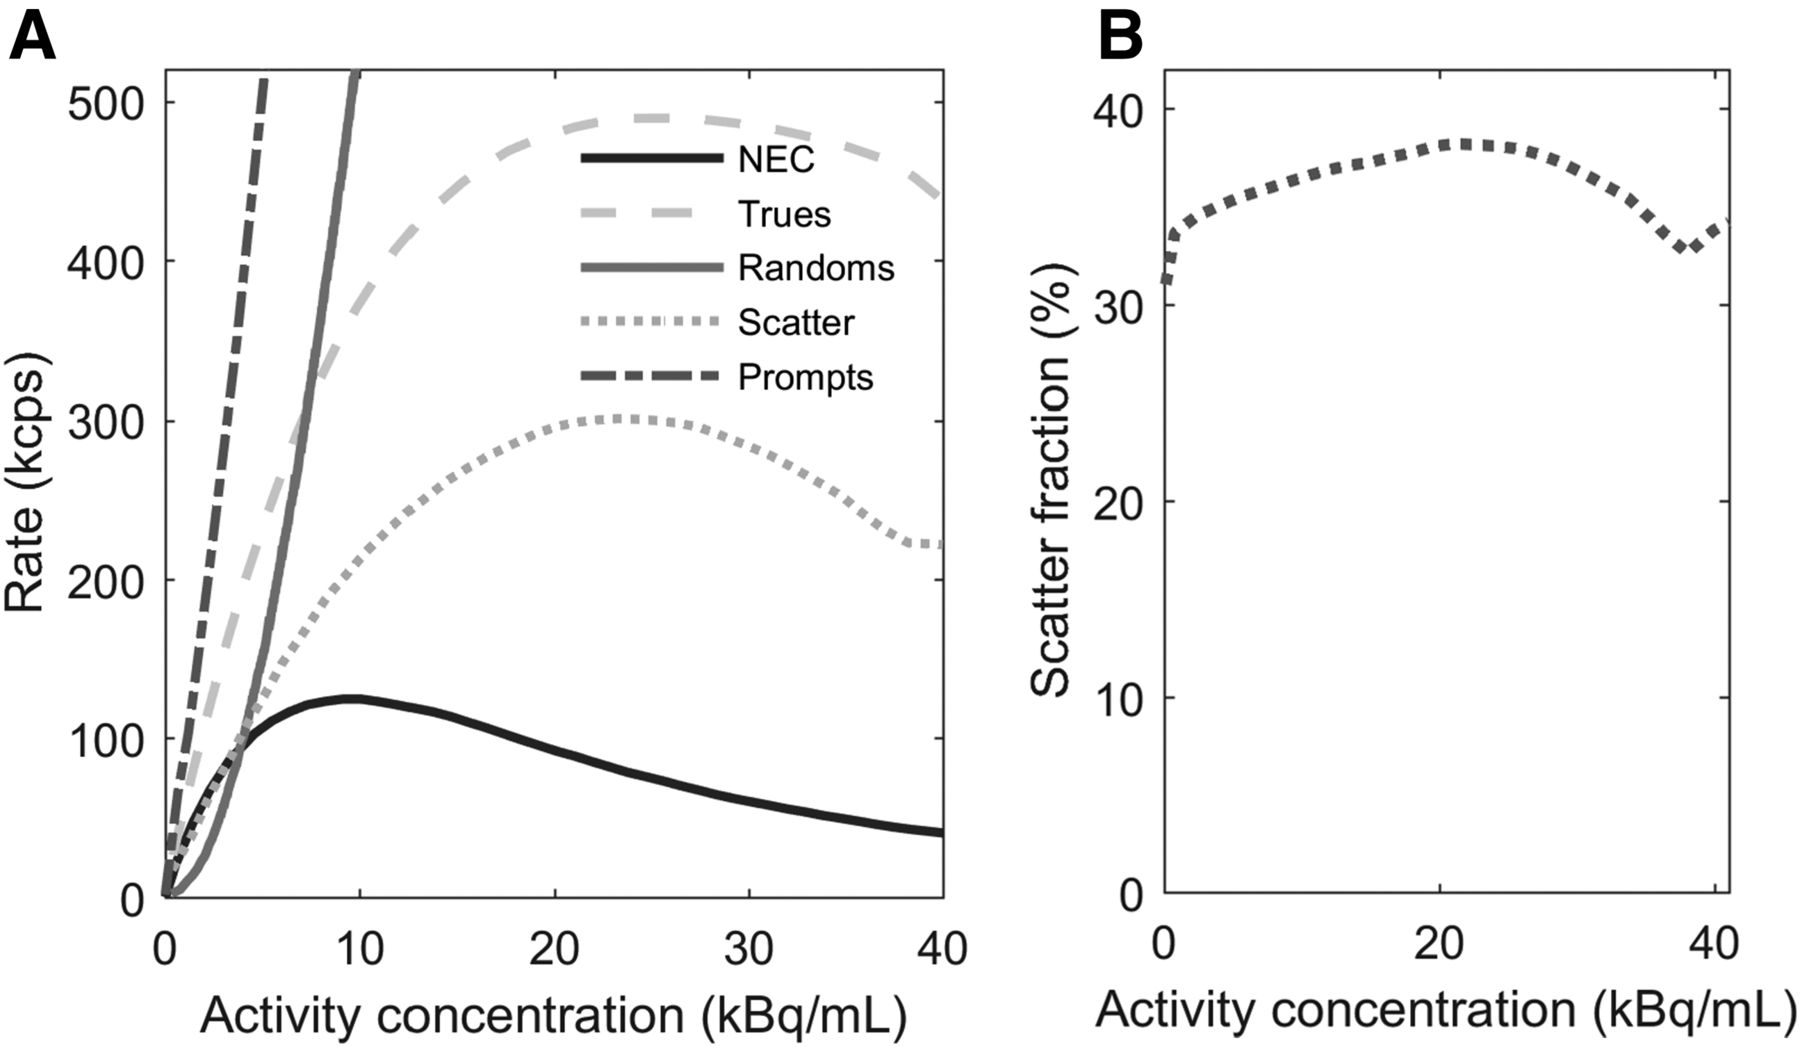
The peak noise-equivalent counting rate was at 123.6 kcps at a concentration of 9.1 kBq/mL, and the scatter fraction measured at the peak was 36.2%. The peak true counting rate was at 490.1 kcps at 25.8 kBq/mL. The noise-equivalent counting rate curve and counting rate values as a function of activity are presented in Figure 2, including true, random, and scatter events as well as total prompts. The maximum absolute error below the noise-equivalent counting rate peak was 3.9%. For the true rate versus the effective activity concentration, Figure 3 presents the maximum, mean, and minimum errors for all activity concentrations.

(A) Counting rate curves for true, random, scatter, and total events and noise-equivalent counting rate curve (NEC) as function of activity concentration. (B) Scatter fraction as function of activity concentration.
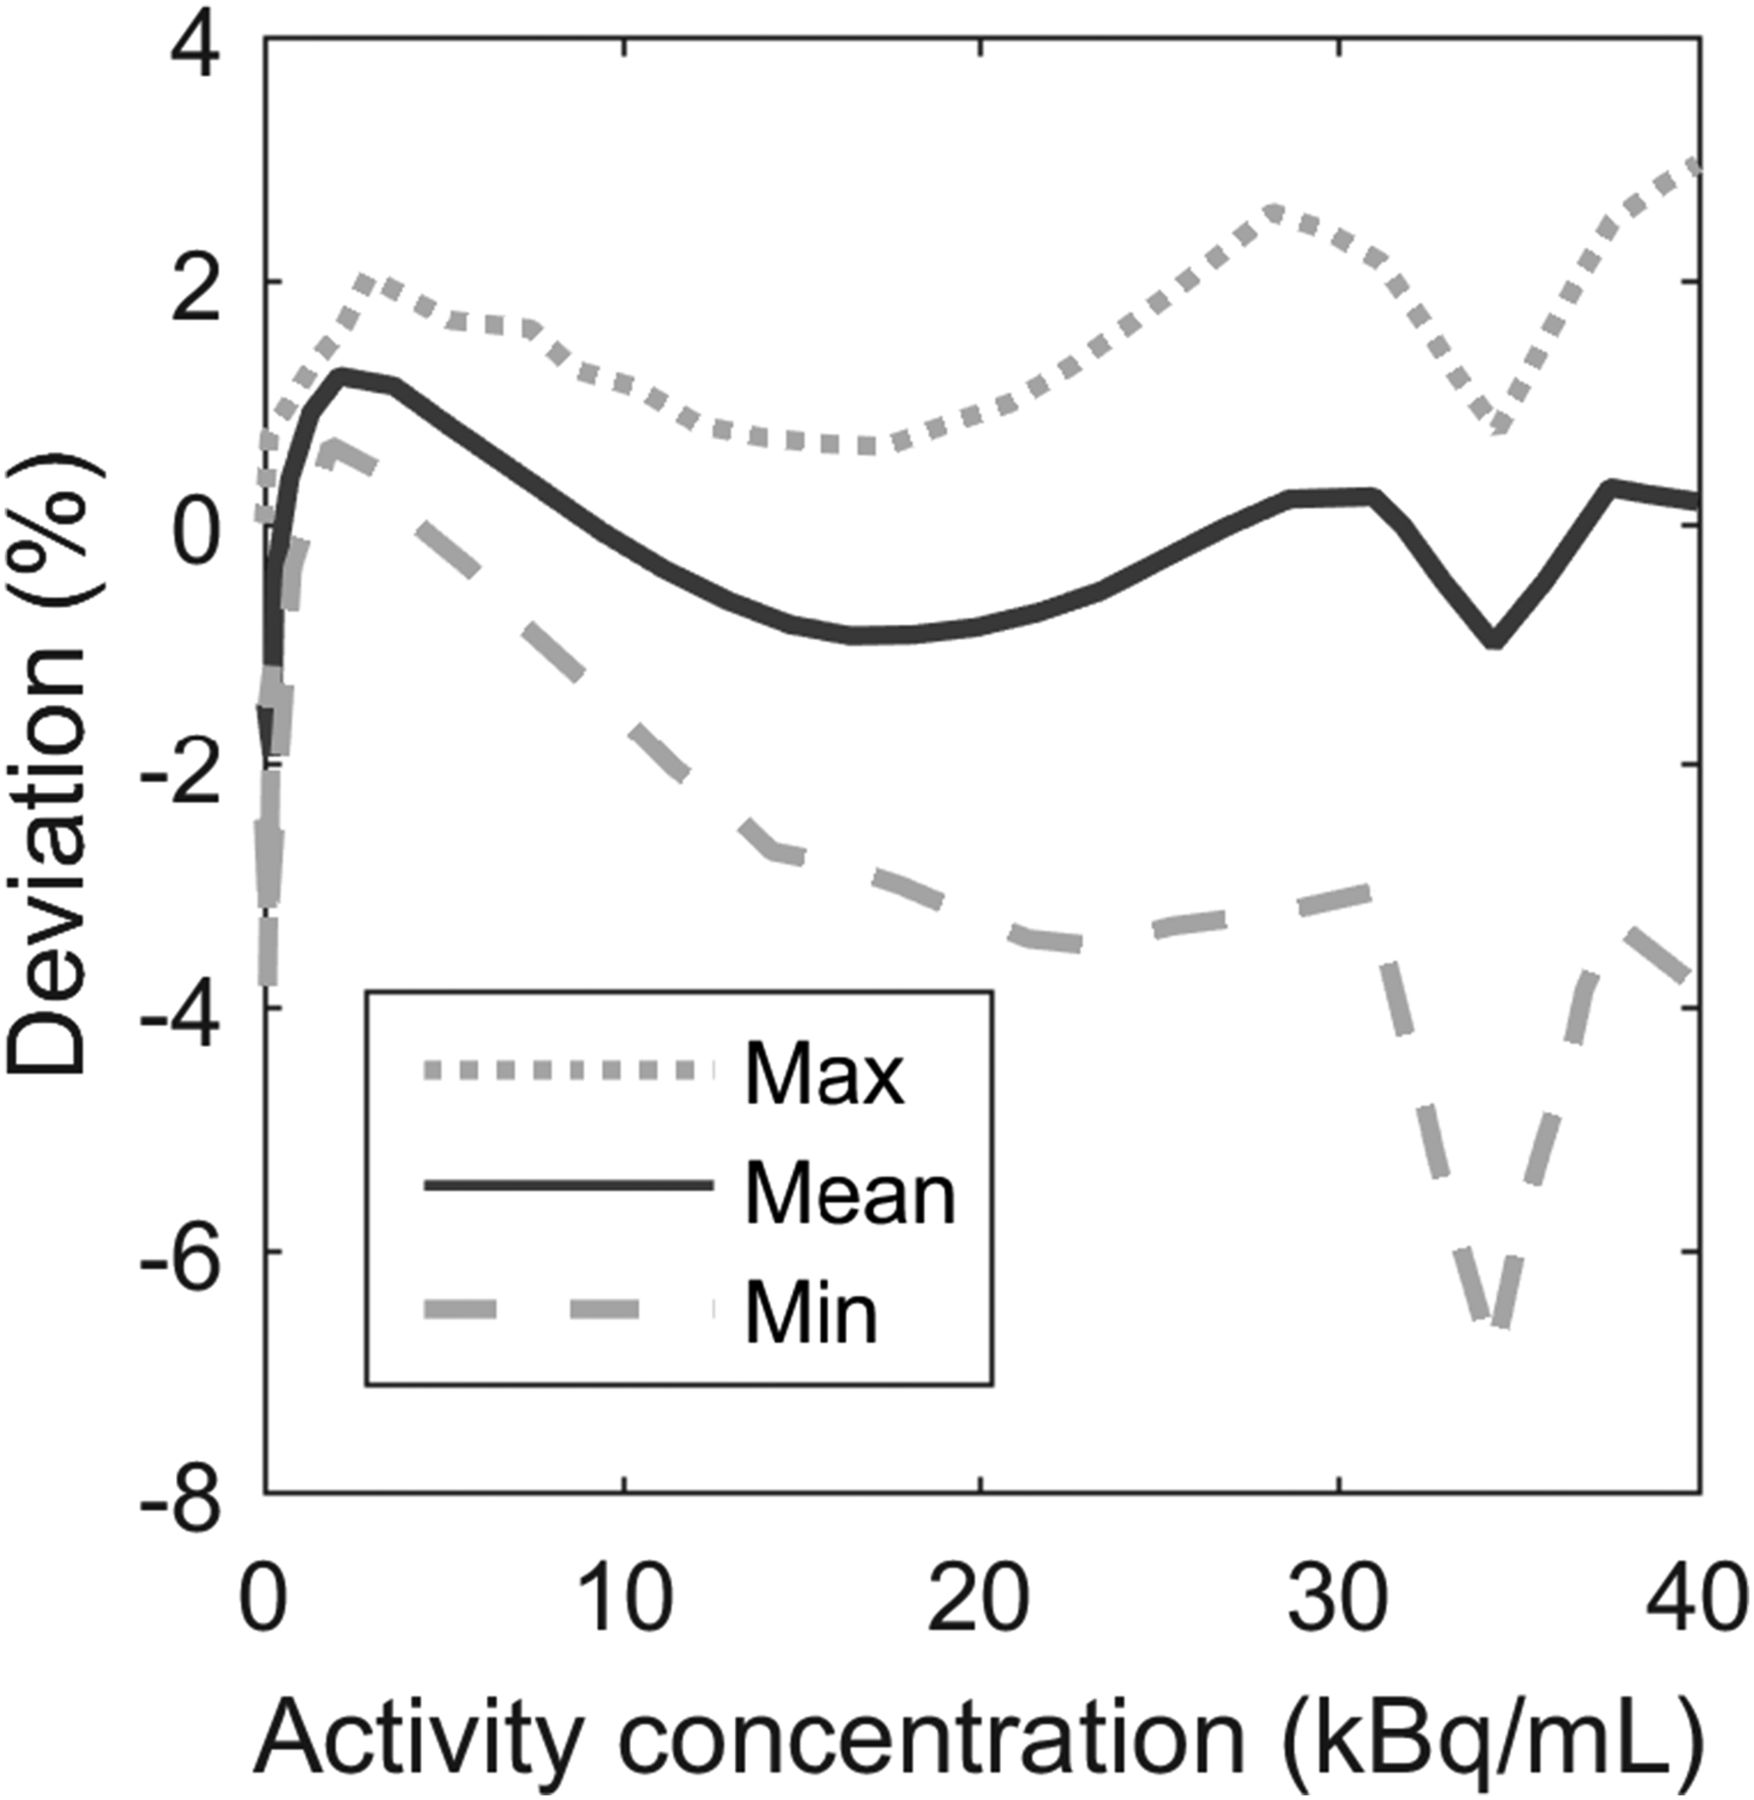
Maximum, mean, and minimum error as function of activity concentration.
Figure 4 shows the images obtained for the NEMA image quality phantom. Images reconstructed with Q.Clear had less background variability, especially as the LBR decreased. Tables 2, 3, and 4 present NEMA image quality data at LBRs of 2:1, 4:1, and 8:1, respectively, for the VPHD, VPHD-S, and Q.Clear reconstructions. The results are presented as the mean and SD of the 3 measurements requested by the NEMA standard. Q.Clear had a higher contrast recovery and lower background variability. Although, for this reconstruction, the smallest sphere (10 mm) for the 2:1 and 4:1 LBRs had the lowest contrast recovery factor, this fact was compensated for by a lower background variability, which resulted in an increased signal-to-noise ratio, as seen in Figure 4. Additionally, decreasing the β in Q.Clear or increasing the effective number of iterations in VPHD and VPHD-S and reducing the gaussian filtering increased the hot contrast recovery of the smaller spheres (10–17 mm) at the expense of an increase in background variability (Supplemental Tables 1–3). For the lung residual error for scatter attenuation corrections, Q.Clear had lower values for all LBRs studied. Also, with Q.Clear, when the product of acquisition time and activity concentration in the phantom was adjusted to meet the clinical situation (60 s for a 5.5 kBq/cm3 concentration), the contrast recovery coefficients were about the same for a given sphere diameter and LBR (Table 5). In contrast, background variability increased for the short acquisition (from a mean of 2.7% to 5.1%, considering all spheres and LBR), with a more noticeable difference among spheres and LBRs.
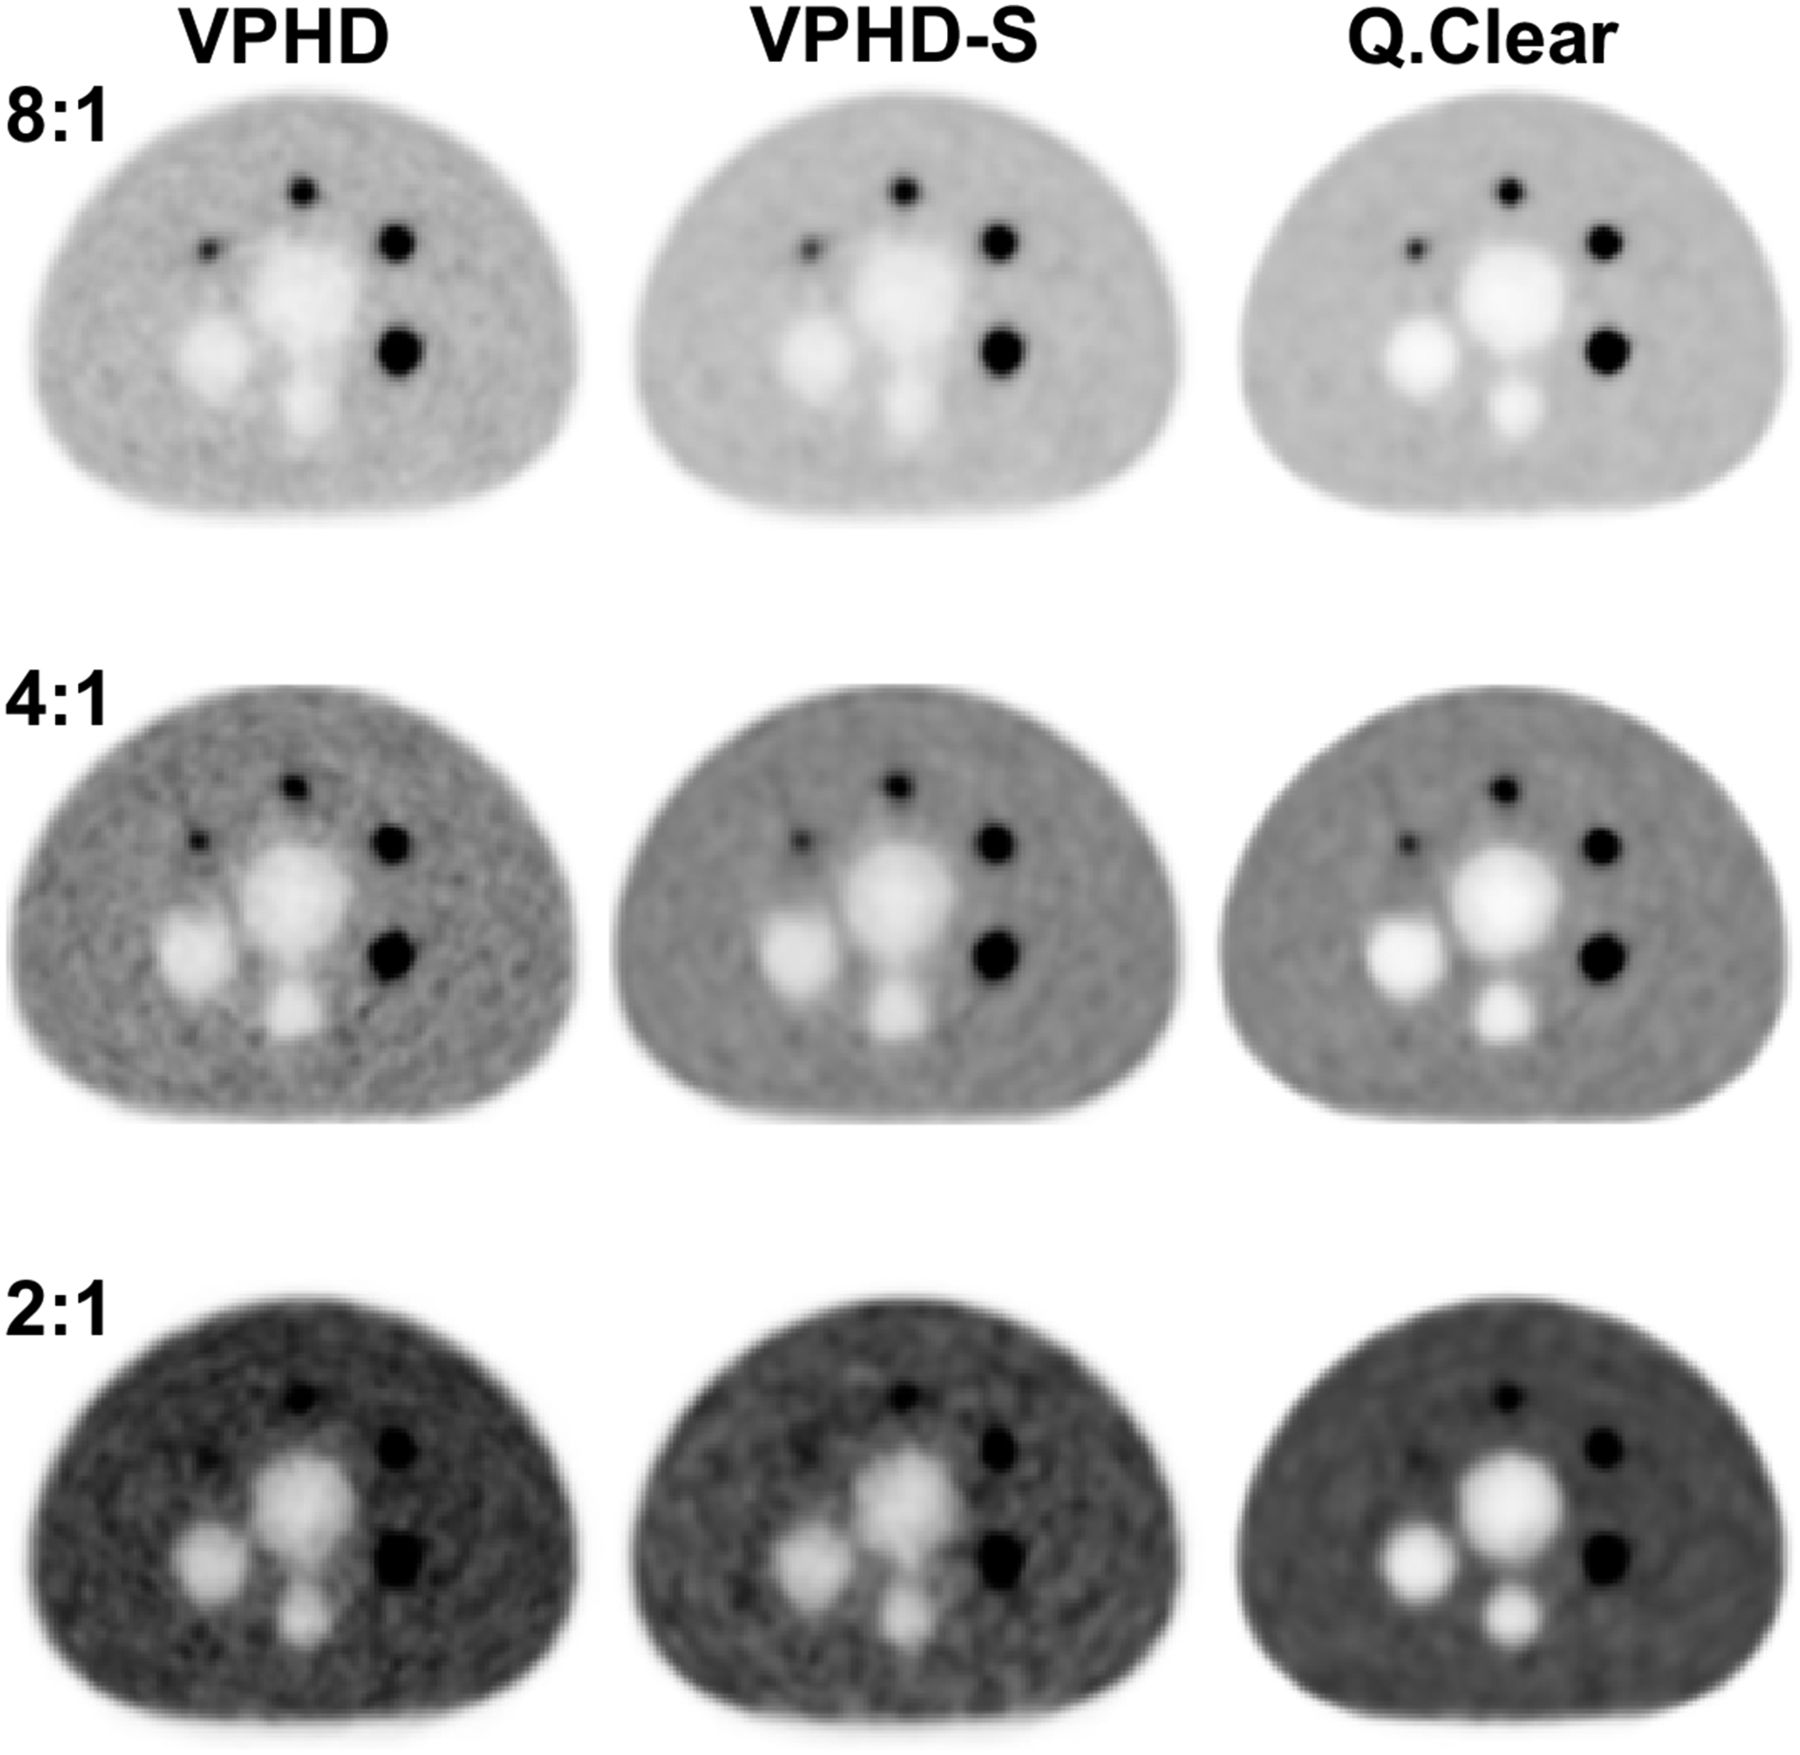
Image quality test for LBRs of 8:1, 4:1, and 2:1 and reconstruction using VPHD, VPHD-S, and Q.Clear for central slice from NEMA International Electrotechnical Commission body phantom.
Image Quality Using NEMA NU2-2012 for Different Reconstruction Algorithms and LBR of 2:1
Image Quality Using NEMA NU2-2012 for Different Reconstruction Algorithms and LBR of 4:1
Image Quality Using NEMA NU2-2012 for Different Reconstruction Algorithms and LBR of 8:1
Image Quality of Q.Clear with 60-Second Acquisition Using NEMA NU2-2012 for LBRs of 8:1, 4:1, and 2:1
The results of the image quality tests with different reconstruction parameters are presented in the supplemental material. With Q.Clear, a decrease in β increased the contrast recovery coefficient and background variability in the same way that an increase in effective iterations does with VPHD and VPHD-S.
Measurements with the Jaszczak phantom (Supplemental Figs. 1 and 2) showed that incorporation of the point-spread function in reconstruction increased overall image quality, but Q.Clear better defined the 7.9-mm rods and provided the best image contrast for all the rod sets, reducing image noise.
Patient Studies
In the patient studies, overall image quality was comparable between VPHD-S and Q.Clear, but the latter had better contrast. When the images were viewed by an expert nuclear medicine physician, the only relevant differences in quality were for scans with small lesions (Fig. 5). Quantitative analysis of the volumes of interest showed that for VPHD-S and Q.Clear, the mean lesion volume was 7 ± 11 cm3 and 7 ± 13 cm3, respectively (P = 0.5), the SUVmean was 6.5 ± 3 and 7 ± 3, respectively (P < 0.01), and the SUVmax was 11 ± 4.8 and 12 ± 4, respectively (P < 0.01). Figure 6 presents individual tendencies and box plots for the 3 parameters. Two lesions had a lower SUV for Q.Clear than for VPHD-S. The mean variation between the two reconstruction methods was 13% ± 10% (maximum, 35%) for SUVmean and 9% ± 12% (maximum, 29%) for SUVmax. Mean noise in the liver volume of interest was 0.12 ± 0.03 for VPHD-S and 0.11 ± 0.05 for Q.Clear (P = 0.09). Supplemental Figure 3 shows the SUVmean for the liver volume of interest.
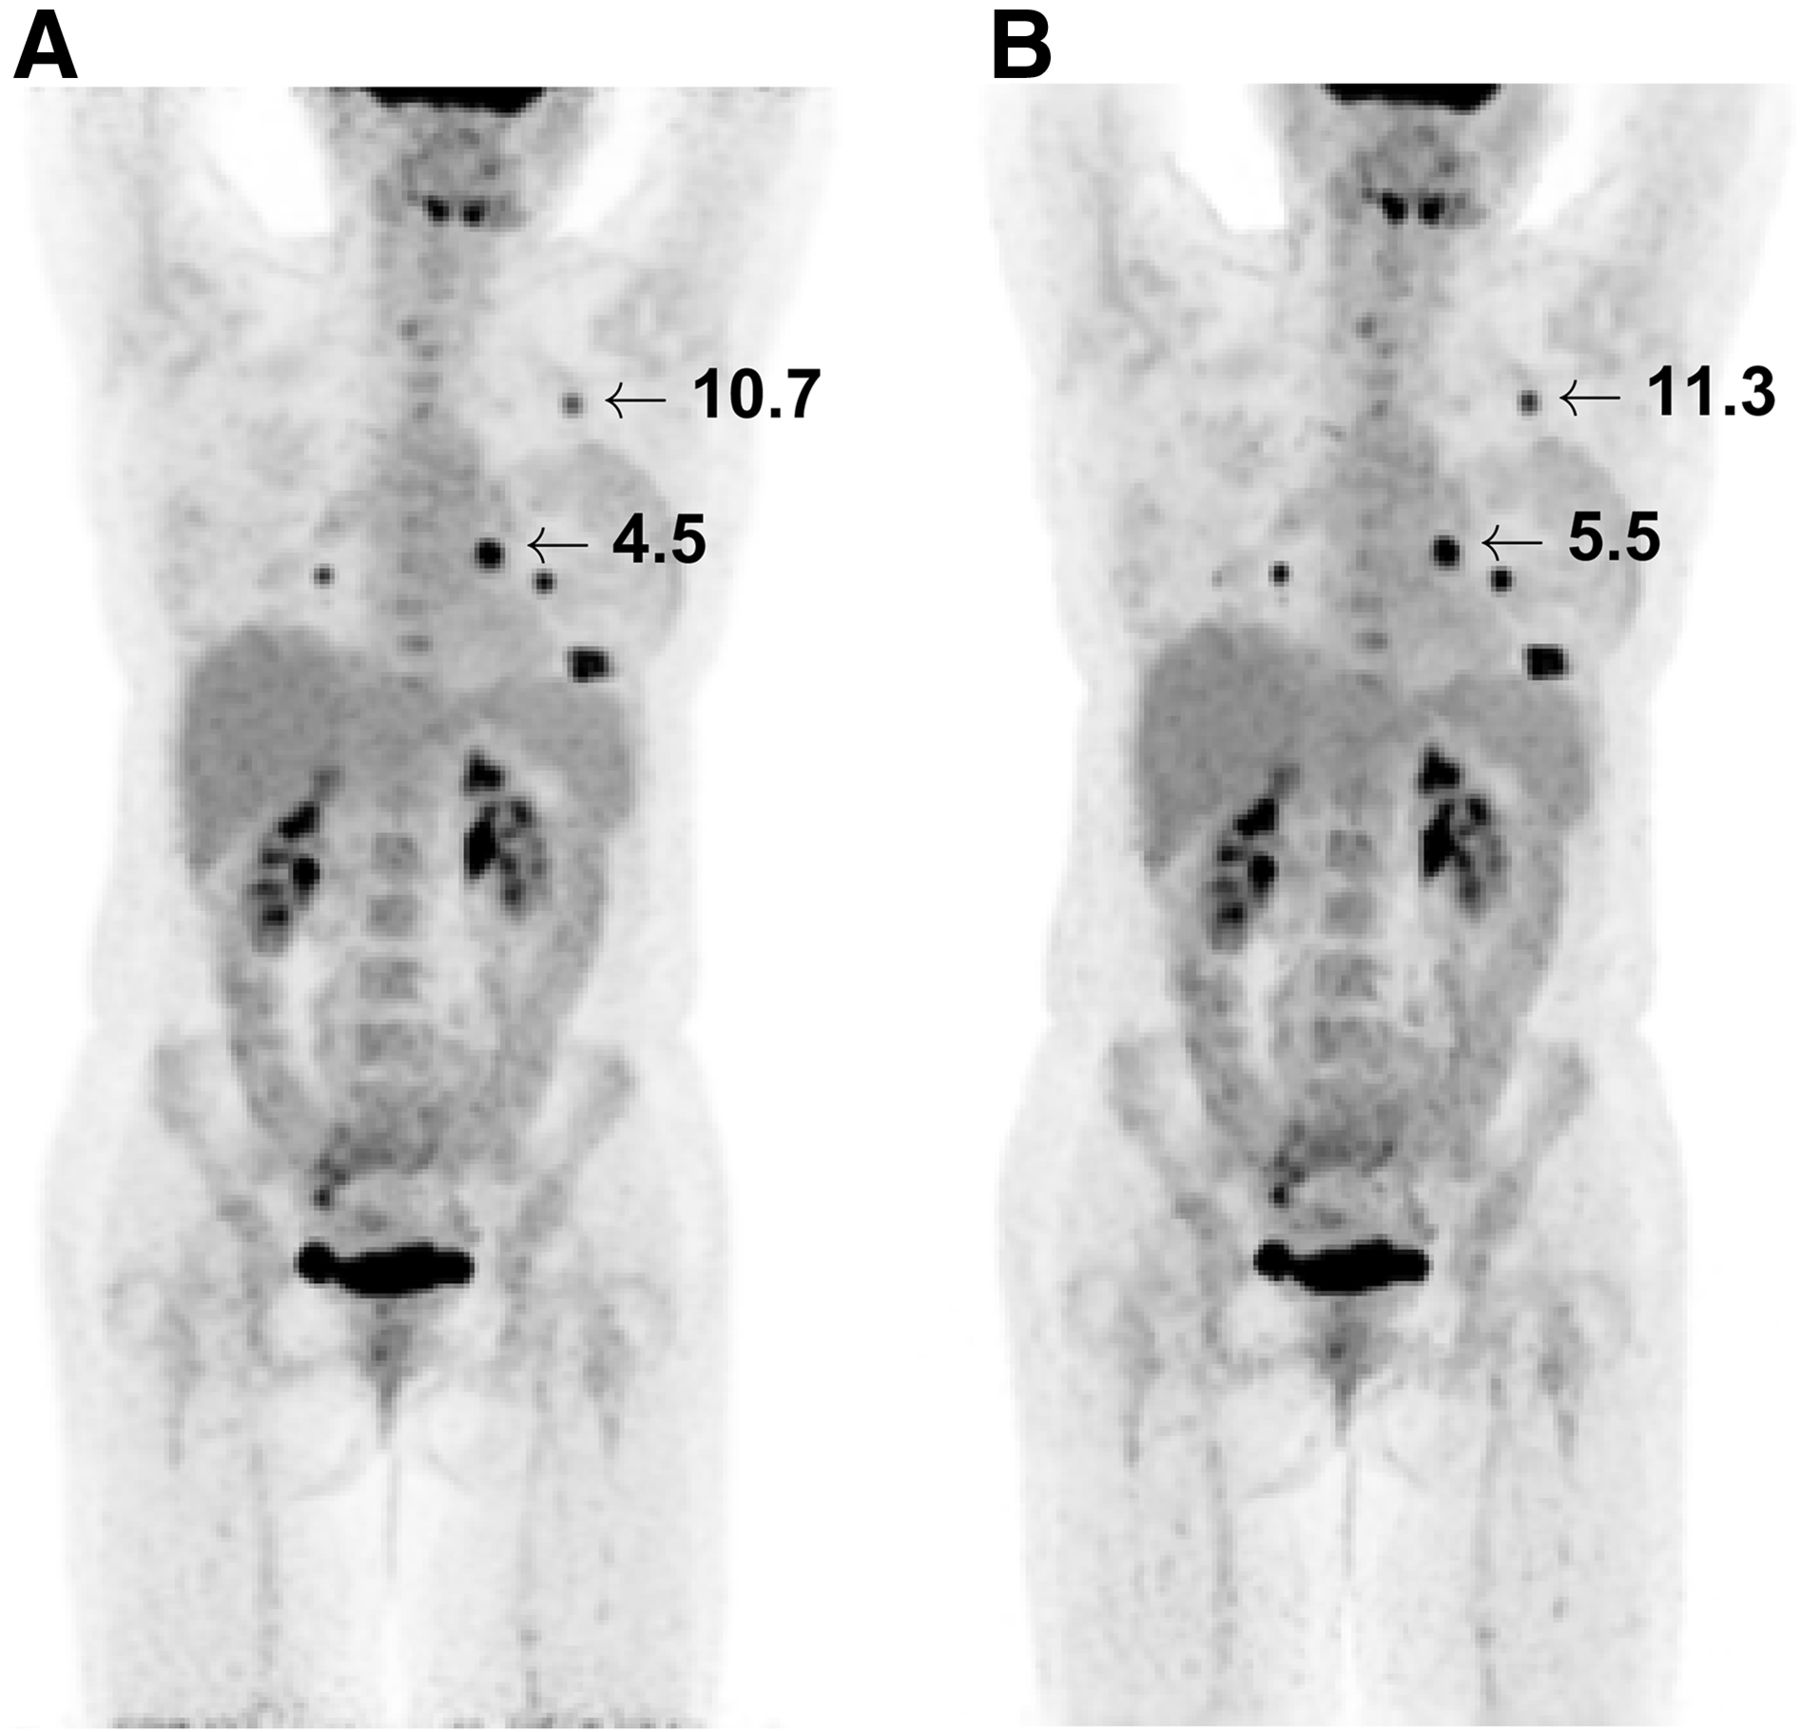
Maximum-intensity projection of patient scan reconstructed using VPHD-S (A) and Q.Clear (B). Numbers indicate SUVmax of analyzed lesions.

Quantitative analysis of lesions for VPHD-S and Q.Clear. Data are measured volume (A), SUVmean (B), and SUVmax (C).
DISCUSSION
The D-IQ is the latest generation of BGO PET/CT scanners developed by GE Healthcare, following the Discovery-LS (16), Discovery-ST (17,18), Discovery-STE (9) and Discovery-600 (D-600) (10) series. The D-IQ can be configured with 2- to 5-ring detector blocks and an axial FOV of 10.4–26.0 cm. The scanner includes Q.Clear, a Bayesian penalized likelihood reconstruction algorithm that also incorporates point-spread-function modeling. In the present study, we evaluated the performance of the D-IQ scanner in its 5-ring configuration. The main improvement over the previous-generation D-600 series is the LightBurst PET detector technology (10). Besides allowing scalability to different axial FOVs, this technology incorporates a dual-channel acquisition, 4 temperature sensors in each detector block, and improved shielding to reduce detection of scattered photons.
Spatial resolution was measured on images reconstructed with an iterative algorithm (VPHD), as the images of the point source were acquired and reconstructed with patient-dedicated software not allowing filtered backprojection reconstruction. Thus, comparison with published data on the performance of the D-600 series is difficult. Theoretically, as the crystal size in the transaxial direction is larger in the D-IQ, there should be poorer transverse spatial resolution but comparable axial resolution.
The sensitivity of the D-IQ-5 (21.6 cps/kBq) is twice that of the D-600 (9.6 cps/kBq). The smaller detector-ring diameter of the former should provide a small increase in sensitivity. Furthermore, the major contributor to the gain in D-IQ-5 sensitivity arises from the extended axial FOV (from 15.3 to 26 cm) due to the increased number of detector rings (from 3 to 5).
D-IQ scanners incorporate a dual-channel acquisition that improves the scatter and counting rate performance. The scatter fractions for the D-IQ-5 and the D-600 are similar (36.2% and 36.6%, respectively). Although both scanners have the same lower energy threshold (425 keV), two factors should contribute to a higher scatter fraction: the D-IQ-5 has a smaller ring diameter (74 vs. 80.1 cm) and a longer axial length. The D-IQ-5 also has additional end shielding and front shielding specially designed to reduce scatter outside the FOV, as well as a tungsten shield designed to reduce cross-crystal scatter. The true rate peak and noise-equivalent counting rate peak are 46% and 64% higher, respectively, for the D-IQ-5 than for the D-600 (335.4 cps at 33.2 kBq/mL and 75.2 kcps at 12.9 kBq/mL), at a slightly lower activity concentration. The maximum absolute error at activity below the noise-equivalent count peak was slightly worse for the D-IQ-5 than for the D-600 (2.9%). The peak in the sensitivity profile is produced by the axial coincidence acceptance, allowing coincidences among all detectors along the scanner axis, similar to the D-600, and changing from older scanners that do not allow a fully 3-dimensional acquisition. The overlap between bed acquisitions compensates for this profile variability.
The image quality results for this scanner cannot be compared in a straightforward way with those for other scanners, because of differences in image processing and acquisition time. The present study followed the guidelines suggested by the manufacturer and simulated more realistic conditions with a worse combination of acquisition time and phantom activity concentration. Under these conditions, sphere contrast recovery coefficients remained at about constant levels whereas background variability increased. The introduction of Q.Clear improves image quality noticeably, increasing contrast recovery coefficients and decreasing background variability, consistent with results from the Discovery 960 scanner based on lutetium-yttrium oxyorthosilicate crystals (6). The image quality results suggest the need to optimize the reconstruction parameters, particularly the β parameter in Q.Clear, for specific clinical applications—such as low-count PET acquisitions—that have short acquisitions or administer a low activity.
The patient images reconstructed with Q.Clear showed a higher contrast and less background variability. The same improvement was seen in images of the Jaszczak and NEMA image quality phantoms. In the first case, the improvement could be appreciated through better definition of rods up to 7.9 mm in diameter. No relevant difference in the noise measured in the liver was observed, although Q.Clear had a slightly lower value. For lesion quantification, Q.Clear increased the SUVmean and SUVmax of lesions. These changes in PET quantification introduced by the chosen algorithm and settings should especially be considered when standardization and harmonization are required, as is the case in multicenter studies (19). A major drawback of Q.Clear was the increase in reconstruction time.
This study had several limitations. We used an adaptation of the NEMA NU2-2012 method of testing scanner performance, as that method requires filtered backprojection, which is not implemented in the D-IQ-5 scanner. In addition, further studies are needed to evaluate the impact of Q.Clear on the Discovery BGO-based scanners, especially for the low-activity protocols in which high scanner sensitivity should be exploited.
CONCLUSION
The D-IQ PET/CT scanner with 5-ring detector blocks has the highest overall performance of the Discovery BGO-based scanners, with improved sensitivity and counting rate performance. Q.Clear reconstruction improves image quality, with higher recovery coefficients and lower background variability.
DISCLOSURE
Gabriel Reynes-Llompart receives research funding from General Electric Spain. No other potential conflict of interest relevant to this article was reported.
Footnotes
Published online Mar. 16, 2017.
- © 2017 by the Society of Nuclear Medicine and Molecular Imaging.
REFERENCES
- Received for publication October 14, 2016.
- Accepted for publication February 27, 2017.


