


Abstract
Imaging on a γ-camera with 90Y after selective internal radiotherapy (SIRT) may allow for verification of treatment delivery but suffers relatively poor spatial resolution and imprecise dosimetry calculation. 90Y PET/CT imaging is possible on 3-dimensional, time-of-flight machines; however, images are usually poor because of low count statistics and noise. A new PET reconstruction software using a Bayesian penalized likelihood (BPL) reconstruction algorithm (termed Q.Clear) was investigated using phantom and patient scans to optimize the reconstruction for post-SIRT imaging and clarify whether BPL leads to an improvement in clinical image quality using 90Y. Methods: Phantom studies over an activity range of 0.5–4.2 GBq were performed to assess the contrast recovery, background variability, and contrast-to-noise ratio for a range of BPL and ordered-subset expectation maximization (OSEM) reconstructions on a PET/CT scanner. Patient images after SIRT were reconstructed using the same parameters and were scored and ranked on the basis of image quality, as assessed by visual evaluation, with the corresponding SPECT/CT Bremsstrahlung images by 2 experienced radiologists. Results: Contrast-to-noise ratio was significantly better in BPL reconstructions when compared with OSEM in phantom studies. The patient-derived BPL and matching Bremsstrahlung images scored higher than OSEM reconstructions when scored by radiologists. BPL with a β value of 4,000 was ranked the highest of all images. Deadtime was apparent in the system above a total phantom activity of 3.3 GBq. Conclusion: BPL with a β value of 4,000 is the optimal image reconstruction in PET/CT for confident radiologic reading when compared with other reconstruction parameters for 90Y imaging after SIRT imaging. Activity in the field of view should be below 3.3 GBq at the time of PET imaging to avoid deadtime losses for this scanner.
After selective internal radiotherapy (SIRT) for the treatment of liver malignancies using 90Y, imaging is performed to verify treatment delivery and detect any significant extrahepatic activity (1). This may be achieved through hybrid Bremsstrahlung SPECT/CT imaging with a γ-camera, from the high-energy β-emissions, or PET/CT imaging, through 90Y positrons that are emitted after internal pair production (2).
Bremsstrahlung photons are produced when high-energy electrons are decelerated by other charged particles and may be exploited for reassurance of 90Y treatment delivery with a γ-camera; however, Bremsstrahlung image resolution can be of poor quality (3,4). Conversely, PET/CT imaging offers increased resolution; however, the 90Y positrons have a low branching ratio of 3.2 × 10⁻⁵ (5) and some Bremsstrahlung photons from the high-energy betas are also within the detectable range of the PET scanner (6). This gives rise to low-count, noisy images.
Although Bremsstrahlung SPECT/CT verifies treatment delivery after 90Y SIRT, due to the poor resolution plus inconsistent scatter and attenuation between patients, dosimetry calculations can lack precision at a time when there is an increasing desire for individual dosimetry (7–10), which is highlighted in the recent Basic Safety Standards (11). Recent trials such as QUEST (12), a multicenter SIRT dosimetry study, have used 90Y PET/CT, but these images remain noisy. A recent study performed on a lutetium orthosilicate–based Biograph system (Siemens) showed improved 90Y image quality when point spread function (PSF) modeling and time of flight were applied to image reconstructions (13). There is the potential for further improved image quality with the release of a PET reconstruction algorithm that uses a Bayesian penalized likelihood (BPL) reconstruction (termed Q.Clear by the manufacturer), described in a GE Healthcare white paper (14). This algorithm, which includes PSF modeling, controls the noise through the use of a penalty term. The relative difference penalty is a function of the difference between neighboring voxels and a function of their sum (15). This penalty function acts as a noise suppression term and is controlled by a penalization factor (termed β), which is the only user-input variable to the algorithm (14,15). Modified block sequential regularized expectation maximization is used as an optimizer, which, because of the penalty function, allows an effective convergence to be achieved in images (15,16). The β value has been optimized for whole-body 18F-FDG imaging at 400 (16) and shown to provide significant increase in the signal to noise for lung nodules (17), mediastinal nodes (18), and liver metastases (19).
The purpose of this work was to identify the optimal imaging parameters with BPL for a lutetium yttrium orthosilicate PET/CT system for patients after 90Y SIRT, using a wide range of activities, so as to mimic and encompass that administered to patients in a clinical environment (20,21).
MATERIALS AND METHODS
Phantom
Phantom images were used to identify the optimal β value range for BPL. A literature search found only 1 paper with optimized ordered-subset expectation maximization (OSEM) reconstruction parameters for post–90Y SIRT PET/CT imaging using the same Discovery scanner (GE Healthcare) type and crystal (22). This reconstruction was termed Kao.
Imaging was performed on a Discovery D710 PET/CT scanner (GE Healthcare), which is a lutetium yttrium orthosilicate–based system, using the National Electrical Manufacturers Association (NEMA) NU-2 image quality (IQ) phantom (PTW). All 6 spheres (diameter, 37, 28, 22, 17, 13, and 10 mm) were filled with a starting activity concentration of 3,300 kBq/mL, with a phantom background concentration of 430 kBq/mL, giving an approximate 8:1 ratio, per the QUEST protocol (12). This gave a starting total phantom activity of 4.2 GBq of 90Y. Ten milligrams of diethylenetriaminepentaacetic acid were added to prevent the 90Y from adhering to the phantom walls.
Six overnight acquisitions of at least 12 h were obtained with starting phantom activities (sphere activity concentrations) of 4.2 (3,200 kBq/mL), 3.3 (2,500 kBq/mL), 2.7 (2,100 kBq/mL), 2.0 (1,500 kBq/mL), 0.9 (700 kBq/mL), and 0.5 GBq (400 kBq/mL), using 1 bed position and with the spheres centered in the image, to allow for rebinning of the data for statistical analysis into 15-min frames, matching clinical imaging acquisition windows.
The means of the first 5 concurrent 15-min frames from the overnight scans were analyzed over the range of different reconstruction settings shown in Table 1. The percentage contrast recovery (CR) and background variability (BV) were calculated as defined in the NEMA standard (23) using Hermes Hybrid Viewer (version 2.5; Hermes Medical Solutions AB) to export mean sphere activity concentrations. The contrast-to-noise ratio (CNR) was defined as CR/BV. All errors were calculated as 1 SD of the 5 × 15-min frames for the reconstruction.
Reconstruction Parameters Analyzed for Phantom and Patient Reconstruction
The QUEST Phantom Study reconstruction (12) (parameters shown in Table 1) is optimized for dosimetry calculations rather than imaging but was included for comparison. A range of phantom OSEM reconstructions was performed over the parameters shown in Table 1. The iterations were plotted against CR, with the best performing for the lowest iterations and subsets chosen to reduce noise. From all the OSEM parameters tested, the best performing in terms of CR, BV, and CNR were used to reconstruct patient images, which were scored by 2 radiologists. The highest clinician scoring OSEM reconstruction at our center (termed OSEM.PSF) was then also used for comparison to BPL and the Kao reconstruction (22) and is included in Table 1. The β value for BPL was varied over 100–10,000. The optimal β range was estimated from the best-performing phantom images, those with high CR and low BV, leading to the best CNR.
Because of the small sample size (n = 5 × 15-min frames), nonparametric analysis was performed using SPSS (version 22; SPSS Software). The Friedman 2-way ANOVA by ranks was used for pairwise comparisons, with a confidence interval set to 95% and a significance level of 0.05. The Wilcoxon signed-rank test was used to compare the CR, BV, and CNR directly for the best performing BPL to the different reconstructions to a significance of 0.05.
The full data over the activity range 0.5–4.2GBq were rebinned into 15-min frames and the CR, BV, and CNR plotted against the activity concentration of the spheres to investigate deadtime effects using the optimal β value as determined from the phantom results and clinician scoring.
Clinical Evaluation
Informed consent is not necessary for retrospective image reviews of this nature at our institution. Ten consecutive patient studies, each with at least 1 measurable lesion of greater than 17 mm on the planning CT, were retrospectively selected. The cases were a mixture of treatments with SIR-Spheres (SIRTeX) (n = 6) and TheraSpheres (BTG) (n = 4), with an administered activity range of 1.0–3.4 GBq. SIRT is primarily used to treat metastatic colorectal cancers at our institution, with the decision to use TheraSpheres or Sir-Spheres made in collaboration between radiation oncology and interventional radiology based on tumor type, vascularity, and total proposed treatment volume. When the dose calculation tools provided by the respective manufacturers are used, administered doses for TheraSpheres are generally higher than Sir-Spheres. Imaging took place approximately 18 h after administration, with Bremsstrahlung SPECT/CT imaging immediately after PET/CT.
Patients were scanned with the same protocol in 3-dimensional mode using time of flight, with 2 bed positions to encompass the liver and a 23% bed overlap. The CT was obtained using a pitch of 0.984, 120 kV, automA, and a noise index of 25.
Patient images were then reconstructed using a range of the optimal BPL parameters, as determined by phantom imaging. The same images were also reconstructed using the parameters in Table 1 termed Kao and OSEM.PSF. All images were anonymized, randomized, and assigned an identifier for each reconstruction (A–K). These were visually scored, patient by patient, in a single session by 2 experienced consultant radiologists, separately. Scoring was with a radiologist-defined scale of poor, 1; noisy, 2; satisfactory, 3; and good, 4, further described in Table 2. The corresponding CT images were available for fusion. The top 4 scoring images were ranked in order of preference. The corresponding Bremsstrahlung images were also scored according to the same criteria above and ranked at the same time. For the few reconstructions for which there was a minor disparity in scoring, combined review achieved consensus.
Radiologist-Defined Scoring Scale for Patient Images with Descriptor
RESULTS
Phantom
OSEM Reconstruction
The CR plot against BV for OSEM reconstructions with 2, 3, and 4 iterations and 12 subsets is shown in Supplemental Figure 1 (supplemental materials are available at http://jnm.snmjournals.org). A small subset of reconstructions was scored by the radiologists; however, these performed poorly. The best scoring OSEM reconstruction is labeled OSEM.PSF in Table 1 and was used for comparison.
BPL Reconstruction
Images of the central transverse slice for the different reconstructions with different total phantom activity are displayed in Figure 1 for total phantom activities of 2.7 GBq (2,100 kBq/mL sphere concentration) and 0.9 GBq (700 kBq/mL sphere concentration). These activities were chosen to approximate the higher and lower patient activities at the time of imaging and to avoid deadtime effects and excessive noise, demonstrated in Figures 2, 3, and 4. For BPL reconstructions, the images appear smoother as the β value increases, because of the noise-suppressing term in the reconstruction algorithm.

Central transverse slices of NEMA IQ phantom for QUEST, Kao, OSEM.PSF, and BPL (β = 400, 1,000, 2,000, 4,000, 5,000, 7,000, 10,000) reconstructions for total phantom activity of 2.7 GBq (2,100 kBq/mL sphere concentration) (A and C) and 0.9 GBq (700 kBq/mL sphere concentration) (B and D).
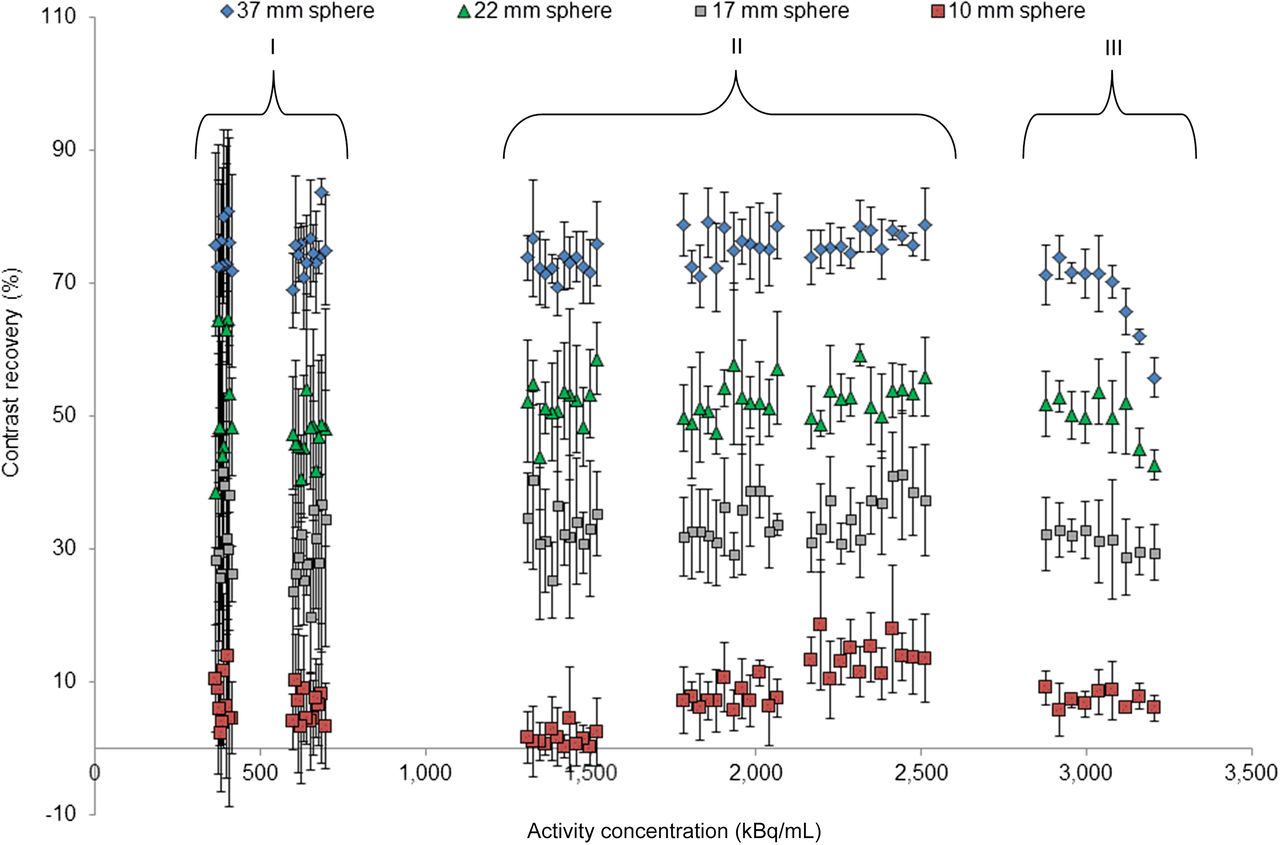
Mean CR vs. sphere activity concentration for 37-, 22-, 17-, and 10-mm-diameter spheres in NEMA IQ phantom for B4000. Error bars are ± SD.

Mean background variability vs. sphere activity concentration for 37-, 22-, 17-, and 10-mm-diameter spheres in NEMA IQ phantom for B4000. Error bars are ± SD.
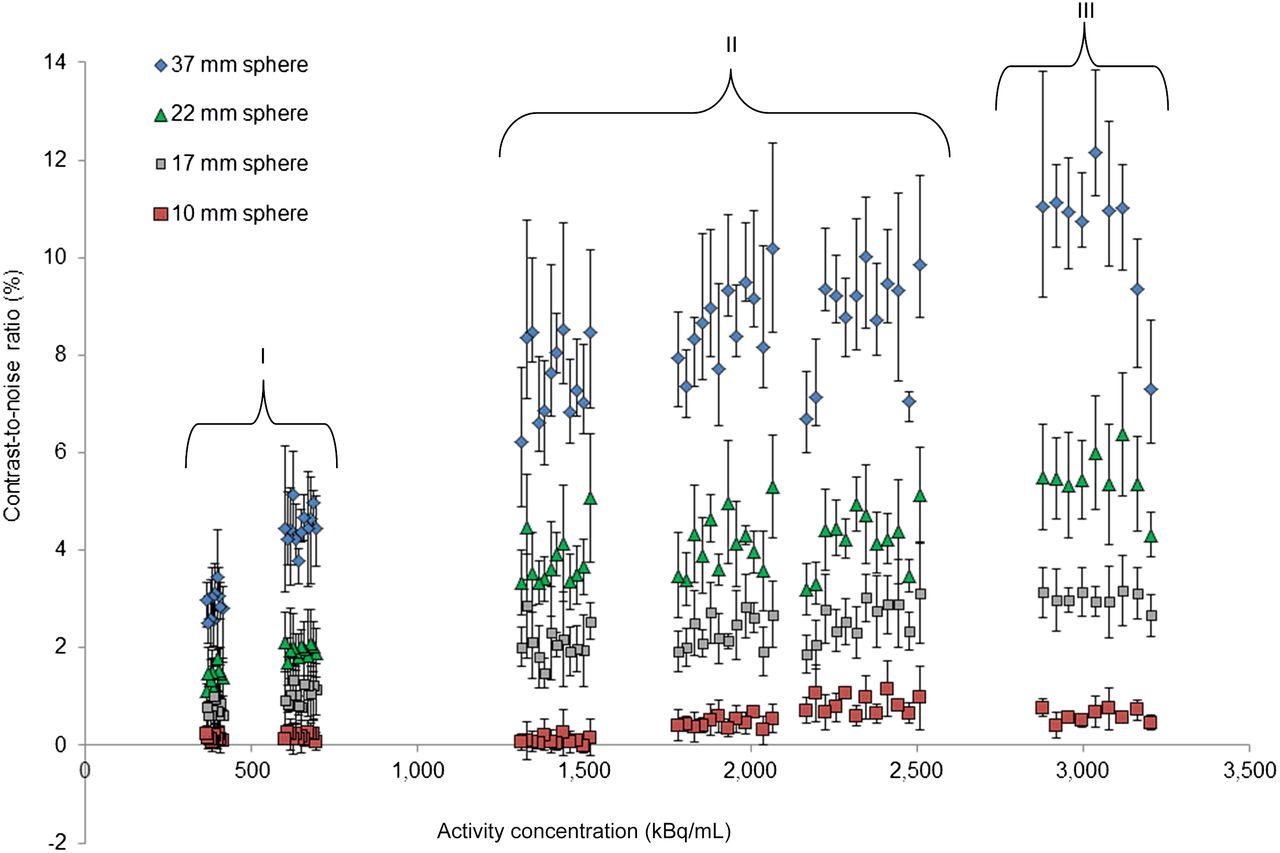
Mean CNR vs. sphere activity concentration for 37-, 22-, 17-, and 10-mm-diameter spheres in NEMA IQ phantom for B4000. Error bars are ± SD.
Figure 5 shows plots of the CR versus BV for the 37-, 22-, and 17-mm-diameter spheres for a range of BPL reconstructions with β values from 100 to 10,000 and the QUEST, Kao, and OSEM.PSF reconstructions. These are shown for total phantom activities of 2.7 GBq (2,100 kBq/mL sphere concentration) and 0.9 GBq (700 kBq/mL sphere concentration). The corresponding figure for the sphere diameters 28, 13, and 10 mm is shown in Supplemental Figure 2. Supplemental Figure 3 shows plots of the CR, BV, and CNR against sphere diameter for different BPL, QUEST, Kao, and OSEM.PSF reconstructions, for the same phantom activities.
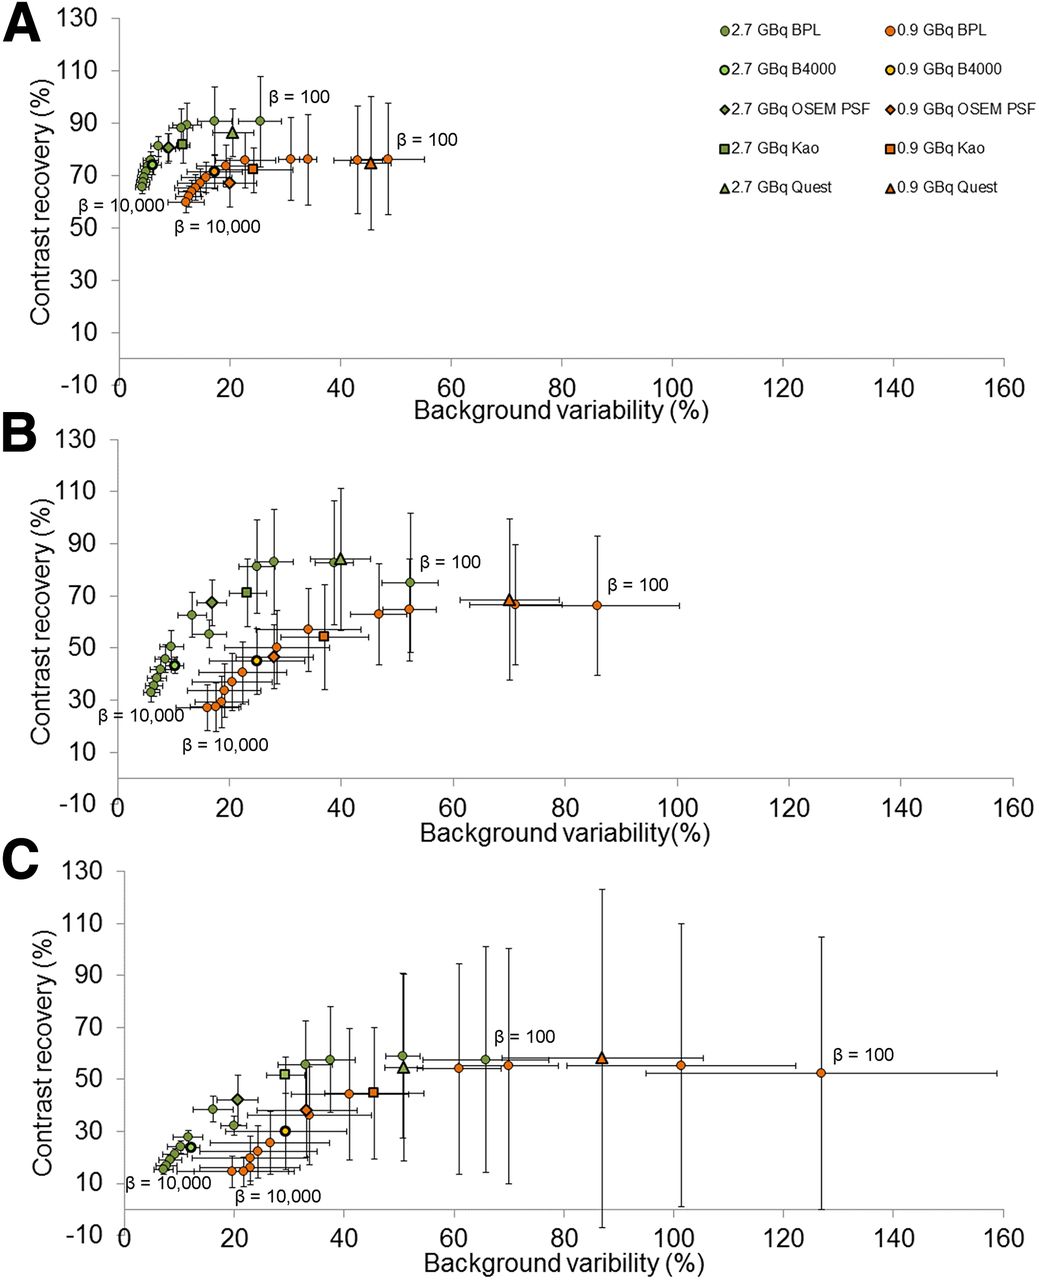
CR vs. BV for range of BPL (left to right β = 10,000, 5,000, 4,000, 3,000, 2,000, 1,000, 800, 400, and 100), OSEM.PSF, Kao, and QUEST reconstructions for 38-mm- (A), 22-mm- (B), and 17-mm- (C) diameter spheres of NEMA IQ phantom. Green points have total phantom activity of 2.7 GBq (2,100 kBq/mL sphere concentration) and orange 0.9 GBq (700 kBq/mL sphere concentration).
The results for the phantom study are presented in Supplemental Table 1. As the β value is increased for BPL reconstructions, the corresponding CR decreases as the effect of the noise suppression term increases. The BV, or noise, thus decreases with increased β. There is a general overall increase in CNR with increased β; however, the images become smooth in appearance and lose their detail as demonstrated in Figure 1. The overall performance is worse with decreased activity in the phantom, as shown by a drop in CR and CNR and an increase in BV, due to a decrease in overall counts within the images.
The Wilcoxon signed-rank test was used to compare the CR, BV, and CNR for different reconstructions to a significance of 0.05. For BPL, this comparison was focused on B4000, being the optimum shown for confident radiologic reading, and B1000, which gives higher CR values and as such could be of interest for dosimetry. Because of the large amount of noise and error associated with the smaller spheres, these were not used for comparison.
The CR was significantly different comparing OSEM.PSF and Kao with B4000, being higher for OSEM.PSF and Kao for the 3 largest spheres for 2.7 GBq (P < 0.04, z > 2.02 and P < 0.04, z > 2.023 for OSEM.PSF and Kao, respectively). There was no difference for the lower activity of 0.9 GBq in both cases (P > 0.05, z < 1.483 and P > 0.69, z < 1.48 for OSEM and Kao, respectively). The CR was significantly higher for QUEST and B1000 when comparing these reconstructions with B4000 for the 3 largest spheres at both activities (P = 0.043, z = 2.023). There was no significant difference in CR for the 3 largest spheres at both activities when comparing B1000 and QUEST (P > 0.5, z > 0.67).
The BV was significantly lower for B4000 than OSEM.PSF, Kao, B1000, and QUEST in all cases (except for OSEM.PSF for a 22-mm sphere at 0.9 GBq) for the 3 largest spheres and both activities (P < 0.043, z > 2.02). There was a significant difference between B1000 and QUEST when comparing the background variability, with B1000 being significantly lower for the 3 largest spheres (P = 0.043, z = 2.023). These results are summarized in Supplemental Table 2.
The CNR was higher for BPL reconstructions with a β value greater than 3,000 when compared with OSEM.PSF and Kao. This was significantly so for the largest sphere for both 2.7- and 0.9-GBq total phantom activities (P < 0.043, z > 2.02).
The percentage of measured/true activity concentration for B4000, B1000, QUEST, OSEM.PSF, and Kao reconstructions is shown in Table 3 for the largest 3 sphere sizes and for true activity concentrations of 2,100 and 700 kBq/mL, respectively. At a higher activity concentration, the OSEM.PSF reconstructions and B1000 perform better than B4000, whereas for a lower activity concentration they give similar values. The SD on measured activity concentration for B4000 is lower than the other reconstructions.
Percentage of True Activity Measured in Each Sphere for 5 Reconstructions
Linearity with Activity
The CR, BV, and CNR were plotted against activity concentration for the full range of phantom activities using different reconstructions, with the results of the BPL B4000 reconstruction for sphere diameters of 37, 22, 17, and 10 mm shown in Figures 2, 3, and 4, respectively. The corresponding graphs for the 28- and 13-mm-diameter spheres are shown in Supplemental Figures 4, 5, and 6 respectively. The impact of deadtime is visible above a phantom activity of 3.3 GBq (2,500 kBq/mL) in section III of these figures. All parameters remain fairly constant in section II (1,300–2,500 kBq/mL, 1.7–3.3 GBq). There is increased noise with decreased counts in section I (<700 kBq/mL, 0.9GBq), as expected, leading to large absolute error. The measured CR, and therefore CNR in some cases, drops below zero for the smaller spheres with lower activities, for which the counts measured for that sphere are essentially background.
When the Friedman 2-way ANOVA by ranks test (confidence interval of 95%, significance level of 0.05) was used, the results showed that for the 4 largest spheres (37, 28, 22, and 17 mm) there was no significant difference in CR over the activity range 0.5–3.3GBq, corresponding to sections I and II in Figure 2 (P > 0.692, P > 0.780, P > 0.499, and P > 0.260, respectively). For the same size spheres (37, 28, 22, and 17 mm), there was also no significant difference in the BV, or noise, for a smaller activity range (1.7–3.3GBq), corresponding to section II in Figure 3 (P > 0.247, P > 0.247, P > 0.549, and P > 0.549, respectively). The noise became significantly different (P < 0.021) when increasing the activity range to 0.8–3.3GBq.
The influence of a lower activity concentration is observed on the CR for the lower diameter spheres, which were heavily dominated by noise. This noise combined with partial-volume effects show that the phantom data results for CR and CNR became unreliable for sphere diameters less than 17 mm in diameter, as reported in other studies (3,12).
Clinician Scoring
Table 4 shows the consensus scores awarded to each patient reconstruction and the rank of the highest scoring images. In scoring, the radiologists had confidence in the Bremsstrahlung images because of familiarity and the lack of apparent spurious extrahepatic activity, or noise. All non-BPL and BPL PET images with lower β values were considered noisy. Images were ranked based on their sharpness and lack of spurious noise. BPL images with a higher β were pleasing and similar to Bremsstrahlung images, but real uptake in those images became blurred. The highest ranked reconstruction was BPL with a β value of 4,000. Uptake in the liver was best defined in these reconstructions, and the images were the sharpest PET reconstructions without implausible noise such as apparent small foci of activity in vertebrae or paraspinal muscles. Figure 6 shows a sagittal and transverse slice from a patient image for these 2 reconstructions and the Bremsstrahlung image obtained for the same patient for comparison.
Consensus Radiologist Scores of Different Reconstructions
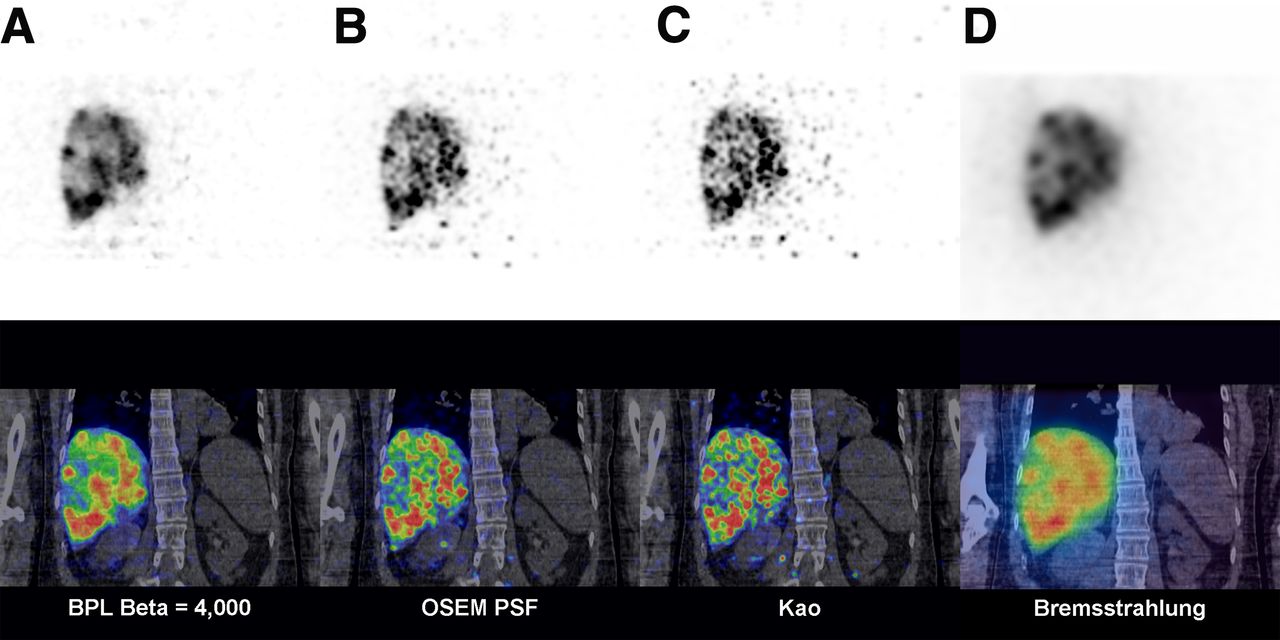
Coronal images from same patient (1.2 GBq administered Sir-Spheres activity). (A–C) Same slice from 90Y PET (top) and fused PET/CT (bottom) for BPL B4000, OSEM.PSF, and Kao reconstructions, respectively. (D) Bremsstrahlung SPECT/CT acquired immediately after PET/CT. Small foci of spurious noise are randomly distributed in OSEM images (B and C) but not BPL B4000 image (A), which demonstrates regions of poor uptake within partially necrotic hepatic metastases that are relatively poorly shown on Bremsstrahlung images.
DISCUSSION
The aim of this study was to determine the optimal BPL PET reconstruction parameters for 90Y after SIRT on lutetium yttrium orthosilicate scanners to ensure clinician confidence in reporting PET over Bremsstrahlung imaging for SIRT, with a view to using PET for dosimetry, in keeping with the new Basic Safety Standards (11). The methodology used in this study could be used to harmonize image quality parameters for post-SIRT PET/CT imaging, in particular for multicenter trials. When compared with OSEM reconstructions, BPL generally performed better for phantom images in terms of BV and CNR for β values between 1,000 and 5,000. Although CR was higher in OSEM phantom reconstructions, the spurious noise present in the OSEM patient images was such that these images were regarded as nondiagnostic or of poor quality in 9 of 10 studies, and the radiologists were not confident in reporting these images over the Bremsstrahlung images. As such, all OSEM images were scored poorly. In terms of clinician confidence, the higher β values scored well as the images became correspondingly smoother and less noisy. However, the clinicians considered that detail within the images began to be lost and started appearing oversmoothed above B4000. As such, whereas the CNR was higher in phantom studies for higher betas, B4000 was ranked first. The BPL reconstructions above B4000 were also ranked above Bremsstrahlung images, showing detail not present in the latter, despite the increased smoothing. For confident radiologic reading, reconstruction parameters different from those for activity quantification may be required. For activity quantification for which a high CR may be required for more accurate activity measurement, B1000 reconstructions may be preferred (Table 3). However, more work is needed to validate the use of B1000 for dosimetry, in particular the quantification of radiation dose as compared with other reconstructions.
Overnight phantom data showed the effects of deadtime above activity concentrations of 2,500 kBq/mL (total phantom activity of 3.3 GBq, section III in Figs. 2–4). This is in agreement with a study performed by Kao on a Discovery 690 scanner (GE Healthcare) (22). The highest patient administered activity was 3.4 GBq, corresponding to approximately 3.1 GBq at the time of imaging. Higher activities may be prescribed for patients having TheraSpheres; therefore, imaging should be delayed until the activity has decayed sufficiently to avoid the deadtime effects on these systems. There was also a general trend toward improved radiologist total score across reconstructions for a higher administered patient activity, presumably because of better counting statistics within the images. Noise in the images was fairly consistent over the activity range 0.8–3.3 GBq but began to increase notably below 0.8 GBq, with the 0.5-GBq dataset heavily dominated by noise. The phantom data also showed that results for CR, BV, and CNR became unreliable from sphere diameters of 17 mm and below, as noted in previous studies (3,12), due to partial-volume effects.
CONCLUSION
BPL offers optimal 90Y SIRT imaging based on quantitative phantom work and clinician scoring with improved image quality. BPL was optimized with a β of 4,000, providing a compromise between noise and CR, and was ranked highest by clinicians when compared with other β values, OSEM reconstructions, and Bremsstrahlung images. Future work will investigate the potential improvements of BPL applied to dosimetry calculations.
Deadtime effects were observed in lutetium yttrium orthosilicate PET/CT systems above 3.3 GBq. Patients should have a total liver activity below 3.3 GBq before imaging on the system.
DISCLOSURE
This work was supported by the Cancer Research U.K. Oxford Centre (C5255/A18085). No other potential conflict of interest relevant to this article was reported.
Acknowledgments
We thank Michael Tapner (Sirtex Technology Pty Ltd.) for providing the 90Y activity. We thank Steve Ross (GE Healthcare) for assisting with performing BPL reconstructions.
Footnotes
Published online Sep. 29, 2016.
- © 2017 by the Society of Nuclear Medicine and Molecular Imaging.
REFERENCES
- Received for publication June 16, 2016.
- Accepted for publication September 8, 2016.


Jump to section
Related Articles
Cited By...
- No citing articles found.