


Abstract
Image-derived input functions (IDIF) are frequently used in cardiac 18F-FDG PET studies for determination of the myocardial metabolic rate of glucose (MRGlu). The purpose of this study was to assess which vascular structure is most suited for defining the IDIF, using online arterial blood sampling (AS) as the gold standard. Methods: In 18 patients with ischemic heart disease, 370 MBq FDG were injected during a hyperinsulinemic euglycemic clamp. Studies were performed with a Siemens/CTI HR+ PET scanner using a dynamic scanning protocol. A fully automated blood-sampling device was used for continuous AS. IDIF were obtained using regions of interest (ROIs) of 3 different sizes defined on the left ventricle (LV), left atrium (LA), ascending aorta (AA), and descending aorta (DA). MRGlu was calculated with all input functions. Ratios between MRGlu obtained with IDIF and AS were calculated for each patient. Results: Time–activity curves from smaller ROIs suffered more from statistical noise with only a modest reduction of spillover effects, which led to more variation in calculated MRGlu. Mean ratios of MRGlu obtained with IDIF and AS were close to 1 when AA and DA (0.97 ± 0.07 and 1.00 ± 0.11, respectively) were used to define the input function. However, when LA and LV were used, mean ratios were 0.81 ± 0.06 and 0.79 ± 0.08, respectively, reflecting a significant underestimation of MRGlu. The use of AA for defining the input function resulted in the best agreement with AS and the smallest interobserver variation. Conclusion: The ascending aorta is the structure of choice for defining IDIF and a large ROI (diameter, approximately 15 mm) should be used to minimize the effects of statistical noise.
One clinically accepted and validated technique for the detection of myocardial viability is PET using 18F-FDG (1–6). Most clinical studies have used qualitative interpretation of FDG images to assess the presence of preserved glucose metabolism in hypoperfused segments. In this approach, static FDG PET imaging is sufficient. Determination of the myocardial metabolic rate of glucose (MRGlu) by dynamic FDG PET imaging offers more detailed information about myocardial metabolism. The use of quantitative FDG studies has been limited mainly by the large intersubject variation in measured MRGlu in both healthy and dysfunctional segments, prohibiting use of an accurate cutoff value of MRGlu for discriminating viable segments from nonviable segments (7–9). Quantification remains important, however, in studying pathophysiologic mechanisms.
Quantitative analysis requires an input function, for which online arterial blood sampling (AS) serves as the gold standard. Whenever possible, however, AS should be avoided because of rare potential complications associated with such an invasive procedure (10–12). In addition, frequent blood sampling contributes to the radiation burden of personnel. Alternative methods used for characterization of the input function are sampling of arterialized venous blood (13) and blood time–activity curves derived from PET images themselves, using regions of interest (ROIs) on vascular structures such as the left ventricle (LV) (14,15), left atrium (LA) (16), or aorta (17–19). Image-derived input functions (IDIF) are attractive because of their noninvasive nature and because the scanning protocol can be simplified. Several reports have supported the use of IDIF in clinical practice, provided that appropriate partial-volume and spillover corrections are applied (14,17). It should be noted that, since those reports, spatial resolution of PET scanners has improved substantially.
To date, no study has determined which vascular structure is best suited for defining ROIs in cardiac FDG PET studies. Recently, a study comparing the aortic arch, LV, and LA indicated that, in the majority of cases, the aortic arch was the best vascular structure for defining IDIF for oncologic applications (18). Although this finding was supported by independent quality control measures, no direct comparison with an externally measured arterial input function was provided. Moreover, patients were fasted for more than 6 h, significantly reducing potential spillover effects compared with cardiac studies.
This study was conducted to evaluate the accuracy of IDIF from the LV, LA, ascending aorta (AA), and descending aorta (DA) for the calculation of myocardial MRGlu (during a hyperinsulinemic, euglycemic clamp). As determined by online continuously withdrawn arterial blood, the arterial input function was used as the gold standard.
Materials and Methods
Patients
Eighteen consecutive patients with ischemic heart disease were included in this study (characteristics are summarized in Table 1). All patients had impaired left ventricular function caused by previous myocardial infarction and were referred for assessment of myocardial viability. They were allowed to continue their medication but intake of diuretics was delayed until after the study. Patients had a light breakfast more than 4 h before FDG injection. None of the patients had clinical signs of decompensated heart failure. Cannulas were inserted in both antecubital veins (18-gauge cannula) for tracer injection and the clamp procedure and in a radial artery (20-gauge cannula) for blood sampling. The study was approved by the medical ethics committee of the Vrije Universiteit (VU) Medical Center and informed consent was obtained from each patient.
Clinical Data of Patients
Clamping Procedure
All patients underwent a hyperinsulinemic euglycemic clamp, as described by DeFronzo et al. (20), to enhance myocardial FDG uptake and ensure a metabolic steady state. The clamp was started approximately 2 h before injection of FDG and continued until the end of the scanning protocol. One antecubital cannula was used for infusion of insulin (Human Velosulin, 100 U/mL; Novo Nordisk, Meppel, The Netherlands) and glucose (500 mL 20% glucose with 10 mL 14.9% KCl). The contralateral antecubital cannula was used to withdraw blood samples for monitoring blood glucose levels. A variable amount of international units of insulin (15 times the body surface area of the patient in m2) was added to 50 mL 0.65% NaCl. This solution was infused at a constant rate of 13 mL/h after an initial priming dose of 60 mL/h followed by 30 mL/h, both lasting for 4 min. Blood glucose levels were determined every 10 min using a GlucoTouch (Lifescan, Beerse, Belgium) apparatus. To maintain normoglycemia (4–6 mmol/L, 72–108 mg/dL), the glucose infusion rate was adjusted after each blood glucose measurement, if needed.
Preparation of FDG
FDG was synthesized by the BV Cyclotron VU (Amsterdam, The Netherlands) according to a modified method previously described by Hamacher et al. (21) using nuclear interface equipment. Radiochemical purity was >97%.
Scanning Protocol
All scans were performed in 2-dimensional mode, using an ECAT EXACT HR+ scanner (Siemens/CTI, Knoxville, TN). This scanner acquires 63 planes of data over an axial field of view of 15 cm.
Using rotating 68Ge line sources, a 10-min transmission scan was performed after a short transmission scan for patient positioning. Subsequently, 370 MBq FDG dissolved in 5 mL saline were injected intravenously (followed by a 47-mL saline flush at a rate of 2 mL/s). The dynamic scan consisted of 39 frames with variable frame length (6 × 5, 6 × 10, 3 × 20, 5 × 30, 5 × 60, 8 × 150, 6 × 300 s) for a total time of 60 min. Arterial 18F concentrations were monitored continuously using a fully automated blood-sampling device (Veenstra Instruments, Joure, The Netherlands) (22). Withdrawal rate was 5 mL/min during the first 10 min and 2.5 mL/min thereafter. At set times (5, 10, 20, 30, and 50 min after injection), continuous withdrawal was interrupted for collection of manual samples, after which the arterial line was flushed with heparinized saline. These samples were measured in a well counter, cross-calibrated against the PET scanner, and used for online calibration of the blood sampler and for determination of plasma–to–whole-blood 18F ratios. In addition, these samples were used for measurement of plasma glucose levels (hexokinase method, Hitachi 747; Boeringer Mannheim, Mannheim, Germany). All dynamic scan data were corrected for physical decay of 18F and for dead time, scatter, randoms, and photon attenuation. The images were reconstructed using filtered backprojection with a Hanning filter at the Nyquist frequency. This resulted in a transaxial spatial resolution of approximately 7-mm full width at half maximum.
Image Analysis
ROIs were defined on several planes over the LV, LA, AA, and DA on early transaxial images (25–50 s after injection of FDG).
To avoid spillover from the left atrium, only planes in which the LA was not visible were used for the AA and DA. The distal DA was not used because its decreasing size might have resulted in considerable partial-volume effects. ROIs over the LV were copied to the last frame to check for possible inclusion of the myocardial wall. For uniformity, all blood-pool ROIs had a circular shape and were placed at the center of each structure (although the LV is not circular in a transaxial slice, the use of noncircular ROIs did provide similar results). Time–activity curves were generated by projecting the ROIs onto the complete dynamic dataset. All time–activity curves of the individual blood-pool ROIs were compared with each other in each study. No attempt was made to select only input functions that were close to the arterial samples, because the purpose of this study was to evaluate the use of IDIF in lieu of AS. Therefore, only obvious outlying factors, such as a disproportionalrise of the tail of the curve, were rejected. The individual ROIs of each blood pool were grouped, creating a volume of interest. Then, to avoid bias by statistical noise, each volume of interest was automatically copied twice and the copies were placed directly adjacent to the original. To avoid a large shift from the center of the structure, ROIs were partly overlapping and the positioning of each volume of interest was verified. In this way, 3 individual volumes of interest were created, all identical with respect to plane selection. Their time–activity curves were averaged and the average curve was considered to represent the optimal IDIF of that particular blood pool.
To determine the effect of ROI size on partial-volume effects and statistical noise, this procedure was performed for 3 different ROI sizes (diameters, 5, 10, and 15 mm). First, volumes of interest were created with 15-mm ROIs. ROI size was then reduced to create volumes of interest with smaller ROIs, but at the very same position and identical with respect to plane selection. Thus, 12 IDIF were generated for each study (3 different ROI sizes for 4 vascular structures).
The last 3 frames were summed (45–60 min after injection) and resliced, resulting in a single-frame short-axis image, which was used to define the myocardial tissue ROIs. These ROIs were defined over several planes and were grouped to create a single, whole-myocardium ROI. This ROI was projected onto the complete dynamic resliced dataset, generating a whole-myocardium time–activity curve.
Input functions derived from the same blood pool might differ significantly, depending on how ROIs were defined. As a consequence, a variation in MRGlu might be observed. To evaluate possible interobserver variability in MRGlu, a second investigator defined ROIs over the LV, LA, AA, and DA independently, the only requirement being the use of ROIs 15 mm in diameter. Both investigators used the same tissue ROIs.
Data Analysis
To correct for delay, the peaks of all image-derived vascular time–activity curves in each patient were averaged and the difference in arrival time of the peak of this averaged curve and that of the sampler curve was used to shift the sampler curve.
Both the sampler and the image-derived vascular time–activity curves were transformed to plasma time–activity curves using the arterial plasma–to–whole-blood 18F ratios.
To determine MRGlu for the whole-myocardium ROI, both compartmental and Patlak graphical analyses (23) were used. For nonlinear regression, the standard 2-tissue compartment model (13), with and without setting k4 to zero, was used. In both fits, a spillover blood volume parameter was incorporated to account for intravascular activity. For model selection, both the Akaike information criterion (24) and the Schwarz criterion (25) were used. Based on these selection criteria, the best model was used for comparison of compartmental and Patlak analyses using the online blood sampler data as input function. The Patlak analysis was performed over the period from 10 to 60 min after injection.
The ratio of MRGlu obtained with the IDIF and MRGlu obtained with AS was calculated for all patients with the Patlak graphical analysis (23). Limits of agreement were assessed by means of the analysis described by Bland and Altman (26). This analysis was also used to assess the agreement of the kinetic analyses for determining MRGlu and to evaluate the interobserver variability introduced with IDIF.
Results
ROIs
Only a few planes were acceptable for definition of ROIs on the LV, because otherwise the distance to the myocardial wall would become too small. This resulted in smaller volumes of interest for a given ROI diameter compared with the other regions. Mean volumes (when 15-mm ROIs were used) were 2.05, 1.93, 1.29, and 1.84 cm3 for the AA, LA, LV, and DA, respectively.
Time–Activity Curves
The highest peak activity was observed in the LA, followed by the LV, AA, and DA, respectively. All image-derived time–activity curves showed an earlier and higher peak than that of the online blood-sampling device (Fig. 1). LA and DA time–activity curves from small ROIs showed a slightly higher peak than time–activity curves from larger ROIs (6% and 9%, respectively), whereas no significant differences were observed in LV and AA time–activity curves.
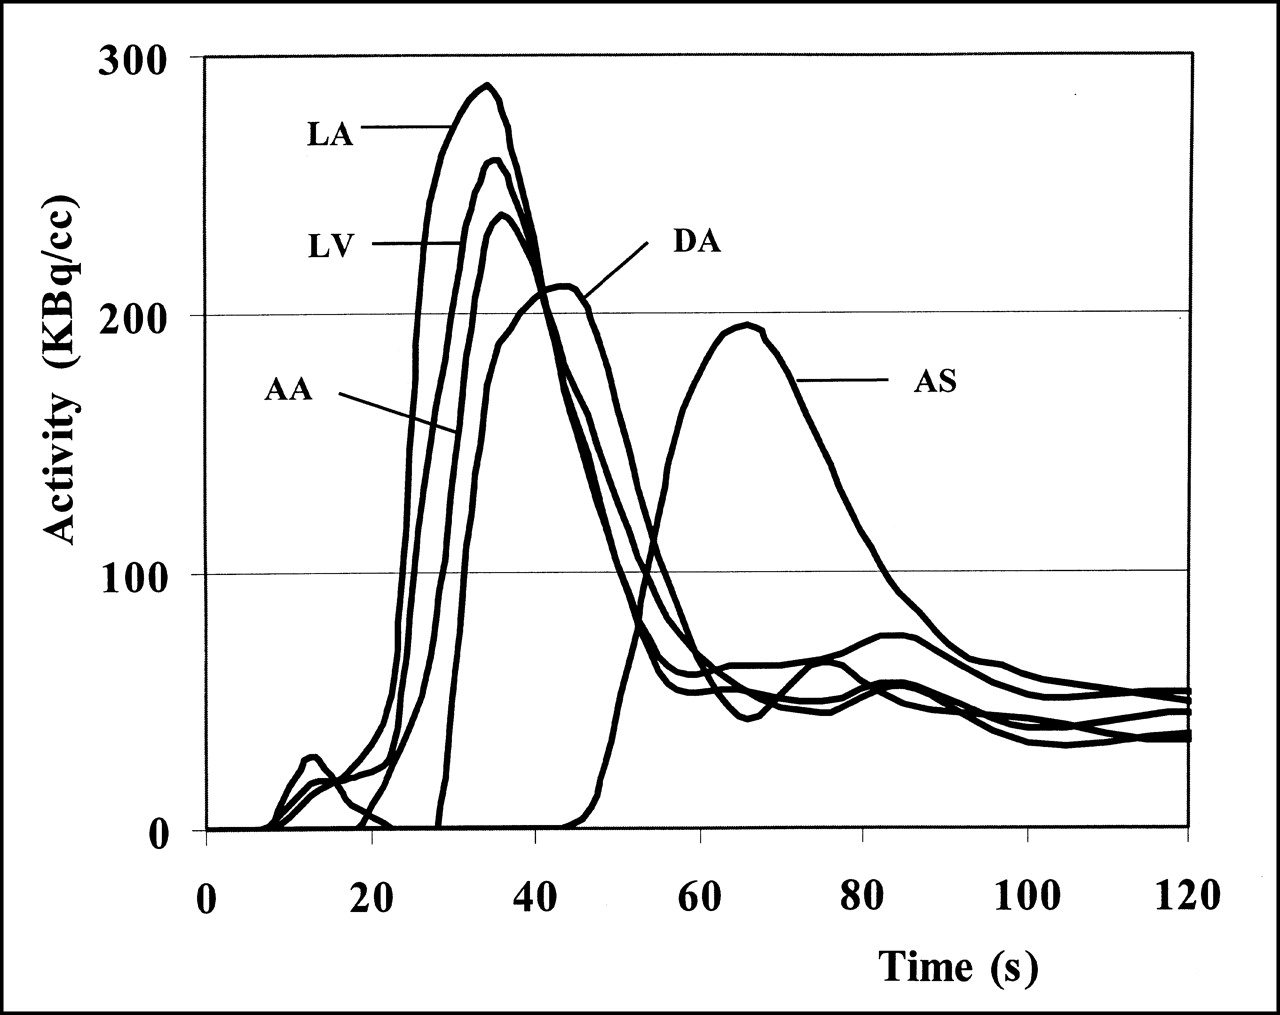
Example of relationship of peak activity of arterial plasma time–activity curve (AS) and all IDIF (AA, LA, LV, DA) from representative study. ROIs of 15-mm diameter were used.
At later time points, the time–activity curves from LV and LA often overestimated the FDG concentration, whereas AA and DA were close to the arterial sampler curve (Fig. 2). Time–activity curves from smaller ROIs clearly had higher noise levels than those from larger ROIs (Fig. 2). LV curves suffered most from statistical noise. When using the smallest LV ROI (5 mm), in 7 patients, at least 1 of the time–activity curves had to be rejected (Table 2). The decision to reject a curve was primarily based on a disproportional rise of the tail of the time–activity curve.
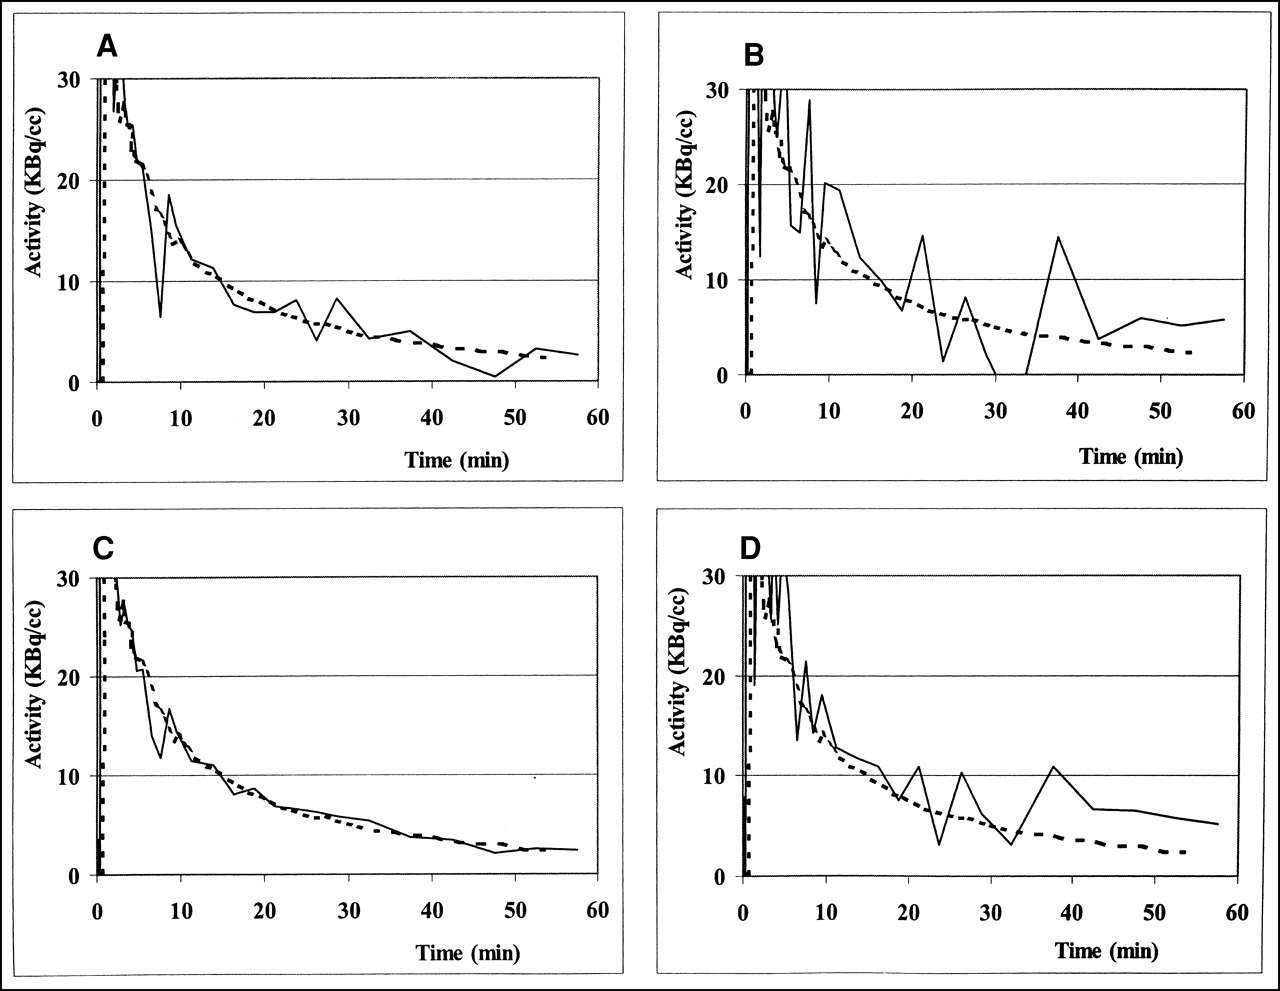
Example of time–activity curves from arterial blood sampler (dashed lines) and from both large and small LV and AA ROIs (solid lines). (A) AA; 5-mm ROI. (B) LV; 5-mm ROI. (C) AA; 15-mm ROI. (D) LV; 15-mm ROI. These examples show close relationship of AA time–activity curves with those of blood sampler, overestimation of FDG activity with LV time–activity curves, higher noise levels in time–activity curves from small ROIs, and higher noise levels in time–activity curves from LV compared with those from AA.
Number of Studies with 1 or More Time–Activity Curves Rejected
Compartmental and Patlak Graphical Analyses
In one study, the Akaike information criterion selected the compartment model with a variable k4, in contrast to the Schwarz criterion. In all remaining studies, both criteria selected the model with k4 = 0. Consequently, for comparison with the Patlak graphical analysis (23), compartmental modeling was used with k4 = 0 in this study.
In 1 patient, the parameter estimation from nonlinear regression analysis had to be rejected because of clear abnormal results. With Patlak analysis (23), no deficient fits were observed. Good correlation was observed between the results of compartmental and Patlak analysis (y = 1.01x; R2 = 0.99). Spread of MRGlu values (without the single outlier) are shown in Figure 3 (mean difference = −0.01, 2 SD = 0.01 μmol/mL/min). The range of SEs for the individual MRGlu as obtained from the compartmental and Patlak analyses was 0.00–1.52 μmol/mL/min and 0.00–0.02 μmol/mL/min, respectively. In 8 of the 18 studies, the SE was much higher with compartmental analysis; in the remaining 10 studies, it was comparable with that obtained with Patlak analysis.

Limits of agreement for compartmental (Comp) and Patlak analysis (n = 17) (23). Mean difference in MRGlu = −0.01, 2 SD = 0.01 μmol/mL/min.
Determination of MRGlu with IDIF
Because the Patlak graphical analysis (23) proved to be an appropriate alternative to compartmental analysis, this linear method was used in the evaluation of IDIF. Mean ratios of MRGlu determined with the IDIF and the arterial plasma input function are shown in Table 3. Ratios for AA and DA were close to 1. For LA and LV, the ratios ranged from 0.79 to 0.85 and differed significantly from 1 (P < 0.05).
Mean Ratios of Image-Derived MRGlu to AS MRGlu
The use of smaller ROIs resulted in slightly higher MRGlu values. However, except for DA, the use of large ROIs resulted in more consistent MRGlu values, as shown by the lower SD.
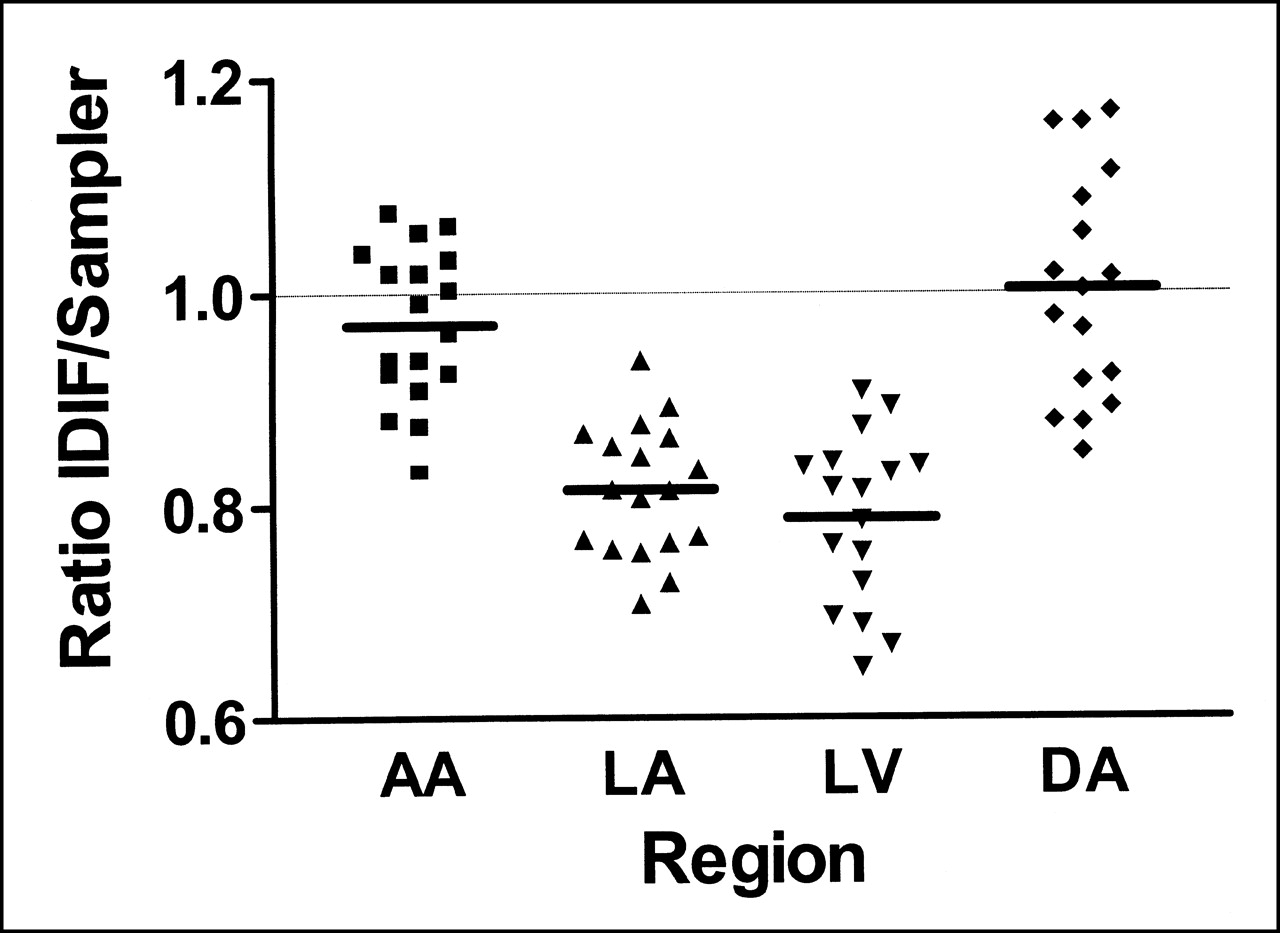
The individual ratios of all patients, using the large ROI (diameter, 15 mm), are shown in Figure 4. For LV and DA, the result of 1 study was regarded as an obvious outlier (ratios of 1.18 and 0.66, respectively) and therefore not used for further calculations. The highest variation was observed when the DA was used for characterization of the input function.

Ratios of MRGlu obtained with IDIF to MRGlu obtained with arterial input function (Sampler) of all patients. Because of 1 outlier, LV and DA consisted of 17 patients. Rejected ratio for LV was 1.18 and for DA was 0.66. ROIs of 15-mm diameter were used.
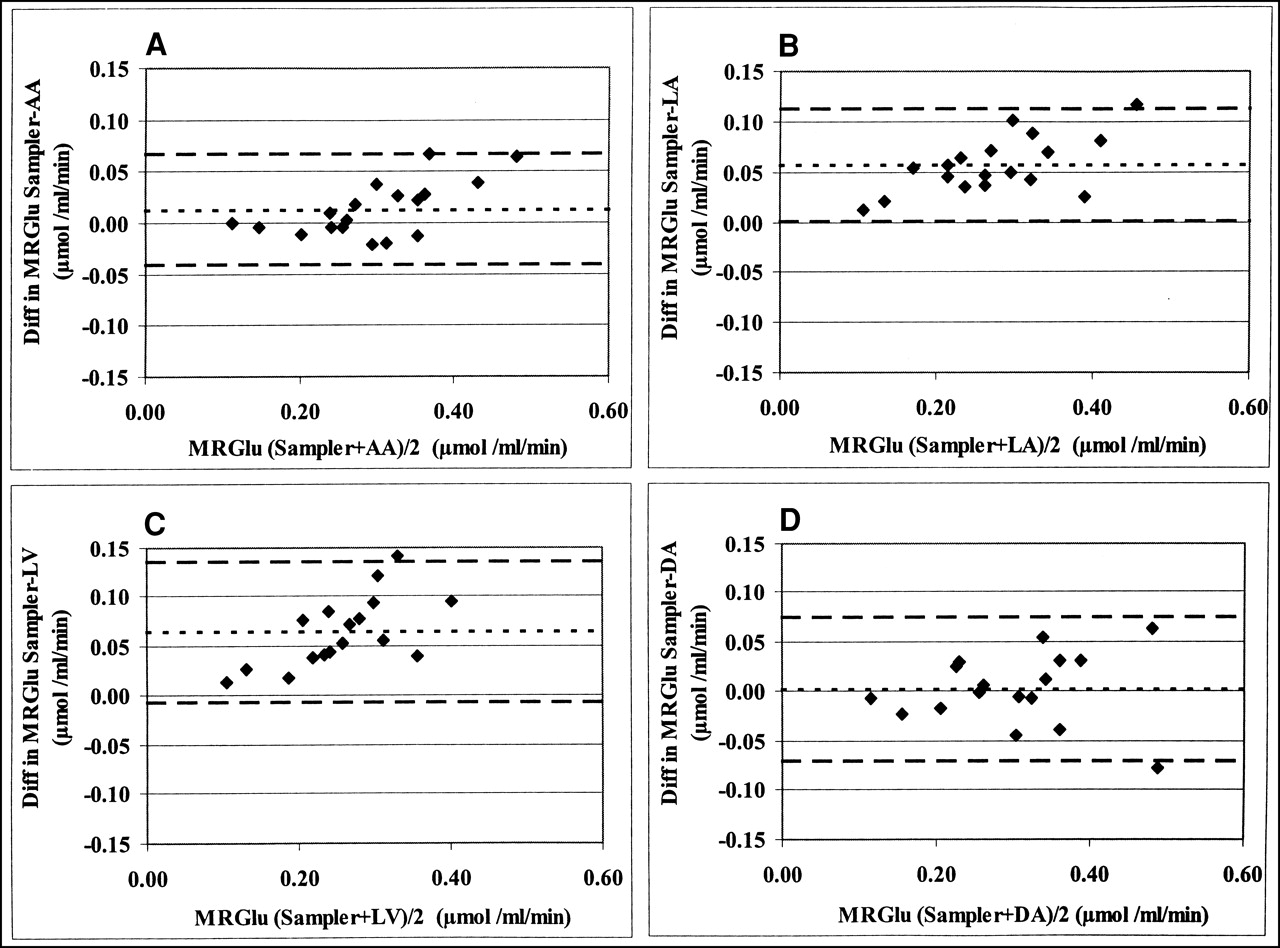
The estimates of agreement between MRGlu obtained with the IDIF (using the largest ROI) and the arterial plasma input function are shown in Figure 5. AA shows the narrowest limits of agreement (mean difference, 0.01 μmol/mL/min, 2 SD = 0.05).

Bland–Altman plot comparing MRGlu obtained with arterial input function and MRGlu obtained with corresponding IDIF (15-mm ROIs). Dotted line represents mean difference in MRGlu; dashed lines represent corresponding value at ±2 SD. (A) AA: mean difference = 0.01, 2 SD = 0.05 μmol/mL/min. (B) LA: mean difference = 0.06, 2 SD = 0.06 μmol/mL/min. (C) LV (n = 17); mean difference = 0.06, 2 SD = 0.07 μmol/mL/min. (D) DA (n = 17): mean difference = 0.00, 2 SD = 0.07 μmol/mL/min.
Interobserver Variability
Figure 6 shows the difference in MRGlu values when independent investigators defined ROIs to characterize the input function. The Bland–Altman plots show larger spread of values for LV and LA compared with AA and DA. The analysis of the interobserver variation using LV ROIs was based on 17 patients because 1 obvious outlier (difference = 0.18 μmol/mL/min) was rejected. Although the interobserver variability for the LV was slightly better when short-axis ROIs were used instead of transaxial ROIs (mean = −0.01, 2 SD = 0.04 μmol/mL/min), it was still worse than it was for the AA.

Bland–Altman analysis of interobserver variation using 15-mm ROIs. Dotted line represents mean difference in MRGlu; dashed lines represent corresponding value at ±2 SD. (A) AA; mean difference = 0.00, 2 SD = 0.02 μmol/mL/min. (B) LA; mean difference = −0.01, 2 SD = 0.08 μmol/mL/min. (C) LV (n = 17); mean difference = −0.03, 2 SD = 0.08 μmol/mL/min. (D) DA; mean difference = 0.00, 2 SD = 0.04 μmol/mL/min.
Discussion
Several authors have proposed the use of IDIF in dynamic FDG PET studies. Because partial-volume and spillover effects limit their reliability, corrections need to be applied (14,15,17,27–29). For determination of MRGlu in clinical studies, IDIF have been used both with and without spillover correction (7,16,30–33). Thus far, no study has determined which vascular structure is best suited for defining ROIs in cardiac FDG PET studies. Because PET scanners have undergone considerable technical improvement over the past decade (higher spatial resolution, increased field of view) and corrections should be avoided whenever possible, it is of interest to evaluate the accuracy of different IDIF. Recently, in a study comparing IDIF from the aortic arch, LV, and LA for oncologic applications (18), use of the aortic arch provided data with better statistical properties and without spillover from the myocardium. Although late venous blood samples were used as quality control, a direct comparison with an independently measured arterial input function was lacking. Moreover, as patients were kept in fasting conditions, potential spillover effects from the myocardium were significantly reduced compared with cardiac studies. In this study, the time–activity curves of several vascular structures within the field of view during a cardiac FDG PET study were compared with the gold standard, the arterial plasma time–activity curve.
In all image-derived vascular time–activity curves, earlier and higher peak activity of FDG was observed than in the arterial plasma time–activity curve, probably because of delay and dispersion of tracer in the arm and blood-sampling device. After shifting the arterial curve for delay, however, the difference of the integrated values for the first 5 min after injection of FDG was, on average, only a few percentage points. When Patlak graphical analysis (23) is used for calculation of MRGlu, the impact of such a difference in peak activity will be small.
In contrast, overestimation of FDG activity at later time points, seen in time–activity curves derived from the LV and LA, will have a major effect on the calculation of MRGlu in both Patlak (23) and compartmental analysis. These effects of spillover from myocardial tissue into the LV blood pool had already been recognized in early FDG PET studies (14,27,34). In an attempt to minimize partial- volume and spillover effects, small ROIs are frequently used. The present results indicate, however, that a smaller ROI will only modestly reduce spillover effects, whereas statistical noise in the time–activity curves will increase. Time–activity curves from the LV were especially sensitive to statistical noise, probably because of the limited number of planes that could be used for defining ROIs. Time–activity curves derived from the AA suffered less from statistical noise and corresponded most consistently with the arterial plasma time–activity curve (Fig. 2).
In this study, results of Patlak graphical analysis (23) showed good agreement with compartmental analysis, in agreement with previous reports (14,18,28). Consequently, because Patlak graphical analysis is less sensitive to noise, it was used for the comparison of different input functions in determining MRGlu.
For each patient in this study, ratios of MRGlu obtained with IDIF and MRGlu obtained with the arterial plasma time–activity curve as input function were calculated. The mean ratios for AA and DA were close to 1, indicating that these results were comparable with the results obtained with arterial sampling (Table 3). In contrast, LA and LV resulted in significant underestimation of myocardial MRGlu. A similar underestimation of MRGlu was observed when short-axis ROIs were used instead of transaxial LV ROIs. MRGlu values for small ROIs were only slightly higher than those obtained with larger ROIs. Apparently, there was only a minor reduction in spillover effects. This is partly because of the smaller overlap between adjacent circles for the small ROIs compared with the large ROIs; the difference between the effective ROIs used in the analysis was somewhat smaller then suggested by the difference in radii. In addition, partial-volume effects for LV ROIs will be affected by cardiac and respiratory movement. As a result of higher noise levels, a larger variation was observed in the results for the smaller ROIs (Table 3). Therefore, large ROIs (diameter, approximately 15 mm) appeared to be more useful for characterization of the input function. The IDIF that had the highest agreement with the online arterial blood sampler appeared to be the AA. Although the DA was a good alternative, there was a larger variability in the results (Table 3; Fig. 4).
Another important advantage of AA and DA was the lower interobserver variation of MRGlu than with LA and LV, probably because of the smaller size of the aortic structures, forcing the investigators to define almost identical ROIs. Interobserver variability could be improved using short-axis ROIs instead of transaxial LV ROIs but still was significantly higher than with AA.
This study indicates that without correction for partial- volume and spillover effects, the AA is the best structure for defining IDIF. Several methods for partial-volume and spillover correction have been developed (14,15,17,27–29,35) and their use might have led to better results for LV and LA. Assessment of the various correction methods was, however, beyond the scope of this study. Although, in theory, partial-volume and spillover correction methods will allow the use of larger ROIs, it should be noted that any correction will also lead to some degree of statistical degradation of signals (i.e., subtraction of counts). Therefore, the purpose of this study was to determine which vascular structure would require the smallest correction.
Conclusion
For noninvasive measurement of the myocardial MRGlu, the AA is the structure of choice for defining the input function and a large ROI (diameter, approximately 15 mm) should be used to obtain the most reliable time–activity curves.
Footnotes
Received Feb. 14, 2001; revision accepted Jul. 13, 2001.
For correspondence or reprints contact: Arno P. van der Weerdt, MD, Department of Cardiology, Room 6N120, VU Medical Center, Postbus 7057, 1007 MB Amsterdam, The Netherlands.
References
In this issue


Jump to section
Related Articles
Cited By...
- Ultrashort Oncologic Whole-Body [18F]FDG Patlak Imaging Using LAFOV PET
- Can Internal Carotid Arteries Be Used for Noninvasive Quantification of Brain PET Studies?
- Total-Body Quantitative Parametric Imaging of Early Kinetics of 18F-FDG
- Measurement of PET Quantitative Bias In Vivo
- Consensus Recommendations on the Use of 18F-FDG PET/CT in Lung Disease
- Dynamic PET of Human Liver Inflammation: Impact of Kinetic Modeling with Optimization-Derived Dual-Blood Input Function
- Forward to the Past: The Case for Quantitative PET Imaging
- Noninvasive Quantification of Myocardial 11C-Meta-Hydroxyephedrine Kinetics
- Image-Derived Input Function from the Vena Cava for 18F-FDG PET Studies in Rats and Mice
- In Hot Blood: Quantifying the Arterial Input Function
- A Curve-Fitting Approach to Estimate the Arterial Plasma Input Function for the Assessment of Glucose Metabolic Rate and Response to Treatment
- Comparison of 3 Methods of Automated Internal Carotid Segmentation in Human Brain PET Studies: Application to the Estimation of Arterial Input Function
- Reproducibility of Tumor Perfusion Measurements Using 15O-Labeled Water and PET
- Novel Reference Region Model Reveals Increased Microglial and Reduced Vascular Binding of 11C-(R)-PK11195 in Patients with Alzheimer's Disease
- Spillover and Partial-Volume Correction for Image-Derived Input Functions for Small-Animal 18F-FDG PET Studies
- Image-Derived Input Function for Assessment of 18F-FDG Uptake by the Inflamed Lung
- Partial-Volume Correction in PET: Validation of an Iterative Postreconstruction Method with Phantom and Patient Data
- Comparison of Image-Derived and Arterial Input Functions for Estimating the Rate of Glucose Metabolism in Therapy-Monitoring 18F-FDG PET Studies
- Prognostic Relevance of Response Evaluation Using [18F]-2-Fluoro-2-Deoxy-D-Glucose Positron Emission Tomography in Patients With Locally Advanced Non-Small-Cell Lung Cancer
- Quantitative Comparison of Analytic and Iterative Reconstruction Methods in 2- and 3-Dimensional Dynamic Cardiac 18F-FDG PET
- 18F-FDG PET Evaluation of the Response to Therapy for Lymphoma and for Breast, Lung, and Colorectal Carcinoma
- Methods to Monitor Response to Chemotherapy in Non-Small Cell Lung Cancer with 18F-FDG PET