


Article Figures & Data
Figures
- FIGURE 1.
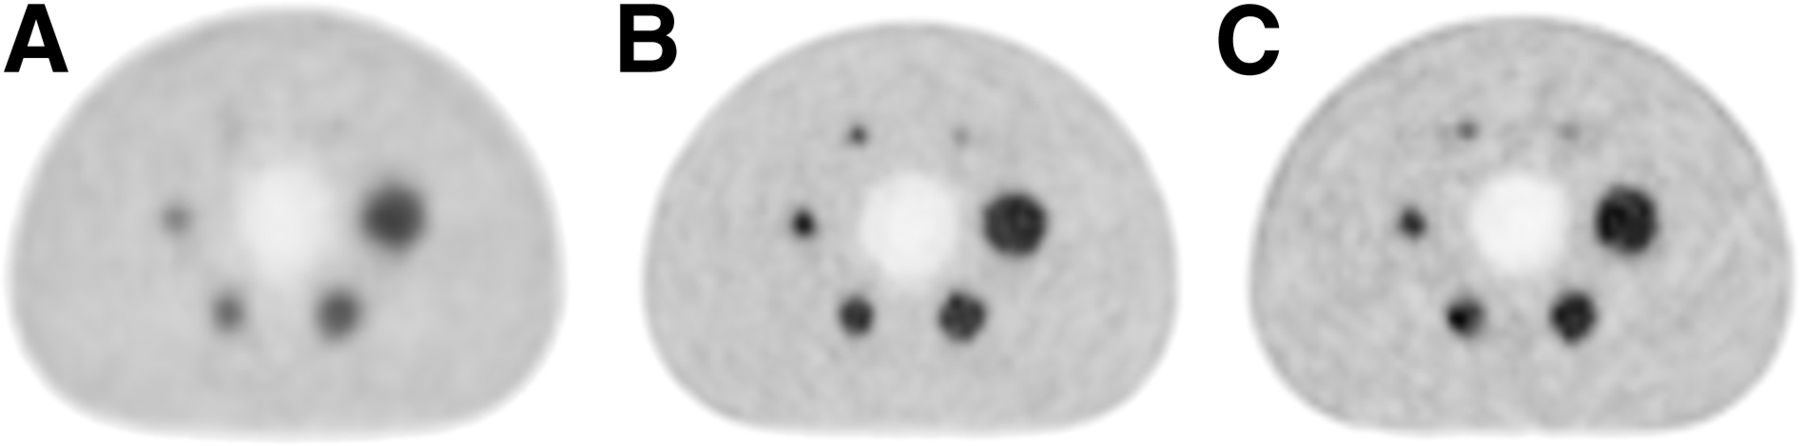
Central axial slices through reconstructed PET images of NEMA image-quality phantom acquired from 3 of the involved 13 PET/CT imaging systems (Table 1): PCS3 (A), PCS13 (B), and PCS8 (C). Acquisitions followed local clinical standard protocols as part of previous study (33). PET image planes demonstrate typical variations in appearance of lesions and backgrounds.
- FIGURE 2.
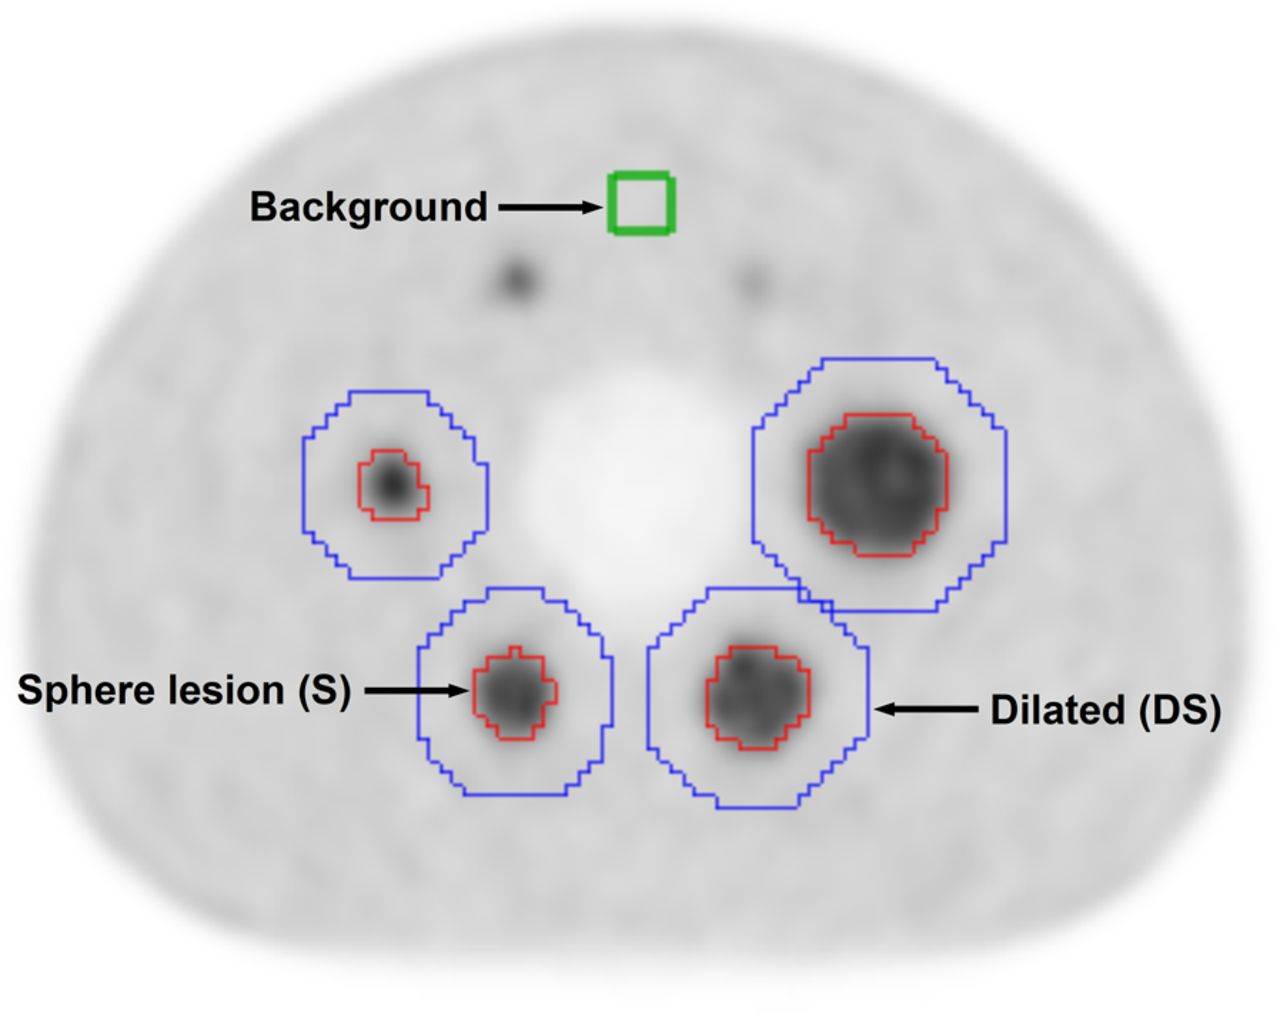
Axial slice of reconstructed NEMA image-quality PET phantom image with its overlaid delineated VOIs. Cuboid VOI (green) represents background region. Four small sphere VOIs (red) represent semiautomatically delineated spheres S17, S22, S28, and S37 from left to right. Larger, dilated, VOIs (blue) are generated to avoid interpolation artifacts at border voxel positions in S37–S17 VOIs during resampling.
- FIGURE 3.
Representation of data acquisition and feature extraction processes. Same physical image-quality (IQ) phantom is used to acquire 13 18F-FDG PET/CT images from 12 imaging centers (PCS1–PCS13). Four largest visible hot spheres are delineated and analyzed. Thus, 37 radiomic features are extracted from each sphere with 3 voxel size and 4 bin size configurations.
- FIGURE 4.
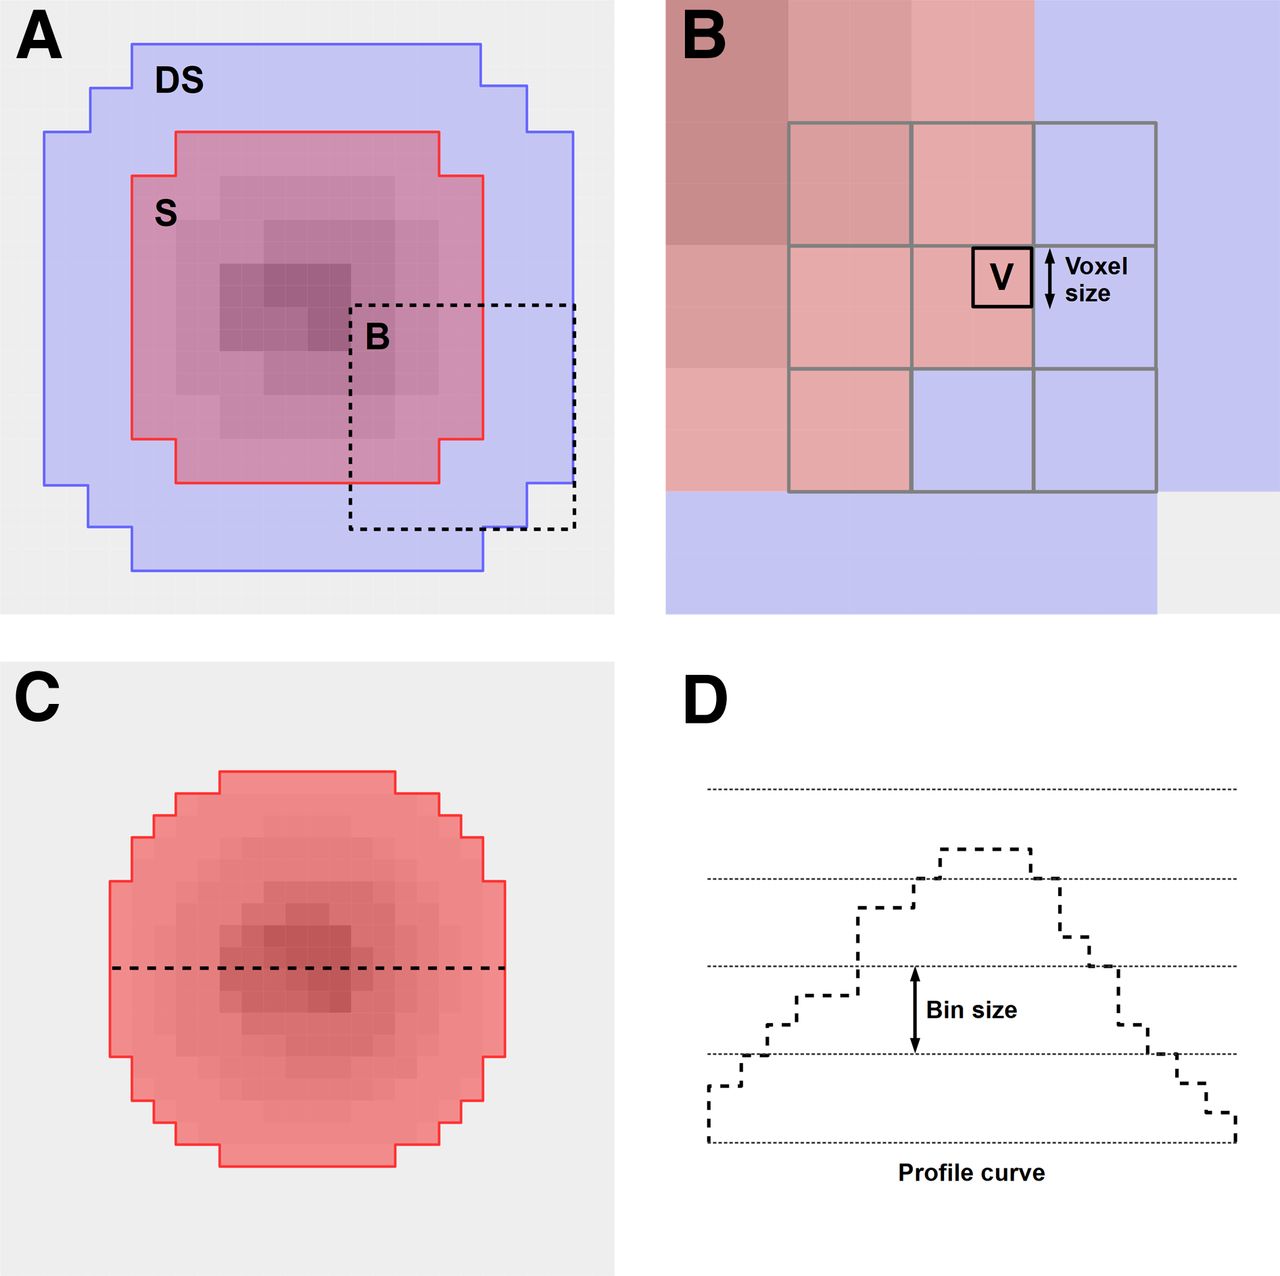
Explanation of resampling and binning steps that are performed for feature extraction. (A) Original image resolution with S VOI (red) and extended DS VOI (blue) regions (Fig. 2). Note, DS VOI also includes S VOI voxels. Dashed frame indicates zoomed subregion B. (B) Example target voxel (V in black frame) and original neighboring voxels (gray frames) that are involved in interpolation to determine V. Some of these voxels are outside S VOI; thus, resampling is performed from DS VOIs. (C) Radiomics analysis is performed from resampled DS VOI voxels that are inside resampled S VOI region (red). (D) Profile curve of voxels present at dashed line in C. Binning is characterized by choice of bin size, which defines which values are transformed to same bin. Feature extraction is performed over binned voxel values. This process results in variable number of bins per lesion.
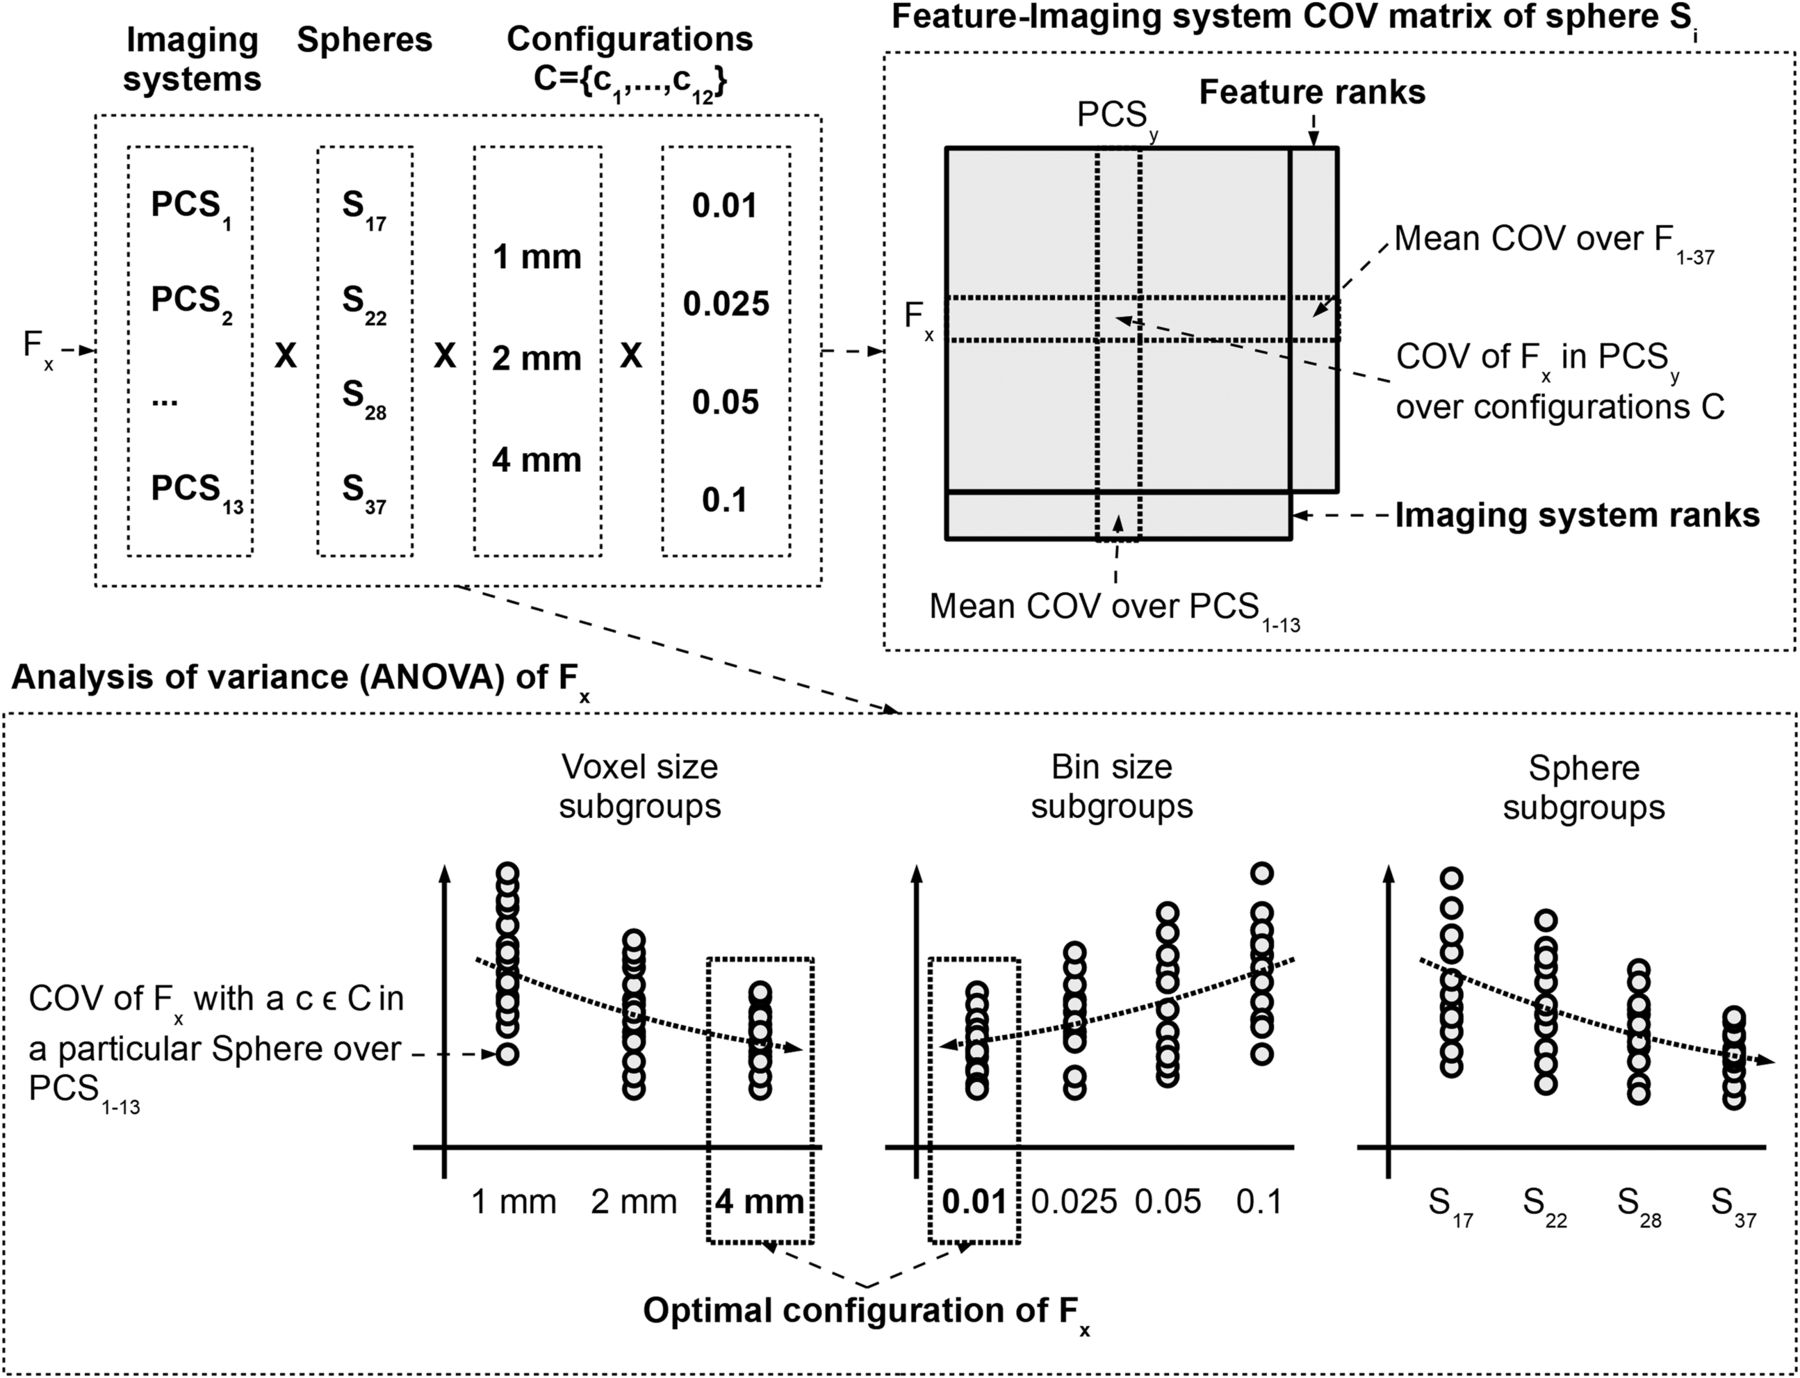
- FIGURE 5.
Each feature (Fx) has 13 imaging system, 4 sphere, and 12 configuration (3 voxel size and 4 bin size) variants. Feature and imaging system ranks are performed from feature-imaging system COV matrices. Each sphere (Si) has its own COV matrix. Here, each matrix cell corresponds to COV of given feature Fx and PET/CT imaging system (PCSy) over different feature extraction configurations (C). ANOVA analysis builds on subgrouping of COVs over PCS variants, as acquired by particular configuration (
 ) in particular spheres. Optimal voxel size and bin size parameters are selected for Fx that minimize COV across imaging systems.
 - FIGURE 6.
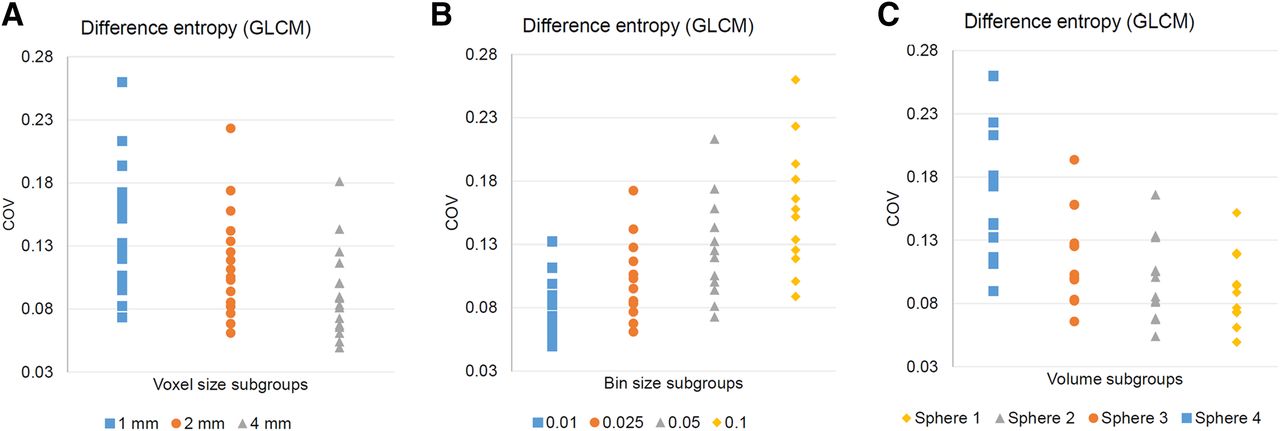
COV distributions of voxel size (A), bin size (B), and sphere volume (C) subgroups of feature difference entropy (GLCM). Each plotted sample corresponds to COV of given feature over PCS1–13 with particular voxel size, bin size, and sphere volume configuration. Spheres 1–4 correspond to spheres S37–S17, respectively. Based on trend analysis, difference entropy has optimized voxel size of 4 mm (decreasing trend in function of increasing voxel size), optimized bin size of 0.01 (increasing trend in function of increasing bin size), and decreasing trend in function of decreasing volume.


Tables
- TABLE 1
Image Acquisition and Reconstruction Protocols for NEMA Image-Quality Phantom Studies Using 13 PET/CT Systems (33)
System Algorithm PSF TOF Iterations Subsets Filter FWHM Voxel size (mm) Time/bed position (min) BckVar (%) PCS1 Blob-OS-TF NA Yes NA NA Un NA 4.00 1:15 2.80 PCS2 OSEM No No 4 8 Ga 5 4.06 3:00 2.50 PCS3 OSEM No No 2 8 Ga 5 5.31 2:00 2.97 PCS4 LOR-RAMLA No No NA NA Un NA 4.00 1:30 4.51 PCS5 TrueX Yes No 3 21 Ga 2 4.07 2:00 2.72 PCS6 TrueX Yes No 4 21 None NA 4.07 3:00 3.19 PCS7 TrueX Yes No 4 21 None NA 4.06 3:00 3.21 PCS8 TrueX Yes No 3 21 Ga 2 4.07 2:00 3.22 PCS9 TrueX (HD PET) Yes No 3 21 Ga 2 3.18 2:00 3.07 PCS10 VUE Point No No 2 21 Ga 6 5.47 2:00 7.30 PCS11 VUE Point FX Yes Yes 4 18 Ga 4 3.27 2:00 2.65 PCS12 VUE Point FX No Yes 2 32 Ga 6.4 5.47 2:00 2.51 PCS13 VUE Point HD Yes No 2 24 Ga 4 2.73 3:00 2.81 PSF = point spread function; TOF = time-of-flight; FWHM = full-width at half-maximum; BckVar (%) = background variability calculated according to NEMA NU2-2012; Blob-OS-TF = Blob-basis function ordered-subsets time of flight; NA = not applicable; OSEM = ordered-subset expectation maximization; Un = unknown; LOR-RAMLA = line-of-response–based row-action-maximum-likelihood algorithm; Ga = gaussian.
All imaging systems operated with uniform voxel sizes.
Feature category Feature name GLCM (18) Angular second moment, auto correlation, cluster prominence, cluster shade, contrast, correlation, difference entropy, difference variance, dissimilarity, entropy, information correlation, inverse difference, inverse difference moment, maximum probability, sum average, sum entropy, sum-of-squares variance, sum variance GLSZM (11) Gray-level nonuniformity, high gray-level zone emphasis, large zone high gray emphasis, large zone low gray emphasis, large zone size emphasis, low gray-level zone emphasis, small zone high gray emphasis, small zone low gray emphasis, small zone size emphasis, zone size nonuniformity, zone size percentage NGTDM (5) Busyness, coarseness, complexity, contrast, texture strength Shape (3) Compactness, spheric dice coefficient, volume Details of feature calculations have been previously published (18,36).
Groups Voxel size Bin size Volume Subgroups 3 (1 mm, 2 mm, 4 mm) 4 (0.01, 0.025, 0.05, 0.1) 4 (S37, S28, S22, S17) Subgroup elements 16 (4 volumes × 4 bin sizes) 12 (4 volumes × 3 voxel sizes) 12 (3 voxel sizes × 4 bin sizes) - TABLE 4
Feature Ranks with Regard to Average Absolute COV for 4 Largest Spheres (S37–S17).
Feature Feature category S37 COV rank S28 COV rank S22 COV rank S17 COV rank Information correlation GLCM 0.00* 0.00* 0.00* 0.00* Compactness Shape 0.01* 0.02* 0.02* 0.03* Volume Shape 0.02* 0.02* 0.03* 0.03* Spheric dice coefficient Shape 0.03* 0.03* 0.07† 0.1‡ Sum entropy GLCM 0.17‡ 0.17‡ 0.18‡ 0.19‡ Correlation GLCM 0.14‡ 0.18‡ 0.22 0.29 Entropy GLCM 0.19‡ 0.19‡ 0.19‡ 0.21 Small zone size emphasis GLZSM 0.26 0.27 0.28 0.29 Difference entropy GLCM 0.31 0.31 0.32 0.33 Zone size percentage GLZSM 0.53 0.53 0.56 0.62 Inverse difference GLCM 0.57 0.59 0.58 0.56 Coarseness NGTDM 0.59 0.58 0.59 0.59 Inverse difference moment GLCM 0.78 0.81 0.80 0.76 Sum average GLCM 0.83 0.83 0.83 0.83 Dissimilarity GLCM 1.07 1.07 1.07 1.08 Small zone low gray emphasis GLZSM 1.12 1.10 1.10 1.11 Low gray-level zone emphasis GLZSM 1.2 1.17 1.16 1.09 Maximum probability GLCM 1.2 1.19 1.19 1.21 High gray-level zone emphasis GLZSM 1.37 1.34 1.3 1.28 Angular second moment GLCM 1.35 1.34 1.32 1.31 Auto correlation GLCM 1.35 1.35 1.35 1.36 Texture strength NGTDM 1.56 1.39 1.29 1.26 Sum variance GLCM 1.35 1.35 1.35 1.36 Sum-of-squares variance GLCM 1.35 1.35 1.35 1.36 Small zone high gray emphasis GLZSM 1.42 1.39 1.37 1.35 Cluster prominence GLCM 1.68 1.69 1.69 1.7 Cluster shade GLCM 3.56 1.63 1.61 1.61 Zone size nonuniformity GLZSM 1.7 1.76 1.92 1.85 Busyness NGTDM 1.73 1.79 1.78 1.7 Complexity NGTDM 2.12 1.86 1.72 1.65 Contrast GLCM 2.03 2.03 2.04 2.06 Difference variance GLCM 2.03 2.04 2.05 2.07 Contrast NGTDM 1.69 2.10 2.35 2.46 Gray-level nonuniformity GLZSM 2.1 2.12 2.17 2.21 Large zone high gray emphasis GLZSM 2.75 2.65 2.55 2.41 Large zone size emphasis GLZSM 3.23 3.24 3.22 3.13 Large zone low gray emphasis GLZSM 3.29 3.28 3.26 3.21 - TABLE 5
Imaging System (PCS) Protocol Parameter Ranks with Regard to Average Absolute COV for 4 Largest Spheres (S37–S17)
PET/CT system Algorithm S37 COV S28 COV S22 COV S17 COV PCS13 VUE Point HD 1.17 1.17 1.16 1.16 PCS11 VUE Point FX 1.19 1.17 1.18 1.15 PCS5 TrueX 1.18 1.18 1.16 1.18 PCS6 TrueX 1.2 1.18 1.2 1.17 PCS7 TrueX 1.18 1.2 1.2 1.22 PCS8 TrueX 1.2 1.2 1.19 1.23 PCS9 TrueX (HD PET) 1.85 1.17 1.2 1.2 PCS1 Blob-OS-TF 1.22 1.21 1.23 1.21 PCS4 LOR-RAMLA 1.23 1.24 1.23 1.22 PCS2 OSEM 1.22 1.23 1.25 1.23 PCS12 VUE Point FX 1.23 1.25 1.24 1.23 PCS3 OSEM 1.27 1.26 1.25 1.23 PCS10 VUE Point 1.25 1.27 1.26 1.26 Blob-OS-TF = Blob-basis function ordered-subsets time of flight; LOR-RAMLA = line-of-response–based row-action-maximum-likelihood algorithm; OSEM = ordered-subset expectation maximization.
Smaller ranks correspond to low COV variances in given sphere volume across each of 37 features and their 12 feature extraction configurations (C).
- TABLE 6
Features with Their Sphere S37–S17 COVs (Mean ± SD), Optimal Voxel Size, Optimal Bin Size, and Resultant Optimized COV Across Imaging Systems
Feature Feature category COV (%) Voxel size Bin size COV (%) Information correlation GLCM 0.0 ± 0.0* 4 0.01 0.0* Compactness Shape 0.6 ± 0.3* 1 NA 0.2* Small zone size emphasis GLZSM 12.3 ± 8.4‡ 4 0.01 2.0* Entropy GLCM 6.9 ± 3.0† 4 0.01 2.1* Zone size percentage GLZSM 31.3 ± 27.5 4 0.01 3.6* Sum entropy GLCM 5.6 ± 1.3† 4 0.01 3.7* Large zone size emphasis GLZSM 100.3 ± 75.4 4 0.01 4.9* Difference entropy GLCM 11.7 ± 3.6‡ 4 0.01 6.5† Spheric dice coefficient Shape 7.9 ± 1.4† 2 NA 6.8† Coarseness NGTDM 11.2 ± 4.7‡ 1 0.01 7.45† Correlation GLCM 13.1 ± 0.1‡ 1 0.1 12.9‡ Inverse difference GLCM 21.3 ± 3.1 1 0.1 14.9‡ Angular second moment GLCM 56.5 ± 17.7 4 0.01 17.6‡ Inverse difference moment GLCM 29.8 ± 3.8 1 0.1 20.6 Volume Shape 22.8 ± 0.5 4 NA 22.0 Sum average GLCM 26.4 ± 0.7 2 0.01 25.3 Low gray-level zone emphasis GLZSM 49.7 ± 28.5 4 0.01 26.9 Small zone low gray emphasis GLZSM 48.6 ± 30.5 4 0.01 27.8 Busyness NGTDM 60.5 ± 16.8 4 0.01 27.9 Gray-level nonuniformity GLZSM 41.7 ± 3.9 4 0.01 28.7 Contrast NGTDM 51.9 ± 12 1 0.1 29.0 Texture strength NGTDM 43.9 ± 8.2 4 0.01 30.0 Dissimilarity GLCM 31.4 ± 0.5 4 0.01 30.7 Large zone low gray emphasis GLZSM 135.3 ± 75.4 4 0.01 30.8 Maximum probability GLCM 52.4 ± 11 4 0.01 33.4 High gray-level zone emphasis GLZSM 41.7 ± 3.9 1 0.05 35.6 Zone size nonuniformity GLZSM 62.7 ± 17 4 0.01 38.3 Large zone high gray emphasis GLZSM 76.6 ± 52 4 0.01 45.0 Auto correlation GLCM 47.1 ± 0.8 2 0.01 45.7 Sum-of-squares variance GLCM 47.7 ± 1.2 2 0.01 46.1 Sum variance GLCM 47.9 ± 0.7 4 0.01 46.9 Small zone high gray emphasis GLZSM 50.3 ± 7.8 4 0.01 47.4 Difference variance GLCM 57.9 ± 1.3 1 0.1 54.0 Complexity NGTDM 64.6 ± 4.8 4 0.01 55.1 Contrast GLCM 57.1 ± 0.5 4 0.01 56.4 Cluster shade GLCM 82.5 ± 4.7 1 0.01 76.9 Cluster prominence GLCM 86.6 ± 1.2 4 0.01 84.7
Supplemental Data
Files in this Data Supplement:


Jump to section
Related Articles
Cited By...
- Improved Prognosis of Treatment Failure in Cervical Cancer with Nontumor PET/CT Radiomics
- Repeatability of 18F-FDG PET Radiomic Features in Cervical Cancer
- Radiomics Features of 18F-fluorodeoxyglucose Positron-Emission Tomography as a Novel Prognostic Signature in Colorectal Cancer
- Introduction to Radiomics
- Experimental Multicenter and Multivendor Evaluation of the Performance of PET Radiomic Features Using 3-Dimensionally Printed Phantom Inserts