


Abstract
Radiomics analysis of 18F-FDG PET/CT images promises well for an improved in vivo disease characterization. To date, several studies have reported significant variations in textural features due to differences in patient preparation, imaging protocols, lesion delineation, and feature extraction. Our objective was to study variations in features before a radiomics analysis of 18F-FDG PET data and to identify those feature extraction and imaging protocol parameters that minimize radiomic feature variations across PET imaging systems. Methods: A whole-body National Electrical Manufacturers Association image-quality phantom was imaged with 13 PET/CT systems at 12 different sites following local protocols. We selected 37 radiomic features related to the 4 largest spheres (17–37 mm) in the phantom. On the basis of a combined analysis of voxel size, bin size, and lesion volume changes, feature and imaging system ranks were established. A 1-way ANOVA was performed over voxel size, bin size, and lesion volume subgroups to identify the dependency and the trend change in feature variations across these parameters. Results: Feature ranking revealed that the gray-level cooccurrence matrix and shape features are the least sensitive to PET imaging system variations. Imaging system ranking illustrated that the use of point-spread function, small voxel sizes, and narrow gaussian postfiltering helped minimize feature variations. ANOVA subgroup analysis indicated that variations in each of the 37 features and for a given voxel size and bin size can be minimized. Conclusion: Our results provide guidance to selecting optimized features from 18F-FDG PET/CT studies. We were able to demonstrate that feature variations can be minimized for selected image parameters and imaging systems. These results can help imaging specialists and feature engineers in increasing the quality of future radiomics studies involving PET/CT.
Radiomics refers to the process of extracting and analyzing in vivo features from medical images for disease characterization (1). The radiomics approach was originally conceived for morphologic images only (2,3) but recently was adopted also for the analysis of 18F-FDG PET/CT images, with promising results in various patient cohorts (4–9). It has been shown that several features, particularly textural indices, used in the radiomics approach are affected by, for example, variations in biologic factors (10), imaging and reconstruction protocols (11,12), delineation approaches (13–15), or feature extraction methods (12,16–18).
Feature variations challenge the reproducibility of radiomics assessments; therefore, standardized protocols related to patient preparation, imaging, and feature engineering are needed (18,19). In this context, Vallières et al. recently pointed to the importance of standardized image processing and feature computation for better addressing the “statistical quality of radiomics analyses” (20). Although individual feature computations in light of variable image resolutions (12,21–26) or bin sizes (27–32) have been investigated, optimized feature extraction after the combined analysis of voxel size, bin size, and lesion volume changes has not yet been reported. Instead, the choice of protocol parameters is still driven largely by the wish to maximize individual predictive performance. This is in contrast to the need for standards in radiomics analysis at the level of individual feature extraction parameters.
Our hypothesis was that feature extraction can be optimized through the analysis of 18F-FDG PET image features derived from multiple scans of a standard phantom. We used multicenter data to provide a general solution to optimize feature extraction applicable mono- or multicentrically. We performed an in-depth analysis of features regarding voxel size, bin size, and lesion volume changes to support feature extraction optimization.
MATERIALS AND METHODS
Phantom Acquisition
The data used for this study were acquired in the context of a multicenter study across 12 PET imaging centers involving 13 imaging systems in Austria (33). A National Electrical Manufacturers Association (NEMA) image-quality phantom was filled with a background activity concentration of about 5.3 kBq/mL as recommended by the NEMA NU2-2012 standard (34). The phantom contains 6 spheres (10–37 mm) that were filled with an activity concentration of 4 times the background concentration (Fig. 1). All phantom acquisitions and image reconstructions were performed by the same expert according to the on-site clinical standards for whole-body 18F-FDG PET/CT imaging (Table 1).

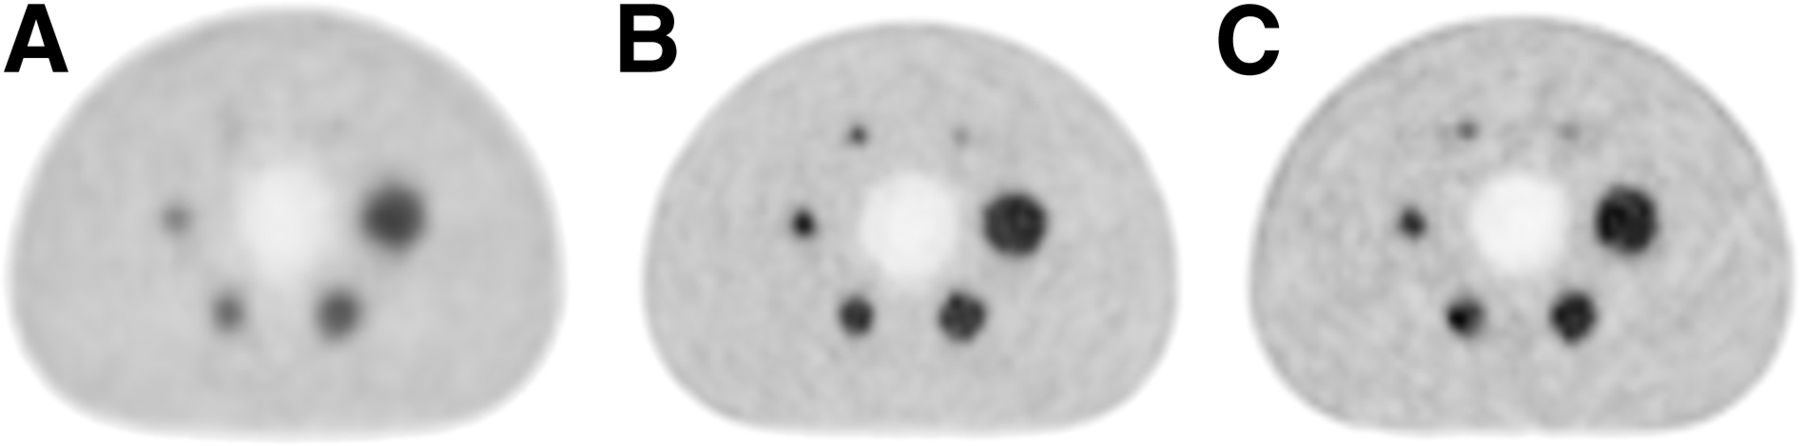
Central axial slices through reconstructed PET images of NEMA image-quality phantom acquired from 3 of the involved 13 PET/CT imaging systems (Table 1): PCS3 (A), PCS13 (B), and PCS8 (C). Acquisitions followed local clinical standard protocols as part of previous study (33). PET image planes demonstrate typical variations in appearance of lesions and backgrounds.
Image Acquisition and Reconstruction Protocols for NEMA Image-Quality Phantom Studies Using 13 PET/CT Systems (33)
Delineation
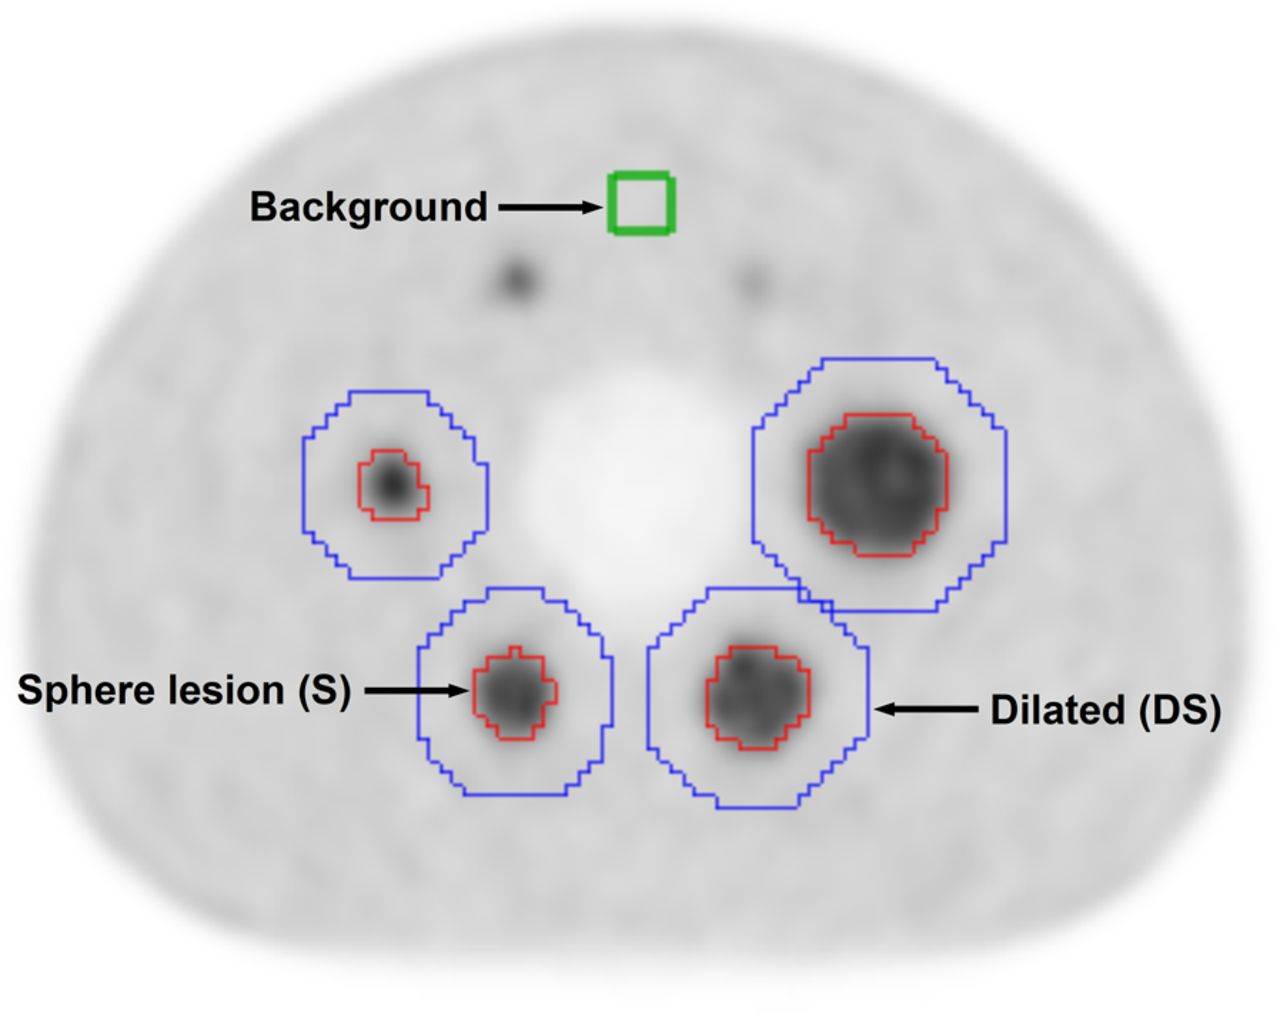
The delineation process was performed using the Hermes Hybrid 3D software, version 2.0 (Hermes Medical Solutions). First, a cuboid volume of interest (VOI, 5 × 5 × 5 voxels) was defined in the background area of each PET image. Then, the 4 largest spheres (spheres 1–4, with diameters of 37, 28, 22, and 17 mm) that were visually identifiable in all reconstructed PET images were delineated using a semiautomatic region-growing tool to generate corresponding VOIs (S37, S28, S22, and S17). Only voxels with values higher than the mean of the background VOI were included in a given VOI. The VOIs (S37–S17) were dilated by 5 voxels by an automated dilatation tool (DS37, DS28, DS22, and DS17 VOIs; Fig. 2). This step was performed to avoid interpolation artifacts at border voxel positions in the S37–S17 VOIs during the resampling.

Axial slice of reconstructed NEMA image-quality PET phantom image with its overlaid delineated VOIs. Cuboid VOI (green) represents background region. Four small sphere VOIs (red) represent semiautomatically delineated spheres S17, S22, S28, and S37 from left to right. Larger, dilated, VOIs (blue) are generated to avoid interpolation artifacts at border voxel positions in S37–S17 VOIs during resampling.
Feature Extraction
For each acquisition, features were extracted from resampled images with 3 different voxel sizes (1, 2, and 4 mm) and combined with 4 different bin sizes (0.01, 0.025, 0.05, and 0.1 in units of tumor-to-background ratio). The combination of the image resolution and bin size parameters resulted in 12 feature extraction configurations ( ) (Fig. 3). The use of absolute bin sizes resulted in a variable number of bins (Fig. 4) (27).

Representation of data acquisition and feature extraction processes. Same physical image-quality (IQ) phantom is used to acquire 13 18F-FDG PET/CT images from 12 imaging centers (PCS1–PCS13). Four largest visible hot spheres are delineated and analyzed. Thus, 37 radiomic features are extracted from each sphere with 3 voxel size and 4 bin size configurations.
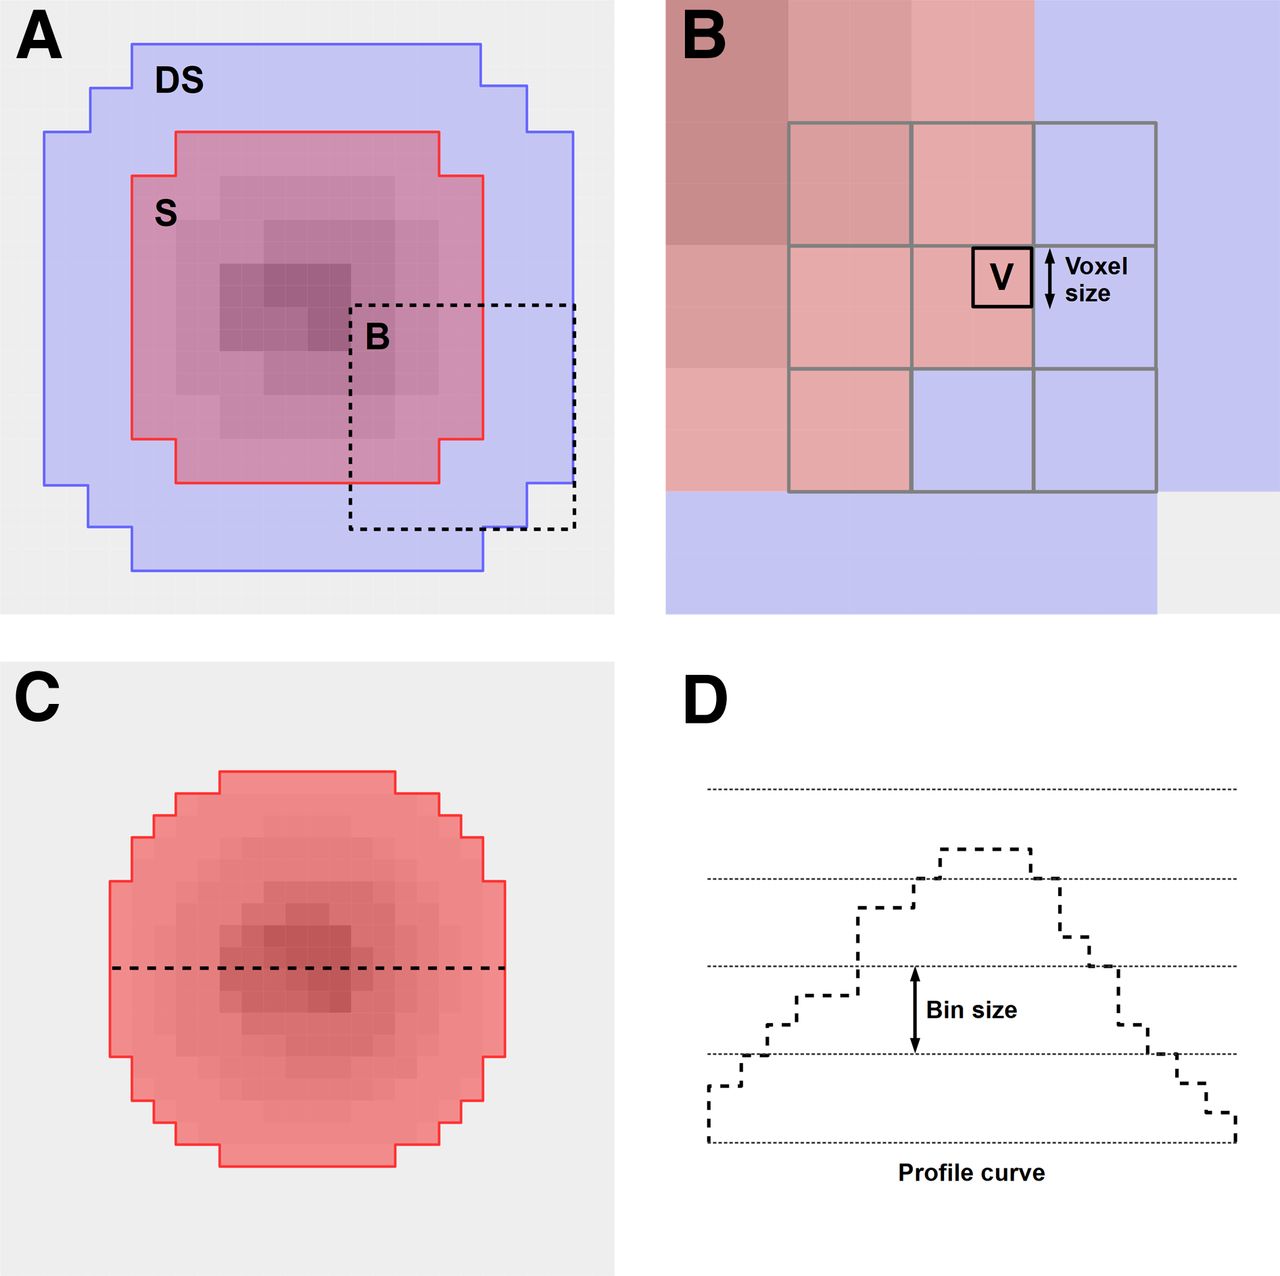
Explanation of resampling and binning steps that are performed for feature extraction. (A) Original image resolution with S VOI (red) and extended DS VOI (blue) regions (Fig. 2). Note, DS VOI also includes S VOI voxels. Dashed frame indicates zoomed subregion B. (B) Example target voxel (V in black frame) and original neighboring voxels (gray frames) that are involved in interpolation to determine V. Some of these voxels are outside S VOI; thus, resampling is performed from DS VOIs. (C) Radiomics analysis is performed from resampled DS VOI voxels that are inside resampled S VOI region (red). (D) Profile curve of voxels present at dashed line in C. Binning is characterized by choice of bin size, which defines which values are transformed to same bin. Feature extraction is performed over binned voxel values. This process results in variable number of bins per lesion.
To perform the feature extraction, the voxel values in the dilated VOIs (DS37–DS17) were normalized to the mean of the respective background VOI to calculate tumor-to-background ratios (35,36). The resampling to the given target resolution was then performed on the dilated VOIs (DS37–DS17) by ordinary kriging interpolation (36,37). The feature extraction was performed from the normalized, resampled DS VOIs, where the resampled S37–S17 VOIs served as binary masks to identify voxels for the feature extraction (Fig. 4).
Of the 37 features extracted from each of the 4 spheres (36), 34 were textural (3,18), whereas 3 features were shape-related and selected as independent features from binning (18,31,38) for reference comparison (Table 2). The feature extraction was performed by an in-house–developed program (feature extraction implementation properties are described in the supplemental definitions available at http://jnm.snmjournals.org).
Extracted Features from 4 Largest Spheres of Each PET Acquisition
Feature and PET/CT System Ranking
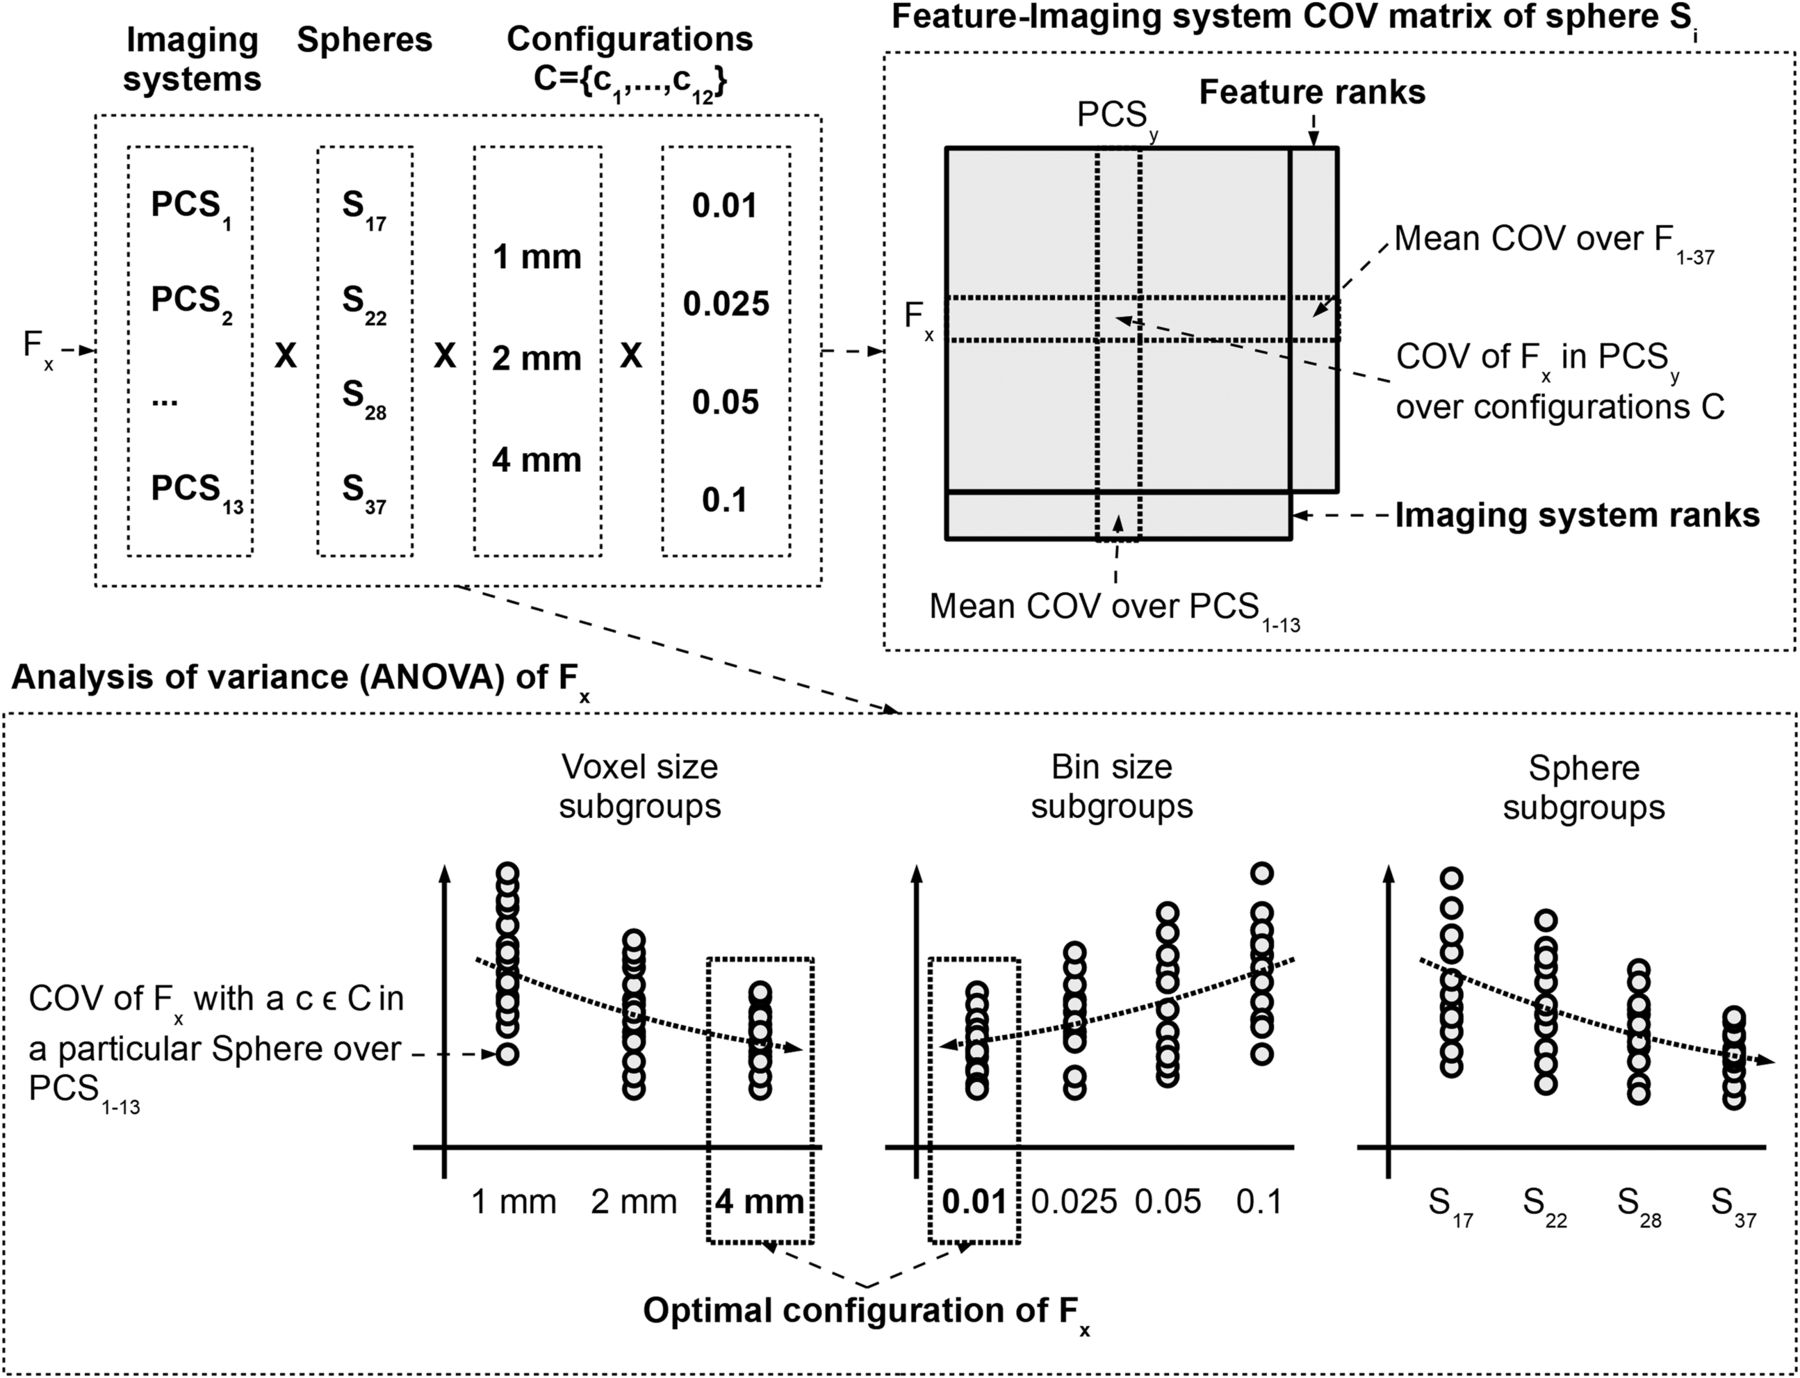
All 37 features and 13 PET/CT systems were ranked by a coefficient-of-variation (COV) analysis (39,40), where COV describes the SD of samples divided by their mean.
For each feature–PET/CT system pair, an individual COV was calculated over the 12 configurations (C). This step was performed for all 4 spheres, thus resulting in 4 feature–PET/CT system COV matrices. The ranking of the features was calculated for each sphere/VOI as the average COV over all PET/CT systems. Similarly, the ranking of the PET/CT systems was calculated for each sphere/VOI as the average COV across the respective 37 features (Fig. 5).

Each feature (Fx) has 13 imaging system, 4 sphere, and 12 configuration (3 voxel size and 4 bin size) variants. Feature and imaging system ranks are performed from feature-imaging system COV matrices. Each sphere (Si) has its own COV matrix. Here, each matrix cell corresponds to COV of given feature Fx and PET/CT imaging system (PCSy) over different feature extraction configurations (C). ANOVA analysis builds on subgrouping of COVs over PCS variants, as acquired by particular configuration ( ) in particular spheres. Optimal voxel size and bin size parameters are selected for Fx that minimize COV across imaging systems.
Feature Dependency on Voxel Size, Bin Size, and Volume
To assess the dependency of the features on voxel size, bin size, and sphere volume together, the COV of each of the 37 features was calculated across the 13 imaging systems for each sphere size and each of the 12 configurations (C). This resulted in 48 (12 configurations × 4 spheres) COVs. The COVs were subsequently grouped according to (a) voxel size, (b) bin size, and (c) sphere volume (Table 3). For each set of subgroups (a, b, and c) a 1-way ANOVA (27,41) was performed and the corresponding P value was used as a measure of dependence.
Subgroups of COVs of Each Feature for 1-Way ANOVA
Feature Extraction Optimization
For each feature, the behavior of the COV changes in the 3 subgroups (a, b, and c) as a function of voxel size, bin size, and volume was assessed. To characterize the behavior trends, increasing, decreasing, inconsistent, and constant COV trend scenarios were considered. Last, the mean of S37–S17 multicenter COVs for each of the 12 feature extraction configurations (C) was calculated. The configuration resulting in the smallest mean COV of the given feature was chosen as the optimal parameter set for feature extraction (Fig. 5).
RESULTS
Feature and PET/CT System Ranking
Information correlation (gray-level cooccurrence matrix [GLCM]) and shape features were least sensitive to feature extraction parameter (C) changes, followed by sum entropy (GLCM) and correlation (GLCM). The features that were most sensitive to feature extraction parameters were contrast and difference variance (GLCM) and contrast (neighborhood gray-tone difference matrix [NGTDM]), followed by 4 gray-level zone size matrix (GLZSM) features (Table 4, Supplemental Tables 1–4).
Feature Ranks with Regard to Average Absolute COV for 4 Largest Spheres (S37–S17).
Table 5 summarizes the ranking of the 13 PET/CT imaging systems together with their standard imaging protocols (Table 1). The use of point-spread function modeling with a narrow gaussian postreconstruction filter (2–4 mm in full width at half maximum) together with large matrix sizes (192–256) led to higher imaging ranks for the individual PET/CT systems (Table 5). Imaging systems with time-of-flight capability did not generally rank higher. Likewise, the number of iterations, subsets, and time per bed position (Table 1) did not affect the imaging system ranks (Table 5). High-ranked imaging systems had lower background noise variation (Tables 1 and 5). In contrast, the low-ranked imaging systems represented no noticeable correlation with background noise variations, with the exception of the lowest-ranked system (PCS10), which had the largest background variability, 7.3% (Tables 1 and 5).
Imaging System (PCS) Protocol Parameter Ranks with Regard to Average Absolute COV for 4 Largest Spheres (S37–S17)
Feature Dependency on Voxel Size, Bin Size, and Volume
Features independent of the voxel size were mainly from the GLCM category (Table 2): for example, correlation, sum variance, and cluster prominence had P values of 1.0, 0.995, and 0.992, respectively. In contrast, features most sensitive toward changes in voxel size were maximum probability (GLCM), angular second moment (GLCM), and compactness (shape), with P values of less than 0.001 (Supplemental Table 5).
Features from the GLCM category such as correlation, contrast, and cluster shade (P ∼ 1) were independent of bin size, whereas GLZSM-based features were more dependent (Supplemental Table 6). Furthermore, large zone low gray emphasis (P = 0.79), large zone size emphasis (P = 0.48), and zone size percentage (P = 0.44) were less dependent on sphere volume. Dependencies on volume increased for GLCM features, such as cluster prominence, contrast, or sum variance, with P values near zero (Supplemental Table 7). Overall, the volume subgroup P values were considerably lower than P values of the voxel size and bin size subgroups (Supplemental Tables 5–7). Figure 6 shows an example of subgroup representation.
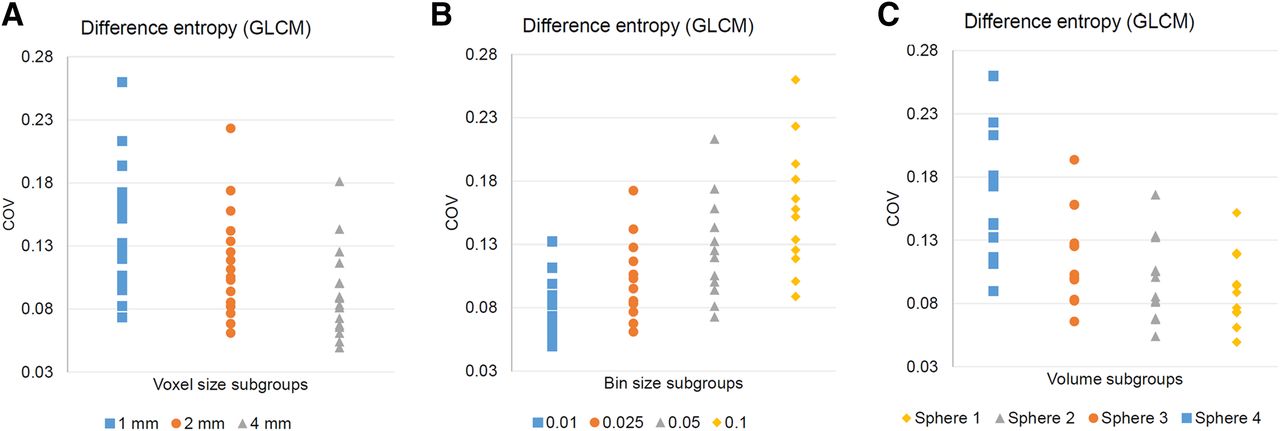
COV distributions of voxel size (A), bin size (B), and sphere volume (C) subgroups of feature difference entropy (GLCM). Each plotted sample corresponds to COV of given feature over PCS1–13 with particular voxel size, bin size, and sphere volume configuration. Spheres 1–4 correspond to spheres S37–S17, respectively. Based on trend analysis, difference entropy has optimized voxel size of 4 mm (decreasing trend in function of increasing voxel size), optimized bin size of 0.01 (increasing trend in function of increasing bin size), and decreasing trend in function of decreasing volume.
Feature Extraction Optimization
After the use of optimized feature extraction parameters, only 7 features resulted in small COVs (<5%), whereas 3, 3, and 27 were in the moderate (5% ≤ COV < 10%), elevated (10% ≤ COV < 20%), and large (COV ≥ 20%) categories, respectively (Table 6).
Features with Their Sphere S37–S17 COVs (Mean ± SD), Optimal Voxel Size, Optimal Bin Size, and Resultant Optimized COV Across Imaging Systems
DISCUSSION
Quantitative radiomics analysis is challenged in multiple ways (20,42). In this study, we presented a holistic approach for analyzing and optimizing the process of feature extraction. By using a standard image-quality phantom, we ranked 37 popular radiomic features and 13 PET/CT imaging systems with regard to their stability. The imaging system ranks (Table 5) indicate that the influence of using point-spread function, a narrow gaussian postprocessing filter, and a large matrix has a larger impact on radiomics variations than the type of image reconstruction algorithm. Furthermore, we were able to demonstrate that multicenter feature variations can be minimized by preselecting feature-specific individual voxel size and bin size parameters based on their COV trends (Supplemental Tables 5–7; Table 6). With our feature optimization approach, 7 of our investigated features had a COV of less than 5%, and 3 of them had a COV of less than 10%. Without optimization, only one feature had a COV of less than 5%, and 4 had a COV of less than 10% (Table 6). The ANOVA subgroup analysis revealed that lesion volume was the most contributing factor in feature variations compared with voxel size and bin size changes (Supplemental Tables 5–7). Nevertheless, the multicentric variations of radiomic features generally vary as a function of activity distribution in the lesions. Furthermore, partial-volume effects (15,43,44) inherently increase heterogeneity in smaller lesions as well.
The clinical implications of our results are manifold. Since we involved 13 imaging systems applying clinical standard protocols, our trend analysis tables (Supplemental Tables 5–7) can serve as general lookup tables to understand the behavior of radiomic features as a function of voxel size, bin size, and volume changes. This information supports researchers in building more stable radiomic models in their studies. Although our results are based on tumor-to-background ratios, the fixed bin size approach preserved relative value range differences in our lesions; thus, our results are applicable to PET SUV units as well. With the help of our optimized COV table (Table 6), researchers can identify robust, reproducible features, whereas our imaging system ranks (Table 5) support imaging specialists in establishing new, radiomics-conforming PET acquisition protocols. In general, reducing feature variability supports the notion of standardizing the computation of radiomic features through standardized image processing, as suggested by the Image Biomarker Standardisation Initiative consortium (42). Accordingly, we consider our report a potential amendment to the Image Biomarker Standardisation Initiative guidelines.
To date, a wide range of studies have focused on the multicenter analysis of radiomic feature repeatability in PET (20,28,45–47). Fried et al. assessed the robustness of PET-based radiomic features when image reconstruction settings were varied across 3 PET/CT systems in lung cancer versus image-quality phantom acquisitions (48). Features that were reported as “reasonably robust” were contrast (GLCM), energy (GLCM), SD, and uniformity. In our study, contrast GLCM was one of the least reproducible feature (56% COV) even with optimized parameters (Table 6). However, Fried et al. involved 3 imaging systems only with variable reconstruction parameters and they did not incorporate different bin sizes in their analysis. Last, their textural feature equations are unknown; thus, differences in calculations may be present (18). Similarly, Yan et al. (23) investigated the variation in 55 textural features in light of different image reconstruction parameters in 20 lung cancer patients after 18F-FDG PET/CT imaging. They reported inverse difference and low gray-level zone emphasis as robust features, whereas skewness, cluster shade, and zone percentage were the least robust (COV > 20%). In our study, we found similar results for cluster shade and zone percentage (COV > 20%). However, inverse difference moment (29.8% COV) and low gray-level zone emphasis (49.7% COV) were both highly variable. We consider 2 reasons for these discrepancies: first, Yan et al. applied a different delineation method, and second, they used a fixed number of bins (32, 64, and 128), whereas we used fixed bin sizes (36). In another study by Orlhac et al., 6 textural features were investigated in simulated and real patient data, including 10 sphere models with different activity distributions and 54 breast cancer PET/CT patients (12). The authors showed that all textural features were sensitive to voxel size differences (≤86%) and edge effects (≥29%). Our study confirmed that voxel size differences affect all features except GLCM correlation (Table 6). Shiri et al. (24) investigated variations in different intensity and radiomic features in 2 PET/CT systems using phantom acquisitions. Most textural features were reported to be sensitive (COV > 20%) with regard to voxel size changes, which we reconfirmed for features present in both studies (Supplemental Tables 5 and 6).
Lu et al. investigated the impact of delineation and binning methods including 40 18F-FDG patient studies, 5 delineation methods, and 88 features (29). Half the features depicted a higher intraclass correlation coefficient (≥0.8) with respect to segmentation, whereas 23% of features showed an intraclass correlation coefficient of at least 0.8 with regard to binning. Even though we did not compare different segmentation methods, our study reconfirmed that binning affects all textural features (Supplemental Table 6). Desseroit et al. studied the repeatability of shape and textural features of both low-dose CT and PET by means of different binning methodologies in a multicenter cohort of 74 18F-FDG PET/CT lung cancer patients (31). On the basis of their variable number of bins, they reported that all GLZSM features were poorly reliable and that angular second moment GLCM, contrast GLCM, and contrast NGTDM were the least repeatable, which was reconfirmed by our results (Table 6).
Altazi et al. (32) investigated 79 radiomic feature variations in light of different segmentation, reconstruction, and binning parameters in 88 cervical cancer patients having 18F-FDG PET acquisitions. They reported inverse difference moment, entropy, difference entropy, and sum entropy (all GLCM) to be the most reproducible regarding binning variations, whereas none of the GLZSM and NGTDM features appeared to be reproducible. In our study, the above GLCM parameters were moderately reproducible as a function of binning variations (Supplemental Table 6), whereas GLZSM and NGTDM features were represented with lower reproducibility. Nevertheless, they used a fixed number of bins, which underestimates COV compared with the fixed bin size approach (31).
The effect of tumor size, image resolution, and noise levels in 66 18F-FDG PET radiomic features was investigated by van Velden et al. (22), who have shown that 37% and 73% of features were sensitive on resolution and volume changes, respectively. Our study reconfirmed that among voxel size, bin size, and volume changes, volume changes had the highest effect on feature variations (Supplemental Tables 5–7).
It currently appears more appropriate to follow a rigid methodologic approach toward sourcing robust and meaningful radiomic features (18). Our study addresses important quality factors in radiomics studies that relate to feature engineering. Specifically, we assessed the variability of popular radiomic features in light of clinically relevant combinations of quantification, image acquisition, and reconstruction settings (Table 1). As a result, we propose that radiomics studies should entail the dedicated selection of individual data processing configurations per feature, so that feature variations are minimized (Table 6). In general, a methodologic, high-quality approach to feature extraction should be preferred over reporting study-specific, fine-tuned performance results. In that regard, multicentric standardization efforts in compliance with responsible radiomics guidelines (20,42,49) should be promoted. Furthermore, we suggest that those features that had a high COV even after optimization should be normalized in the feature domain by methods such as ComBat, proposed by Orlhac et al. (17). Features that do not benefit from such approaches should be excluded from future studies. In the future, the selection of features that benefit from standardized feature extraction and feature normalization could contribute to the establishment of a type of “Radiomics NEMA” protocol in line with preestablished Image Biomarker Standardisation Initiative guidelines (42) that could represent one step toward the era of clinical radiomics.
CONCLUSION
Our results help in optimizing radiomics studies by selecting a priori features with known data acquisition and processing parameters that minimize individual feature variations. Our imaging system rank analysis aids imaging specialists in optimizing imaging protocol parameters to support repeatable radiomics analysis of 18F-FDG PET/CT images. By selecting robust features that are aligned with the above concept and by following a responsible radiomics workflow, we can support the establishment of standardized radiomics approaches in clinical studies.
DISCLOSURE
The phantom data acquisition was supported by a grant from the Austrian Society of Nuclear Medicine and Molecular Imaging. This study utilized cloud computing resources that were granted by the Microsoft Research project CRM:0740606. No other potential conflict of interest relevant to this article was reported.
Acknowledgments
We thank Markus Diemling and Kristin Papp (Hermes Medical Solutions, Sweden) for their support with the Hermes Hybrid 3D software workflow establishment and Albert Frömel (Microsoft Austria), Kenji Takeda (Microsoft Research), and Nicolas Sorger (Microsoft Austria) for their support with computational resources in the Microsoft Azure Cloud as part of the Microsoft Research Grant project CRM:0740606.
Footnotes
Published online Nov. 2, 2018.
- © 2019 by the Society of Nuclear Medicine and Molecular Imaging.
REFERENCES
- Received for publication July 13, 2018.
- Accepted for publication October 26, 2018.


Jump to section
Related Articles
Cited By...
- Improved Prognosis of Treatment Failure in Cervical Cancer with Nontumor PET/CT Radiomics
- Repeatability of 18F-FDG PET Radiomic Features in Cervical Cancer
- Radiomics Features of 18F-fluorodeoxyglucose Positron-Emission Tomography as a Novel Prognostic Signature in Colorectal Cancer
- Introduction to Radiomics
- Experimental Multicenter and Multivendor Evaluation of the Performance of PET Radiomic Features Using 3-Dimensionally Printed Phantom Inserts