


Abstract
Change in 18F-FDG uptake may predict response to anticancer treatment. The PERCIST suggest a threshold of 30% change in SUV to define partial response and progressive disease. Evidence underlying these thresholds consists of mixed stand-alone PET and PET/CT data with variable uptake intervals and no consensus on the number of lesions to be assessed. Additionally, there is increasing interest in alternative 18F-FDG uptake measures such as metabolically active tumor volume and total lesion glycolysis (TLG). The aim of this study was to comprehensively investigate the repeatability of various quantitative whole-body 18F-FDG metrics in non–small cell lung cancer (NSCLC) patients as a function of tracer uptake interval and lesion selection strategies. Methods: Eleven NSCLC patients, with at least 1 intrathoracic lesion 3 cm or greater, underwent double baseline whole-body 18F-FDG PET/CT scans at 60 and 90 min after injection within 3 d. All 18F-FDG–avid tumors were delineated with an 50% threshold of SUVpeak adapted for local background. SUVmax, SUVmean, SUVpeak, TLG, metabolically active tumor volume, and tumor-to-blood and -liver ratios were evaluated, as well as the influence of lesion selection and 2 methods for correction of uptake time differences. Results: The best repeatability was found using the SUV metrics of the averaged PERCIST target lesions (repeatability coefficients < 10%). The correlation between test and retest scans was strong for all uptake measures at either uptake interval (intraclass correlation coefficient > 0.97 and R2 > 0.98). There were no significant differences in repeatability between data obtained 60 and 90 min after injection. When only PERCIST-defined target lesions were included (n = 34), repeatability improved for all uptake values. Normalization to liver or blood uptake or glucose correction did not improve repeatability. However, after correction for uptake time the correlation of SUV measures and TLG between the 60- and 90-min data significantly improved without affecting test–retest performance. Conclusion: This study suggests that a 15% change of SUVmean/SUVpeak at 60 min after injection can be used to assess response in advanced NSCLC patients if up to 5 PERCIST target lesions are assessed. Lower thresholds could be used in averaged PERCIST target lesions (<10%).
FDG labeled with 18F is widely used as a diagnostic or prognostic tool in oncology, but its role as biomarker of response to cancer therapy is less well established (1–5). Evaluation of response using PET can be performed visually (e.g., International Conference on Malignant Lymphoma taxonomy in malignant lymphoma (6)) or semiquantitatively (2). For the latter, the proposed PERCIST suggest a threshold of 30% change in SUV (combined with a minimal absolute change) to define either partial response or progressive disease (3). Evidence underlying these thresholds consists of mixed test–retest data from stand-alone PET and PET/CT scanners, with variable uptake intervals (3,7). To date, optimal tracer uptake time for response assessment is still a matter of debate (60 vs. 90 min after injection). Furthermore, traditionally most repeatability studies reported on solitary tumor measurements (7). Yet, thresholds for response evaluation should also apply to patients with multiple metastases. The PERCIST suggest measuring up to 5 lesions for response assessment; however, the impact of lesion selection strategies on repeatability requires further research.
More recently, 2 PET/CT studies performed in ovarian and non–small cell lung cancer (NSCLC) patients showed conflicting results on repeatability of SUV measurements (8,9). As discussed, only SUV metrics were assessed in these studies and the effect of normalization to blood or liver SUV has not been evaluated. This, however, could improve repeatability of the uptake metrics (10,11). Finally, there is an increasing interest in alternative 18F-FDG uptake measures, such as total lesion glycolysis (TLG) and metabolically active tumor volume (MATV) (3,12). There are only limited data on the test–retest performance of these uptake metrics, and influence of uptake time interval and lesion selection have not been investigated to our knowledge.
The aim of this study was therefore to comprehensively investigate the repeatability of various quantitative whole-body 18F-FDG uptake and volumetric measures in advanced NSCLC patients as a function of tracer uptake interval and lesion selection strategy. Furthermore, we evaluated 2 proposed methods to account for variable uptake intervals.
MATERIALS AND METHODS
Patients
Eleven NSCLC patients (7 men) with at least 1 intrathoracic lesion of 3 cm or greater in the largest diameter, who had not received chemotherapy in the past 4 wks and without known diabetes mellitus, were included between January 2013 and January 2015 by their pulmonary physician in the VU University Medical Center, Amsterdam, The Netherlands. Patients underwent double baseline whole-body 18F-FDG PET/CT scans at 60 and 90 min after injection. In total, 11 and 10 test–retest scans were obtained at 60 and 90 min after injection, respectively (1 patient did not undergo one 90-min scan because of back pain). There were no significant differences in patient preparation and PET acquisition between the test and retest scans (Table 1). This study was approved by the institutional review board and was registered in the Dutch trial register (trialregister.nl, NTR3508). Written informed consent for all subjects was obtained before study enrolment.
Descriptive Statistics of Study Population
PET Imaging
All PET scans were obtained using a Gemini TF PET/CT scanner (Philips Healthcare). Scans were obtained and reconstructed following the guideline recommendations of the European Association of Nuclear Medicine (13). Patients were asked to fast at least 6 h before the PET scan, and blood glucose levels were measured twice before tracer injection to correct for measurement errors. Patients underwent a low-dose CT during tidal breathing for attenuation correction, followed by a whole-body 18F-FDG PET/CT scan (skull vertex to mid thigh) 60 min after injection at 2 min per bed position. Ninety minutes after injection, a second whole-body PET scan was acquired, followed by a second low-dose CT for attenuation correction. This procedure was repeated within 3 d after the first scan. Weight, height, total injected activity, time of injection, residual activity, and exact scan start time of both time points were recorded for each session.
Data Analysis
Volumes of interest (VOIs) were generated by delineating 18F-FDG–avid tumors using a 50% threshold of SUVpeak adapted for local background (in-house–developed software). Details on this method were published previously (12). Tumors were selected by a nuclear physician. For each VOI, SUVmax, SUVmean, SUVpeak (1.2 cm3 spheric region positioned to maximize its mean value), MATV (50% threshold of SUVpeak corrected for local background), TLG (product of SUVmean and MATV), and tumor-to-blood and tumor-to-liver ratios were determined. The SUVmean of a VOI placed in the ascending aorta (3.3 mL) and liver (14 mL) were used for normalization to blood and liver uptake. SUVs were corrected for lean body mass using the James formula (13), and all uptake measures were assessed with and without glucose correction.
We applied 2 methods for correction of uptake metrics for uptake time differences as described by van den Hoff et al. (14). The first corrects the 90-min data to 60 min by estimating the 60-min SUVs using Eq. 1with
 Eq. 2Here SUR represents the tumor-to-blood uptake value and VR the apparent volume of distribution, which was set to 0.53, and the time exponent b was set to 0.313 according to van den Hoff et al. We also determined exponent b for our study population using the group-averaged blood activity resulting in a b value of 0.5. The second method to correct SUV for uptake time is based on the rule of thumb that SUR0/SURT ≈ (T0/T) resulting in
 Eq. 3
Eq. 3
Statistical Analysis
We determined repeatability by calculating the mean and SD of the absolute and percentage differences between the test and retest scan. Percentage difference was calculated as Eq. 4The reproducibility coefficient (RC) was calculated as 1.96 × SD of the percentage and absolute differences for all uptake metrics at both time points. Normality was assessed using a quantile–quantile plot and histogram analyses. A paired t test was used to test for significant differences in mean uptake between the test and retest scan, and the Levene’s test was performed to investigate whether differences in RC were significant. Additionally, linear regression analyses, intraclass correlation coefficient, and Bland–Altman plots were used to evaluate repeatability.
Repeatability of SUV metrics, MATV, and TLG were evaluated as a function of uptake interval, glucose correction, and normalization procedures for SUV metrics (tumor-to-blood and tumor-to-liver ratios). Various lesion selection strategies were applied, and their effect on repeatability was evaluated: all lesions, lung tumors, the lesion with the highest uptake per scan, lesions greater than 4.2 mL (diameter, >2 cm), PERCIST target lesions (3), and averaged PERCIST target lesions. PERCIST target lesions are the 5 hottest lesions with a maximum of 2 per organ and an SUVmax of greater than 1.5 × mean liver SUV + 2SDs per patient. The uptake values of individual PERCIST target lesions were averaged per patient to obtain the averaged PERCIST target lesions. Finally, the effect of correction for uptake time was assessed. Statistical analyses were performed using SPSS software (SPSS).
RESULTS
Repeatability of Uptake Metrics
Test–retest variability was analyzed in 9 NSCLC patients (stage IV) with a total of 60 lesions (Table 1). Two patients were excluded from the analysis, one because no retest scan at 90 min was obtained and the second because of movement during the retest scan at 60 min (mean difference for all uptake measures > 2 SDs). Data including the latter patient are shown in the supplemental materials (available at http://jnm.snmjournals.org).
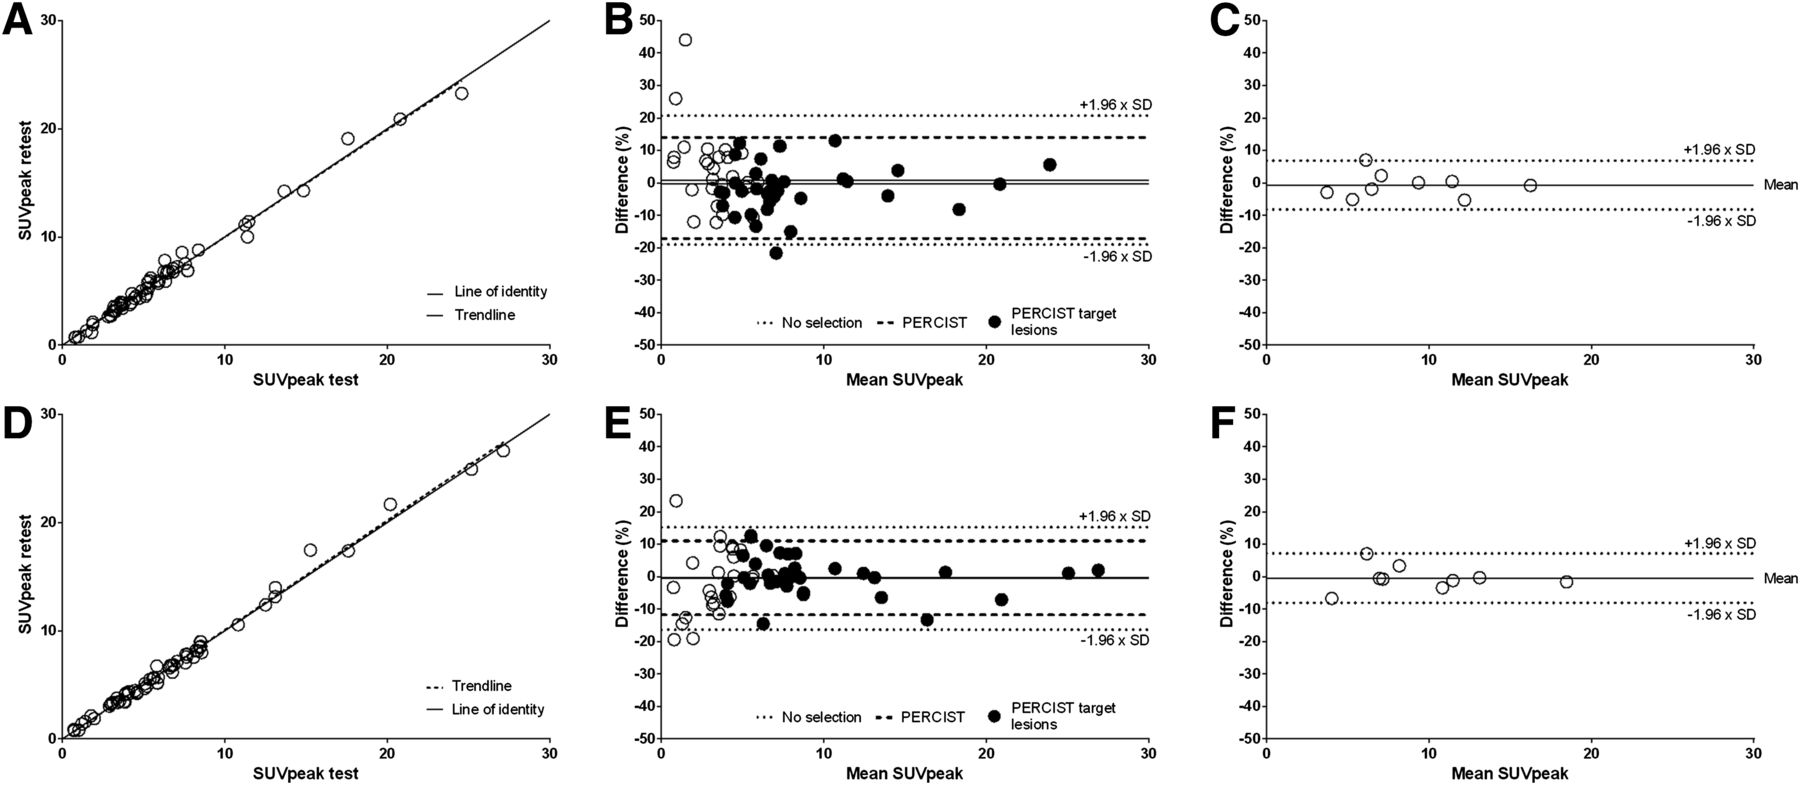
Test SUV, TLG, and MATV values were plotted against their equivalent retest counterparts. Correlations between the test and retest scans were strong for all uptake measures (intraclass correlation coefficient > 0.98; confidence interval, 0.97–1.00; and R2 > 0.97) (Fig. 1; Table 2). SUVmean and SUVpeak showed best test–retest performance. Variability of these SUV measures were not significantly different for the 60- and 90-min datasets (RCs, 19.9%–26.6% and 15.8%–23.3%, respectively) (Fig. 2; Table 3). RCs of the absolute differences ranged from 0.8 for SUVmean to 1.6 for SUVmax in the 60-min data and from 0.9 to 2.1 in the 90-min data. Furthermore, Bland–Altman plots showed a correlation between the relative variability and SUV (Fig. 1); however, no correlation was found for the absolute RC.

SUVpeak values of test scan plotted against those of retest scan (A and D), corresponding Bland–Altman plots for all lesions (B and E), and for averaged PERCIST target lesions per patient (C and F) are shown. Upper and lower plots represent 60-min data (A–C) and 90-min data (D–F), respectively. B and E also show influence of PERCIST lesion selection criteria on repeatability. PERCIST target lesions = 5 hottest lesions per patient; maximum 2 per organ; SUVmax > 1.5 × mean liver SUV + 2 SDs.
Descriptive Statistics of Uptake Measures for Several Tissues

Box plots of percentage differences between test and retest scans as obtained from 60- (dark) and 90- (light) min data. Effect of lesion selection and averaging on different 18F-FDG uptake metrics is shown.
Mean Relative Differences and RCs for Several Uptake Metrics and Influence of Different Uptake Times and Lesion Selection
TLG and MATV showed a higher test–retest variability than SUV metrics. In the 60- and 90-min groups, absolute RCs of MATV were 10.8 and 8.6, respectively. Even though MATV obtained from VOIs, based on a relative threshold of SUVpeak, might depend on SUV measures itself, MATV proved not to be correlated to SUV. When repeatability of TLG was assessed, absolute RCs of 62.4 and 38.2 were found in the 60- and 90-min data. These results cannot be directly compared with SUV measures, considering that TLG and MATV have higher values. The absolute and relative differences between the 60- and 90-min data were also plotted in a Bland–Altman plot and showed no skewing for any of the uptake metrics.
Lesion Selection
Including only PERCIST target lesions (n = 34) improved repeatability both for the 60- and for the 90-min scans (range, 13.8%–15.8% and 11.4%–16.0%, respectively) as compared with inclusion of all 18F-FDG–avid lesions. These results further improved using the average SUVmax, SUVmean, and SUVpeak value of the PERCIST target lesions within 1 patient (Fig. 2; Table 3). When we considered only PERCIST target lesions, RCs of the absolute differences slightly increased (<0.3) but did not exceed 2.3. For averaged PERCIST target lesions, RCs decreased and ranged from 0.8 to 1.3 for the 60-min and from 0.4 to 1.2 for the 90-min data. Repeatability remained worse in MATV and TLG when only PERCIST target lesions were evaluated. In the 60- and 90-min data, RCs of MATV for PERCIST target lesions equaled 14.2 and 11.3 mL. For TLG, we found RCs of 82.9 and 50.8 for the 60- and 90-min data, respectively.
If only lesions showing the highest uptake were included in the analysis, results equaled the averaged PERCIST data and were not influenced by the outlier. Test–retest variability obtained for lung lesions and lesions greater than 4.2 mL was similar to those of PERCIST target lesions. Moreover, both intra- and extrathoracic lesions were included, and no differences in repeatability were found depending on tumor location.
Normalization to Blood or Liver Uptake and Glucose Correction
Hepatic 18F-FDG uptake was independent of uptake interval and showed low interscan variability between the test and retest scan (median, 0.01; interquartile range, 0.09). Normalization of SUV to liver uptake did not affect repeatability for any of the uptake measures and times. Normalization to blood uptake did not influence repeatability for the 60-min uptake time, but in the 90-min data RCs increased from 17.1% ± 4.0% to 29.6% ± 3.0. Furthermore, plasma glucose correction adversely affected repeatability at both time points.
Uptake Time Correction
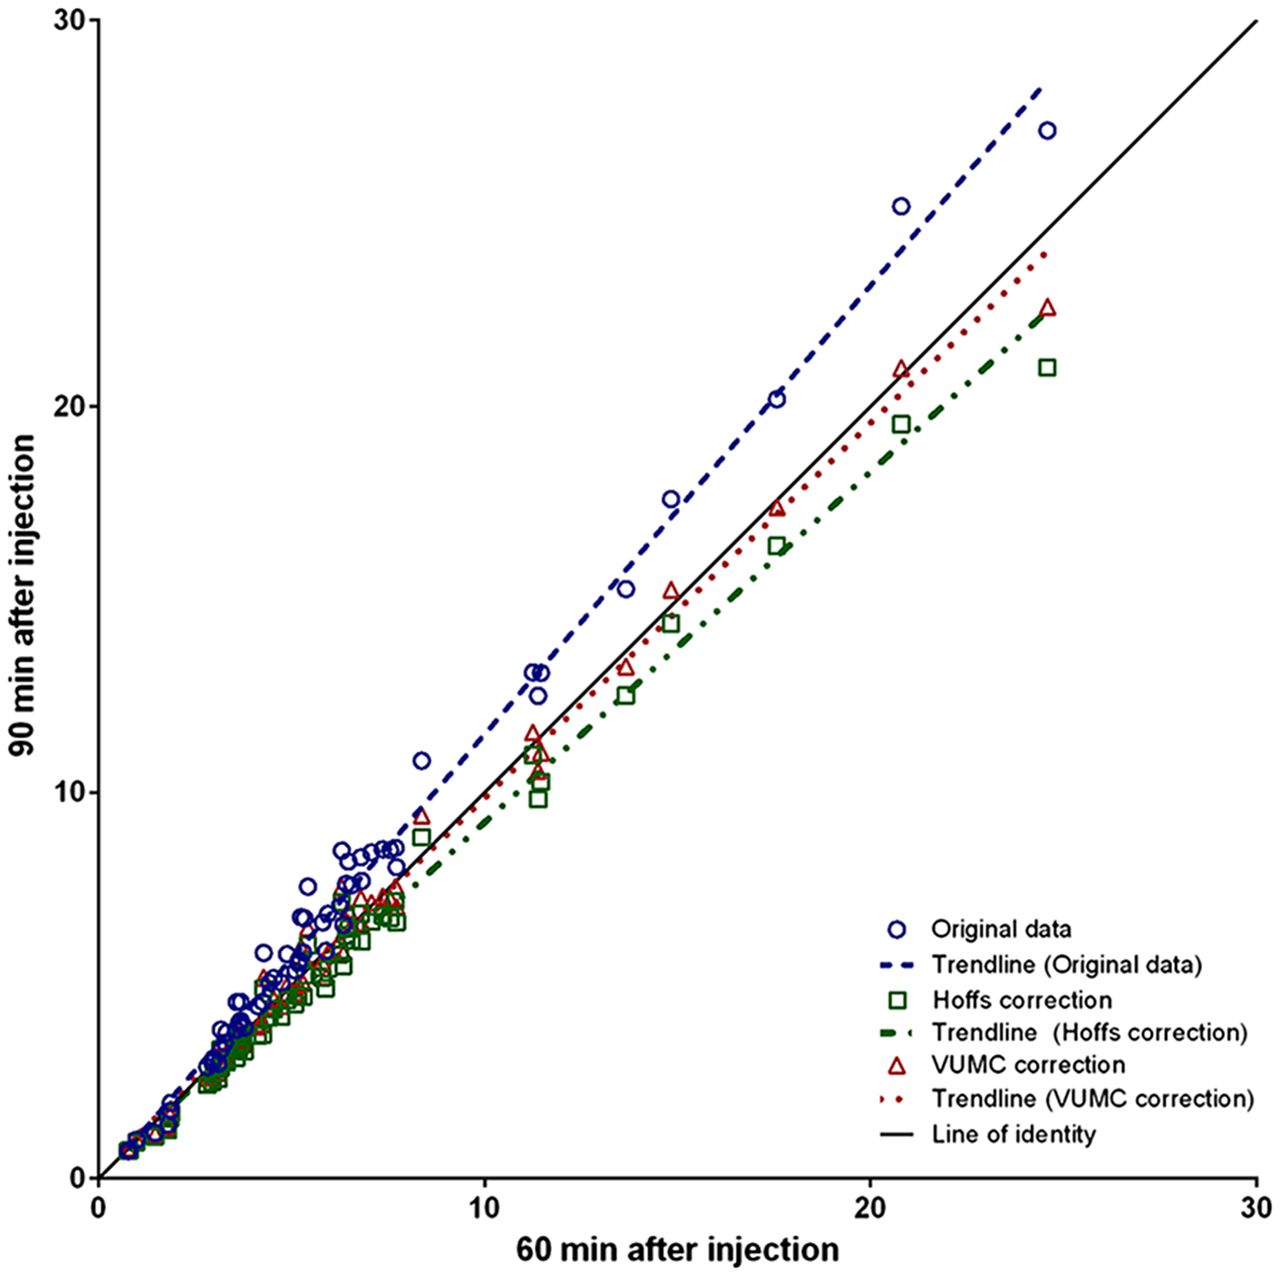
With the exception of MATV, longer uptake intervals were associated with higher uptake values for both the test and the retest data (mean difference range, 8.2%–15.0%) (Fig. 3). Application of the van den Hoff et al. uptake interval correction method significantly decreased mean differences between the test 60-min and retest 90-min data for all uptake measures. The 90-min data estimated to 60 min using Equation 2 correlated better with the 60-min data than those using the rule of thumb (Eq. 3). However, mean differences remained more than 5% and were significant. After the b value was adjusted to 0.5, correlation further improved and the estimated values no longer differed from the 60-min SUVmean and SUVpeak data regardless of the lesions included (Fig. 4). RCs of the percentage difference between the 60-min data and the 90-min data corrected to 60 min were similar to those of corresponding uptake metrics described above.
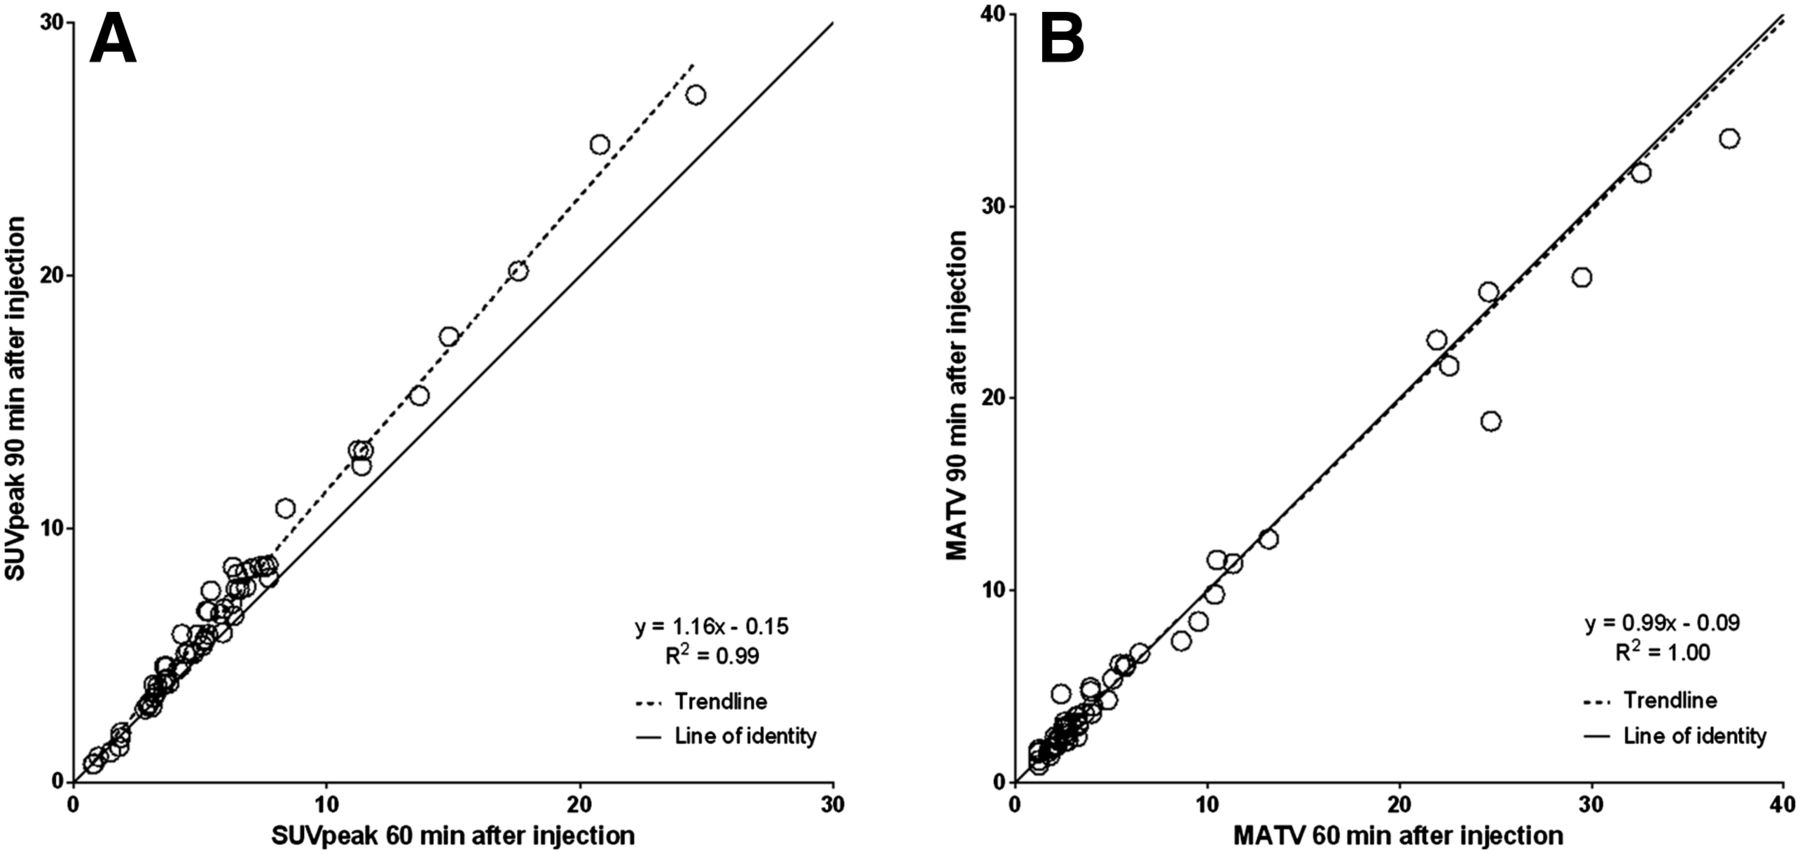
SUVpeak (A) and MATV (B) values of data obtained 60 min after injection plotted against data obtained 90 min after injection.

Different uptake time corrections applied on SUVpeak of 90-min data plotted against 60-min data of the test scan.
DISCUSSION
In this study, repeatability of SUV metrics was superior to TLG and MATV, and after PERCIST lesion selection criteria were applied RCs improved to less than 15%. We observed similar repeatability performance characteristics of several quantitative 18F-FDG uptake measures at 60 and 90 min after injection. The repeatability of 18F-FDG PET has previously been studied, but evidence underlying proposed thresholds for response evaluation consists of mixed test–retest data from stand-alone PET and PET/CT scanners, with variable uptake intervals. Compared with the 25% and 30% thresholds suggested by the European Organization for Research and Treatment of Cancer and PERCIST, respectively (3,15), we found an improved repeatability for all SUV metrics. Our data are consistent with a study on 18F-FDG PET/CT in patients with recurrent ovarian carcinoma reporting RCs of 16.3% and 17.3% for SUVmean and SUVmax (8). In addition, similar results were observed in a meta-analysis of mainly intrathoracic lesions (7).
A recent multicenter study evaluated 18F-FDG PET/CT in 74 NSCLC patients accrued at 24 different sites (9). In contrast to the former studies, here a threshold of 28% decrease and 39% increase for SUVmax (32% decrease and 47% increase for SUVpeak) were found to reflect true therapeutic effects if per patient only 1 lesion greater than 2 cm with the highest SUVmax (>4 g/mL) was included. These results are comparable to those shown in a multicenter study performed by Velasquez et al. (16), suggesting that the repeatability of 18F-FDG PET might be more limited in a multicenter setting. In this current study, we performed 18F-FDG PET/CT scans strictly; this might be more difficult in a multicenter setting and could result in an accumulation of small errors, which could affect test–retest performance. Additionally, differences in VOI definition of SUVpeak in our study versus those published elsewhere could partly explain reported differences in repeatability (17). In contrast to our study, in which we positioned a 1.2 cm3 spheric VOI within tumor borders defined by a 50% isocontour to obtain the highest peak value, Weber et al. (9) placed a 1.5-cm-diameter cylindric VOI in 3 consecutive axial slices over the voxel with the maximum uptake and the report did not specify whether a tumor border was defined. Therefore, there is a risk that nonmalignant tissue is considered when the maximum voxel is located near the edge of the tumor, and repeatability could be seriously affected by the variable location of the maximum voxel, which is susceptible to noise (18,19). Furthermore, they assessed differences between test and retest scans after averaging all lesions in individual patients, because this may have a better correlation with patient outcome (9). Contrary to our results, no improvement in repeatability was found. Yet, improvement of variability would be expected if no systematic difference between both baseline scans exists, because differences would be reduced by averaging the data.
Change in MATV has been shown to predict pathologic response in breast cancer after 2 cycles of chemotherapy, but few studies have assessed the repeatability of this parameter (20–22). The repeatability of MATV was better in our study than in studies published by Frings et al. (22) in NSCLC patients and Hatt et al. (20) in esophageal cancer patients. These discrepancies are most likely explained by differences in uptake time (45 vs. 60 min after injection) and VOI definition, respectively. TLG has properties similar to MATV and showed similar repeatability yet was influenced by uptake time. Two other studies investigated TLG repeatability in liver metastases and found RCs of 31.2 because (23,24). The differences may partly be explained by differences in tumor type because liver metastases tend to be more irregular than lung lesions, and repeatability could be affected by higher background activity of the liver. Moreover, VOIs were delineated using a 41% (24) and 50% (23) isocontour corrected for local background based on SUVmax, which could influence repeatability. Whether changes in 18F-FDG uptake metrics beyond the repeatability confidence intervals presented here also reflect sufficient clinical response remains to be shown.
Normalization to Blood or Liver Uptake and Glucose Correction
Glucose correction deteriorated the test–retest performance in our study. Serum glucose levels were all within reference range and showed limited variability between the test and retest scan (<2.2 mmol/L). Including this additional variable in the calculation of 18F-FDG uptake metrics increases uncertainty and suggests that glucose correction should not be used when glucose levels are within reference range. Furthermore, we normalized SUV measures to liver and blood uptake to correct for inaccuracies in dose calibration, weight and length measurements, and variations of tracer supply to the tumor (3,25). There was only little variability in the liver uptake between scans (1% ± 4%), yielding no improvement of repeatability. The same applies for the tumor-to-blood ratios in the 60-min data in contrast to expectations of van den Hoff et al. (10). Moreover, normalization to blood increased variability in the 90-min data, which might be explained by low count statistics (higher sensitivity to noise) of blood SUV at 90 min after injection.
Uptake Time Correction
Variation in uptake time has an important impact on the use of 18F-FDG PET/CT as an imaging biomarker. With the exception of MATV, we have shown that uptake at 90 min after injection is significantly higher than uptake at 60 min after injection and therefore supports the importance of timely procedures when quantitative measures are required. However, this can be difficult in clinical practice as shown in a study reporting a mean difference in uptake time of 33 ± 19 min (26), underling the need for methods to correct SUV for uptake time. In our study, we have chosen to prospectively evaluate the methods presented by van den Hoff et al. because they are based on known 18F-FDG kinetics and therefore fundamentally attractive (14). Use of these methods improved correlation between the 60- and 90-min data, but adjustment of the b value was required to offset underestimation of the 90-min corrected SUV. This suggests that the original method presented for uptake time correction of SUV may not be directly applicable and requires (further) validation. Moreover, it would be interesting to assess the effects of using this method to the multicenter data presented by Weber et al. to see if multicenter repeatability improves when correcting for uptake time variations (9). The higher b value found in our dataset implies that the arterial input function decreases at a faster rate than that in data presented by van den Hoff et al. (14). This discrepancy might be explained by differences in patient preparation (e.g., longer fasting before the scan or better prehydration and therefore more excretion). Moreover, in our study patients were scanned at 2 separate days and could therefore be affected by physiologic differences, but this has to be further explored. Despite the need for (minor) adjustment of 1 of the parameters of the uptake time correction method, we found a good correspondence between 90- and 60-min-after-injection uptake metrics without affecting repeatability and therefore we propose further evaluation as a potential strategy to compensate for unwanted variability in uptake times during longitudinal studies.
The main limitation to this study is the relatively small sample size. Unfortunately, patient burden due to long scan time (±60 min), because of the 60- and 90-min acquisitions, limited the collection of large datasets. However, to our knowledge no other studies have assessed these issues in such a comprehensive study design. Ideally, large multicenter trials should confirm our results, but implementation of this protocol into a trial would significantly increase the patient burden and would be less feasible compared with a repeatability study at 1 time point only.
Second, we assessed only NSCLC patients, possibly limiting extrapolation to other tumor types. However, also extrathoracic lesions were included, and there were no differences in repeatability depending on tumor location.
CONCLUSION
The results of this prospective study suggest that if up to 5 PERCIST target lesions are included, a 15% change of SUVmean or SUVpeak reflects true metabolic response in patients with advanced NSCLC. If response is assessed using the averaged PERCIST target lesions, this threshold could even be set at a less than 10% change. No differences in test–retest performances were observed at 60 and 90 min after injection, and normalization to blood or liver uptake did not improve repeatability. Whether the thresholds found in this study are also valid in well-controlled multicenter studies remains to be shown.
DISCLOSURE
The costs of publication of this article were defrayed in part by the payment of page charges. Therefore, and solely to indicate this fact, this article is hereby marked “advertisement” in accordance with 18 USC section 1734. No potential conflict of interest relevant to this article was reported.
Footnotes
↵* Contributed equally to this work.
Published online Apr. 21, 2016.
- © 2016 by the Society of Nuclear Medicine and Molecular Imaging, Inc.
REFERENCES
- Received for publication November 23, 2015.
- Accepted for publication March 14, 2016.


Jump to section
Related Articles
Cited By...
- Quantitative Assessments of Tumor Activity in a General Oncologic PET/CT Population: Which Metric Minimizes Tracer Uptake Time Dependence?
- Effects of Tracer Uptake Time in Non-Small Cell Lung Cancer 18F-FDG PET Radiomics
- Repeatability of 68Ga-PSMA-HBED-CC PET/CT-Derived Total Molecular Tumor Volume
- Quantification of Metastatic Prostate Cancer Whole-Body Tumor Burden with 18F-FDG PET Parameters and Associations with Overall Survival After First-Line Abiraterone or Enzalutamide: A Single-Center Retrospective Cohort Study
- Performance of Digital PET Compared with High-Resolution Conventional PET in Patients with Cancer
- Assessment of Simplified Methods for Quantification of 18F-FDHT Uptake in Patients with Metastatic Castration-Resistant Prostate Cancer
- Use of a Qualification Phantom for PET Brain Imaging in a Multicenter Consortium: A Collaboration Between the Pediatric Brain Tumor Consortium and the SNMMI Clinical Trials Network
- The Influence of Minimal Misalignment on the Repeatability of PET Images Examined by the Repositioning of Point Sources
- 18F-FDG PET/CT for Very Early Response Evaluation Predicts CT Response in Erlotinib-Treated Non-Small Cell Lung Cancer Patients: A Comparison of Assessment Methods
- Test-Retest Variability in Lesion SUV and Lesion SUR in 18F-FDG PET: An Analysis of Data from Two Prospective Multicenter Trials
- Reply: Repeatability of Quantitative Whole-Body 18F-FDG PET/CT Uptake Measures in Patients with Non-Small Cell Lung Cancer: Dynamic Versus Test-Retest Design
- Repeatability of Quantitative Whole-Body 18F-FDG PET/CT Uptake Measures in Patients with Non-Small Cell Lung Cancer: Dynamic Versus Test-Retest Design
- Need for Glucose Correction for 18F-FDG PET Influenced by Glucose Sensitivities to Types of Tissue and Random Factors
- Repeatability of SUV in Oncologic 18F-FDG PET