


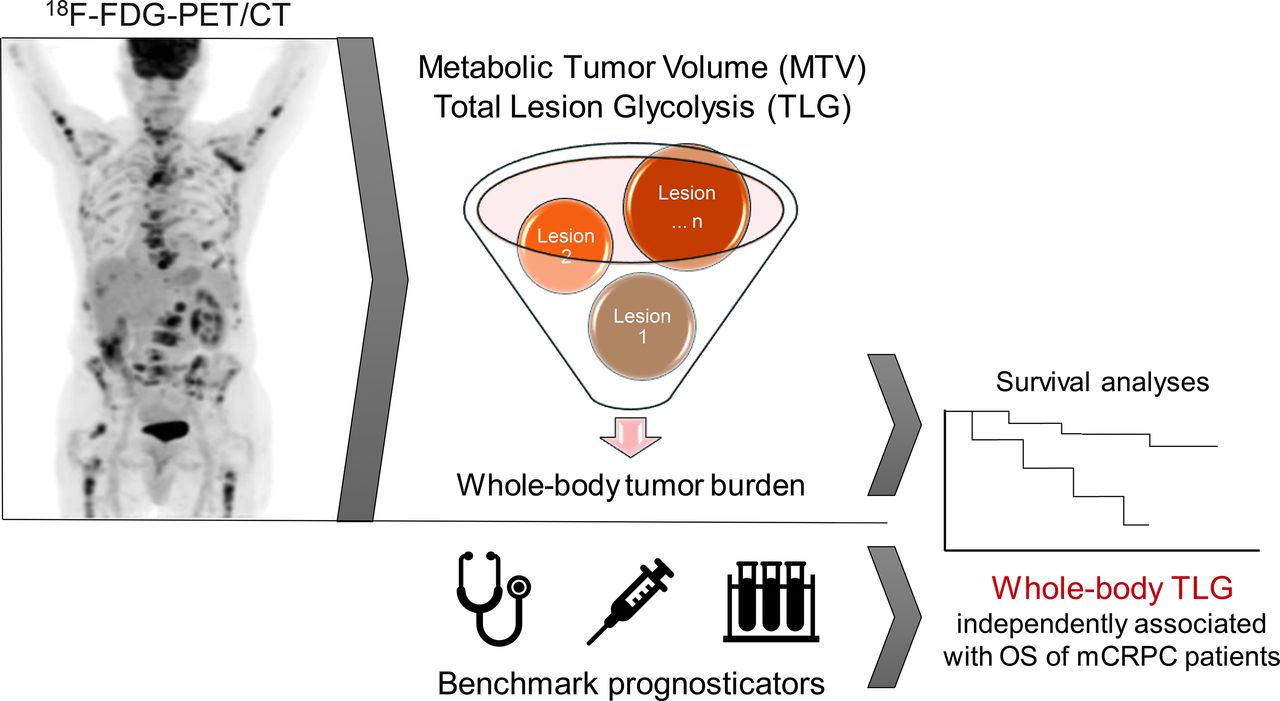
Visual Abstract

Abstract
New biomarkers for metastatic prostate cancer are needed. The aim of this study was to evaluate the prognostic value of 18F-FDG PET whole-body tumor burden parameters in patients with metastatic prostate cancer who received first-line abiraterone or enzalutamide therapy. Methods: This was a retrospective study of patients with metastatic castration-sensitive prostate cancer (mCSPC, n = 25) and metastatic castration-resistant prostate cancer (mCRPC, n = 71) who underwent 18F-FDG PET/CT within 90 d before first-line treatment with abiraterone or enzalutamide at a tertiary-care academic cancer center. Whole-body tumor burden on PET/CT was quantified as metabolic tumor volume (MTV) and total lesion glycolysis (TLG) and correlated with overall survival (OS) probabilities using Kaplan–Meier curves and Cox models. Results: The median follow-up in survivors was 56.3 mo (interquartile range, 37.7–66.8 mo); the median OSs for patients with mCRPC and mCSPC were 27.8 and 76.1 mo, respectively (P < 0.001). On univariate analysis, the OS probability of mCRPC patients was significantly associated with plasma levels of alkaline phosphatase (hazard ratio [HR], 1.90; P < 0.001), plasma levels of lactate dehydrogenase (HR, 1.01; P < 0.001), hemoglobin levels (HR, 0.80; P = 0.013), whole-body SUVmax (HR, 1.14; P < 0.001), the number of 18F-FDG–avid metastases (HR, 1.08; P < 0.001), whole-body metabolic tumor volume (HR, 1.86; P < 0.001), and TLG (HR, 1.84; P < 0.001). On multivariable analysis with stepwise variable selection, hemoglobin levels (HR, 0.81; P = 0.013) and whole-body TLG (HR, 1.88; P < 0.001) were independently associated with OS. In mCSPC patients, no significant association was observed between these variables and OS. Conclusion: In patients with mCRPC receiving first-line treatment with abiraterone or enzalutamide, 18F-FDG PET WB TLG is independently associated with OS and might be used as a quantitative prognostic imaging biomarker.
The availability of multiple life-prolonging therapeutic options for patients with metastatic prostate cancer (mPC) has increased the demand for biomarkers to deploy these agents for optimal patient benefit. The clinical course of patients with mPC is highly variable, and identifying individuals in need for treatment, selecting the appropriate management strategy, and assessing the treatment response remain challenging even for the most experienced oncologists. Patients’ symptoms, the dynamics of prostate-specific antigen levels, and radiographic disease progression are probably the most important decision drivers at present, but clearly more quantitative descriptors of tumor burden are needed in clinical practice and for clinical trials.
Conventional planar bone scintigraphy (bone scan) remains the mainstay for osseous tumor burden quantification in mPC in the United States. However, radiotracer accumulation in bone scans is not specific to metastases and may be seen in any type of bone-remodeling process, including benign entities such as degenerative joint disease. RECIST provide guidelines for size measurement of nonosseous tumors on CT and MRI (1) but do not address bone metastases without extraosseous components. The frequent bone tropism of prostate cancer thus limits their applicability in this population. Qualitative descriptors of bone metastases on CT or MRI by radiologists are subjective, are poorly reproducible, and do not qualify as quantitative biomarkers. Although MRI offers a range of quantitative metrics beyond tumor size that could theoretically be used as biomarkers (2), these measurements are susceptible to technical variations, and the lack of standardization challenges their practical utility (3). Another problem with CT and MRI is the limited ability to differentiate between metabolically active tumor and reactive peritumoral changes, such as osseous sclerosis. Because of all these shortcomings, Prostate Cancer Working Groups 2 and 3 advise assessing sites of disease independently and encourage the development of potential new biomarkers for mPC, including imaging-derived metrics (4).
18F-FDG PET/CT is a well-established, safe, and thoroughly studied imaging tool for a variety of malignancies. This tracer is Food and Drug Administration–approved for all types of malignancies and reimbursable under the current policy of the Centers for Medicare and Medicaid Services for a broad range of indications, which include “guidance of subsequent anti-tumor treatment strategy” for patients with mPC (5). Although 18F-FDG PET/CT has very limited clinical utility for staging of newly diagnosed prostate cancer (6) and for detection of biochemically recurrent disease (7), its potential in mPC patients is understudied. On the basis of prior observations that a considerable proportion of castration-resistant mPC lesions demonstrate 18F-FDG uptake and that the number of 18F-FDG–avid metastases and a greater intensity of tracer uptake are associated with poorer outcome in this population (8–10), we hypothesized that 18F-FDG PET/CT could be used as a quantitative measure of tumor burden in mPC on a whole-body scale. Therefore, we conducted retrospective survival analyses of mPC patients undergoing 18F-FDG PET/CT before first-line treatment with second-generation antiandrogens (i.e., abiraterone or enzalutamide).
MATERIALS AND METHODS
Study Cohort
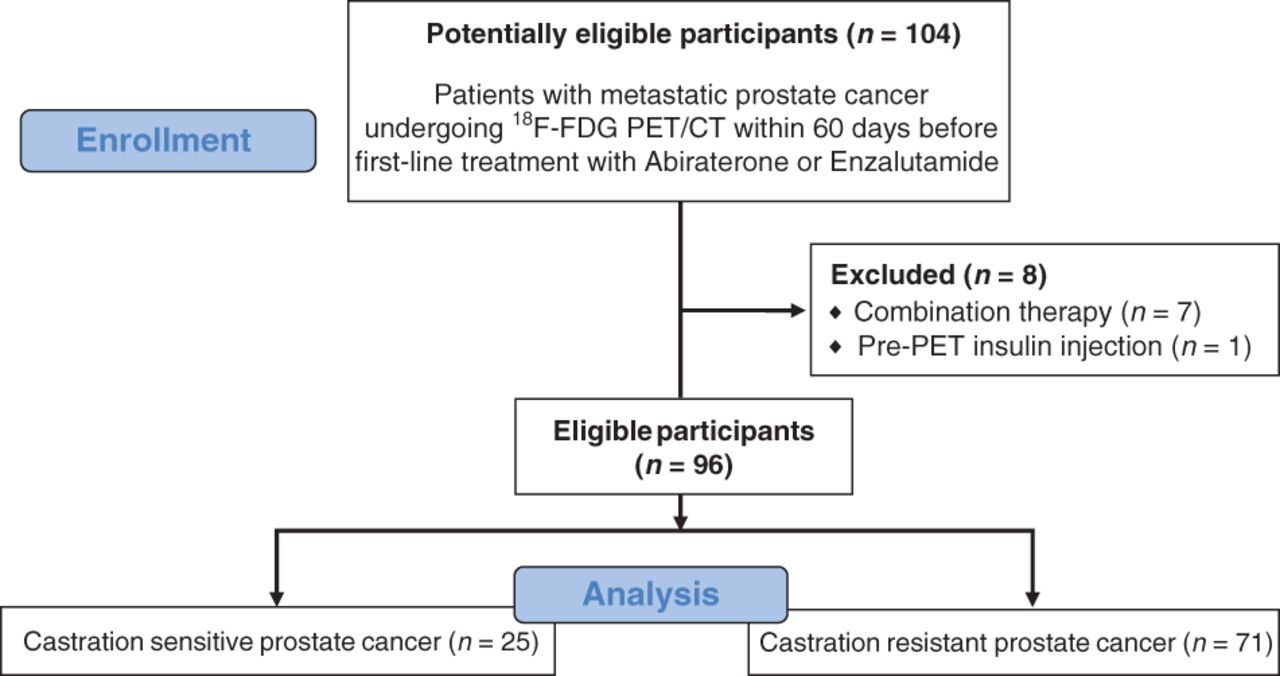
This was retrospective single-center cohort study of patients referred for evaluation of metastatic castration-resistant prostate cancer (mCRPC) and metastatic castration-sensitive prostate cancer (mCSPC) with 18F-FDG PET/CT by their treating subspecialized genitourinary oncologist at a tertiary-care academic cancer hospital between June 2009 and December 2016. The institutional review board approved this retrospective study, and the requirement to obtain informed consent was waived. Patients who underwent 18F-FDG PET/CT within 60 d before the initiation of first-line systemic therapy with either enzalutamide (Xtandi; Astellas Pharma Inc.) or abiraterone acetate plus prednisone (Zytiga; Janssen Biotech, Inc.) and no intervention between the PET scan and the start of therapy were considered eligible (n = 104). The clinical decision to treat with abiraterone or enzalutamide was made by the treating oncologist. Individuals who received abiraterone or enzalutamide in combination with taxane chemotherapy or an experimental drug, as well as those with diffuse intense 18F-FDG uptake in the skeletal muscles due to insulin injection before the PET scan, were excluded. The final study population consisted of 96 patients. A flowchart of the study cohort selection is provided in Figure 1.

Flowchart of study cohort selection.
Imaging Protocol and Analysis
18F-FDG PET/CT examinations were performed with a hybrid PET/CT scanner (Discovery; GE Healthcare) about 60 min after intravenous injection of approximately 370 MBq of 18F-FDG (obtained from IBA Molecular North America Inc. and calibrated by our in-house radiopharmacy). The radiotracer was administered after a minimum fasting interval of 4–6 h and only if the patient’s blood glucose level was less than 200 mg/dL. The field of view extended from the mid skull to the upper thighs. Low-dose CT was performed for anatomic correlation and attenuation correction (tube voltage, 120–140 kV; tube current, 80 mA; section thickness, 5 mm; reconstruction interval, 5 mm; pitch, 0.75–1.5). Oral but no intravenous contrast material was administered. Quantitative image analysis was performed by a board-certified oncologic and molecular imaging fellowship–trained radiologist on a dedicated workstation (PET VCAR [volume computer-assisted reading]; GE Healthcare). Volumes of interest were semiautomatically drawn for each metastatic lesion, defined as nonphysiologic tracer accumulation above mediastinal blood pool avidity. Areas of physiologic accumulation or excreted tracer (e.g., kidneys, urinary bladder, ureters, and urethra) were excluded from the volumes of interest. The following quantitative PET-derived metrics (11) were recorded separately for every cancer lesion: SUVmax (g/mL), defined as the ratio of a lesion’s highest radioactivity concentration measured by PET (kBq/mL) and the decay-corrected and body-weight–adjusted injected radiotracer activity (kBq/g); metabolic tumor volume (MTV [mL]), defined as the volume of tissue with an SUV of at least 41% of a lesion’s SUVmax (i.e., relative threshold), according to guidelines of the European Association of Nuclear Medicine (12); and total lesion glycolysis (TLG [g]), defined as the mass of 18F-FDG taken up within an MTV, calculated as the product of the MTV and its average SUV, according to these guidelines (12).
The MTV and TLG for all metastatic lesions were summated to generate the MTV and TLG for the whole body. Interreader reproducibility for these metrics was previously reported to be very high, with intraclass correlation coefficients consistently ranging above 0.9 (13–15) and the relative errors of repeated measurements ranging between 14.5% and 20.4% (16). However, these numbers might be less favorable for small tumors and depend on the applied segmentation method (17). A representative imaging example of our imaging analysis methodology is given in Figure 2.
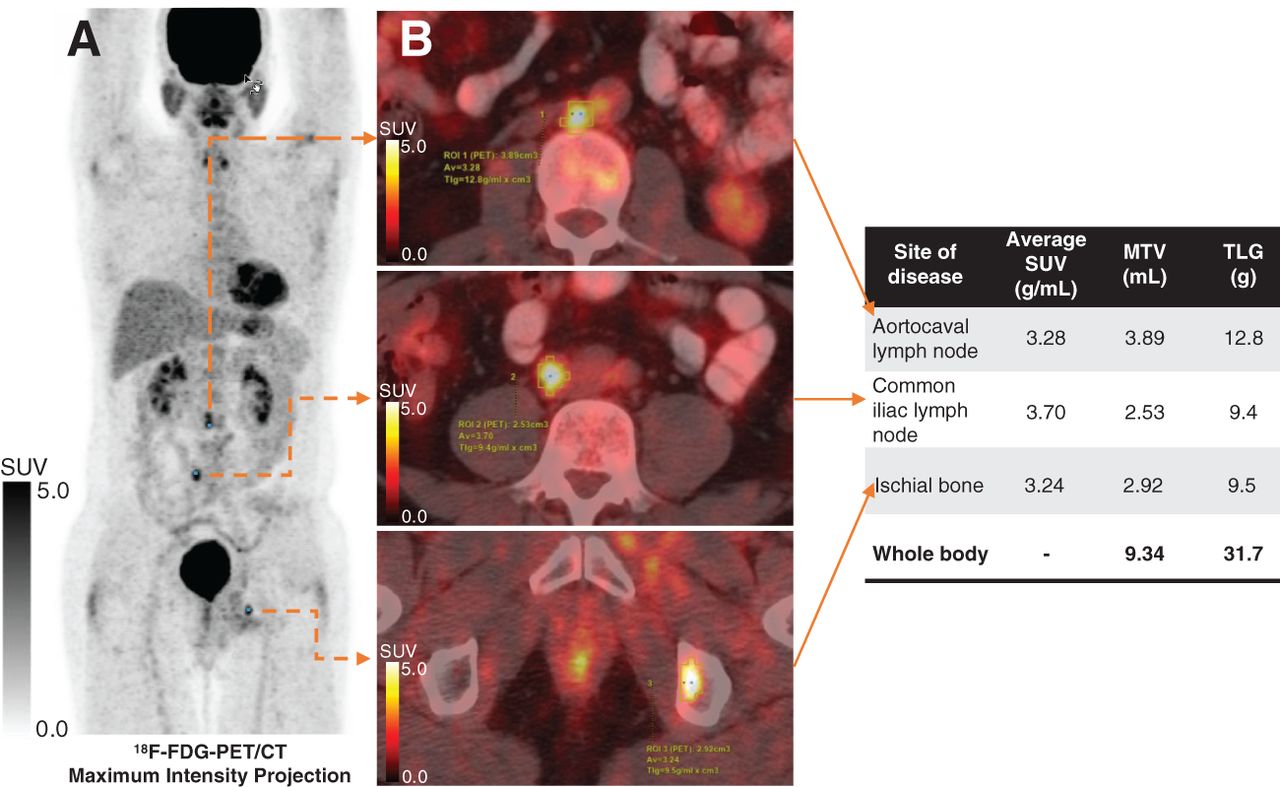
18F-FDG PET/CT of patient with mPC illustrating image analysis methodology of this study. Maximum-intensity projection (A) shows 18F-FDG–avid metastases in aortocaval lymph node (B, top), common iliac lymph node (B, middle), and ischial bone (B, bottom). For every 18F-FDG–avid metastasis, PET-derived metrics (i.e., MTV and TLG) were extracted and then summarized on whole-body scale for statistical analyses.
Endpoint
The endpoint of this study was overall survival (OS), defined as the interval from initiation of systemic treatment with enzalutamide or abiraterone to death from any cause. Observations from patients alive at the last follow-up were right-censored.
Statistical Methods
Cox proportional-hazards regression on univariable and multivariable analyses was used to examine associations between OS and clinical variables (i.e., age and therapy agent), laboratory parameters (i.e., prostate specific antigen, alkaline phosphatase, lactate dehydrogenase, and hemoglobin), and 18F-FDG PET/CT–derived metrics (i.e., SUVmax, number of 18F-FDG–avid metastases, whole-body MTV, and whole-body TLG) from the start of the treatment. Started with univariably important variables (P < 0.05), the multivariable model in the mCRPC group was built using stepwise variable-selection approach based on Wald test statistics. No multivariable analysis was performed for the mCSPC group, considering the small sample size. The logarithmic transformation was applied to alkaline phosphatase, prostate-specific antigen, MTV, and TLG. The Kaplan–Meier method was used to estimate OS in patient groups dichotomized at the median of whole-body TLG. Clinical characteristics, laboratory parameters, and imaging parameters were compared using the Fisher exact test and the Wilcoxon rank-sum test between patients with mCRPC and patients with mCSPC. All statistical analyses were performed in R, version 4.0.2 (R Foundation for Statistical Computing).
RESULTS
Of the 96 included individuals, 71 had mCRPC (71/96, 74.0%) and 25/96 (26.0%) had mCSPC. Fifty-seven patients (59.4%) received treatment with abiraterone plus prednisone, and 39 (40.6%) received enzalutamide; these frequencies did not differ significantly between mCRPC and mCSPC patients, as detailed in Table 1. At the time that treatment started, mCRPC patients were significantly older than mCSPC patients (P = 0.002), had higher levels of prostate-specific antigen (P = 0.016) and lactate dehydrogenase (P = 0.003), and had lower levels of albumin (P = 0.019) and hemoglobin (P < 0.001). On PET/CT, mCRPC patients had significantly more 18F-FDG–avid metastases than mCSPC patients (P = 0.018), but there was no significant difference in SUVmax between the 2 groups. Quantitative metrics of tumor burden on PET/CT were significantly higher in mCRPC patients, including whole-body MTV (P = 0.005) and whole-body TLG (P = 0.004). The median OS after the start of treatment was 39.7 mo (95% CI, 28.6–53.5), significantly shorter in mCRPC patients than in mCSPC patients (P < 0.001). At the last follow-up, 56 mCRPC and 8 mCSPC patients were deceased. The median follow-up in survivors after the start of treatment was 56.3 mo (interquartile range, 37.7–66.8), with no significant differences between mCRPC and mCSPC patients. These and additional descriptive statistics are detailed in Table 1. We did not observe significant differences in laboratory values, PET-derived metrics, or OS probabilities between patients treated with abiraterone and patients treated with enzalutamide in either the mCSPC or the mCRPC cohort.
Descriptive Statistics for Entire Study Cohort and Separately for mCRPC and mCSPC Patients
Survival Analyses
Castration-Resistant Disease
In patients with mCRPC, the median OS was 27.8 mo (95% CI, 22.1–39.7) and the 5-y OS probability was 17.6% (SE, 5.2%). On the univariate Cox-regression analyses of this subgroup, we observed significant associations of OS with laboratory parameters (i.e., alkaline phosphatase [hazard ratio (HR), 1.90; P < 0.001], hemoglobin [HR, 0.80; P = 0.013], and lactate dehydrogenase [HR, 1.005; P < 0.001]) and with all 18F-FDG PET/CT–derived metrics, that is, SUVmax (HR, 1.14), number of 18F-FDG–avid metastases (HR, 1.08), whole-body MTV (HR, 1.86), and whole-body TLG (HR, 1.84) (P < 0.001 for all), as detailed in Table 2. Kaplan–Meier curves of OS stratified by the median whole-body TLG are shown in Figure 3. In a multivariate Cox regression model, whole-body TLG (HR, 1.88; P < 0.001) and hemoglobin levels (HR, 0.81; P = 0.013) were significantly associated with OS in mCRPC patients (Table 2).
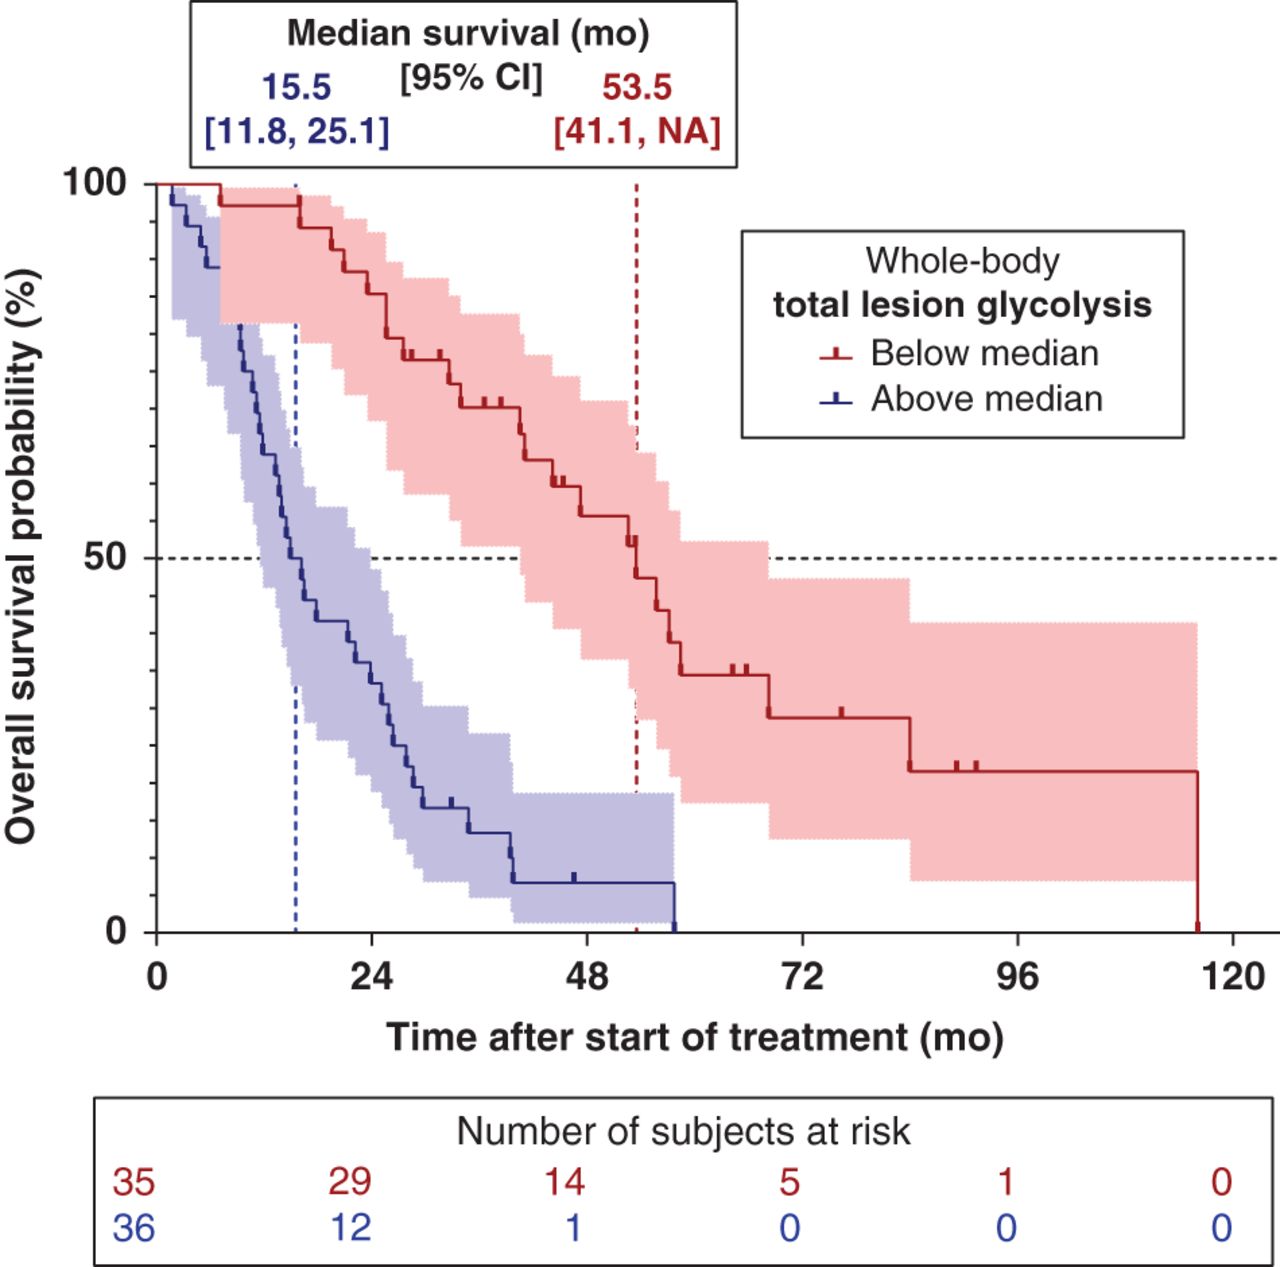
OS probabilities of patients with mCRPC after first-line treatment with abiraterone or enzalutamide, stratified by median whole-body TLG measured on 18F-FDG PET/CT. Sample size was too small for deriving reliable optimal cutoff TLG, and no statistical test was applied. Median OS times with 95% CI are provided.
Results of Cox Proportional Hazards Regression Analyses of OS Probability After Initiation of Abiraterone or Enzalutamide Therapy
Castration-Sensitive Disease
In patients with mCSPC, the median OS was 76.1 mo (95% CI, 50.3–N/A) and the 5-y survival probability was 72.8% (SE, 8.7%). In this subgroup, we observed an association between hemoglobin levels and OS, but this did not reach statistical significance (P = 0.065). None of the PET/CT-derived metrics were associated with OS in this subgroup on univariate analysis.
DISCUSSION
In this retrospective cohort study, we investigated the potential of 18F-FDG PET/CT for measuring the whole-body tumor burden of metabolically active mPC. In patients with mCRPC, we found significant associations between the OS probability and PET/CT-derived metrics (i.e., SUVmax, number of 18F-FDG–avid metastases, whole-body MTV, and TLG). We applied stepwise variable selection to account for collinearity and found that among the analyzed laboratory and PET-derived metrics, whole-body TLG and hemoglobin levels were independently associated with the OS probability. Whole-body TLG was more closely related to OS probability than were established laboratory biomarkers, including lactate dehydrogenase, which had been found to be the strongest predictor of OS probability in multiple previous studies, such as in a pooled analysis from 4 phase 3 clinical trials in first-line mCRPC (i.e., the ASCENT2, MAINSAIL, VENICE, and ENTHUSE 33 trials) (18). This finding indicates that 18F-FDG PET/CT–derived quantitative metrics are worthy of continued development as biomarkers for mCRPC patients. In patients with mCSPC, in contrast, we did not observe significant associations between tumor burden on 18F-FDG PET/CT and OS; however, the small number of patients with mCSPC in our study limits its statistical power and raises concerns about a possible type 2 error. This assumption is supported by the fact that we were not able to confirm previously proposed prognostic biomarkers in this population, including alkaline phosphatase and lactate dehydrogenase (19). Future studies with larger mCSPC cohorts are warranted to further explore potential roles of 18F-FDG PET/CT in this population.
Our study corroborates previous reports that indicated a potential utility of 18F-FDG PET/CT in patients with mPC. Jadvar et al., for example, found that in patients with mCSPC, more numerous and more intensely 18F-FDG–avid metastases were associated with a shorter interval to failure of hormonal treatment (20). The same group, in a prospective study on a cohort of mCRPC patients, found that the intensity of 18F-FDG uptake (i.e., the SUVmax) was associated with poorer OS (21). Our group made similar observations on mCRPC patients: the number of 18F-FDG–avid metastases (9) and the SUVmax (10) were associated with shorter survival. In all these studies, tumor burden was estimated semiquantitatively by lesion count, and metabolic cancer activity was quantified solely by the maximum lesional 18F-FDG uptake (i.e., SUVmax). Our current methodology gives a truly quantitative and more comprehensive measure of metabolically active tumor burden on a whole-body scale by integrating the tumor volume (i.e., MTV) and the intensity of 18F-FDG uptake (i.e., average SUV) in a single metric (i.e., TLG). Another methodologic difference between our and those previous studies lies in the cohort selection. We aimed to minimize potential confounders of patient survival and therefore restricted our analyses to individuals before the start of their first-line treatment with abiraterone or enzalutamide. In contrast to one of the above-cited studies (21), we excluded patients receiving first-line cytotoxic chemotherapy because this treatment is nowadays primarily given to patients with visceral metastases and a relatively poor prognosis. Including such patients would have made our study cohort more diverse, would have probably confounded our survival analyses, and would have limited the applicability of our results in contemporary patient cohorts. Second, we excluded patients with previous life-prolonging systemic cancer therapy because of the potential effects of prior treatments on cancer biology—effects that include lesional 18F-FDG avidity and possible downstream confounding of OS probability. In our opinion, this rigorous patient selection has minimized potential confounders for this proof-of-concept study and substantiates a direct association between tumor burden on 18F-FDG PET/CT and survival probability in mCRPC patients. This quantitative imaging biomarker could be used clinically to estimate a patient’s prognosis and help to define the best time to initiate systemic therapy. The association of whole-body TLG with OS probability also suggests that this metric might be useful for the assessment of treatment response, which would need to be studied in prospective trials with predefined posttherapy scan intervals.
The major limitation of this study was its retrospective design, including the possibility of selection bias on multiple levels. Most importantly, this cohort of patients undergoing 18F-FDG PET/CT represented only a subgroup of patients from our institution undergoing first-line abiraterone or enzalutamide treatment for mPC. The decision to order the PET/CT scan was made by the treating oncologist and was based on both medical and nonmedical considerations, including costs and insurance coverage. In addition to patient selection, some technical and methodologic factors deserve consideration when interpreting these results. First, the cutoff we used to calculate MTV and TLG was at least 41% of the SUVmax, in accordance with current guidelines (12). To the best of our knowledge, this cutoff has not been validated specifically in patients with mPC. We did not analyze SUVmean as a separate variable, because this metric is included in the calculation of TLG. Second, only 1 reader measured PET metrics, and we did not assess for interobserver reproducibility. Previously published reports found that for MTV and TLG, intraclass correlation coefficients range above 0.9 (13–15) and that relative measurement errors are expected to range between 15% and 20% (16). However, the variability might be higher for whole-body assessment of multiple lesions than for single-lesion measurements. Also, the manual lesion segmentation in this proof-of-concept study can be time-consuming and impractical during clinical routine, particularly in patients with multiple lesions. Automated segmentation algorithms based on artificial intelligence are already under development and clinical evaluation (22,23) and might help to minimize manual input and interobserver variability. Next, our study lacked modern benchmark prognostication tools, such as a bone scan index and circulating tumor cells or nucleic acid. Adding the availability of such tests to our inclusion criteria would have further decreased the number of eligible patients and prohibited meaningful statistical analyses. The sample size of our study was not large enough to derive a reliable cutoff whole-body TLG or to explore potential prognostic differences between nodal, osseous, and visceral tumor burden. Larger studies are needed to address these questions. The current study does, however, provide a strong justification for future studies to refine and evaluate 18F-FDG PET/CT–derived metrics and compare them to modern prognosticators. Because our study focused on individuals receiving first-line second-generation antiandrogens to minimize potential confounders of OS, our results cannot be directly translated to other treatment modalities, such as cytotoxic chemotherapy or targeted radioactive agents. Lastly, the reported outcomes are based on first-line therapy, and we did not account for subsequent anticancer therapies that could have changed the prognosis independently of the 18F-FDG PET/CT metrics at baseline.
CONCLUSION
We observed strong associations between 18F-FDG PET/CT–derived metrics of whole-body tumor burden and the OS probability of patients with mCRPC receiving first-line abiraterone or enzalutamide therapy. Whole-body TLG was independently associated with OS probability and is worthy of continued development as a biomarker in mCRPC patients.
DISCLOSURE
This work was supported in part through Cancer Center Support Grant P30 CA008748 from the NIH/NCI, through the Peter Michael Foundation, the Movember Foundation, and the Prostate Cancer Foundation. Hedvig Hricak has been a member of the board of directors of Ion Beam Applications (IBA), a medical technology company, since May 2017 and receives annual compensation for this role. Dr. Hricak also serves, without compensation, on the External Advisory Board, Sidney Kimmel Comprehensive Cancer Center, Johns Hopkins University; the International Advisory Board, University of Vienna; and the Scientific Committee and Board of Trustees, German Cancer Research Center (DKFZ). Howard I. Scher is a consultant or advisory board member for Ambry Genetics Corp., Amgen, Bayer, ESSA Pharma, Janssen Biotech, Janssen Research and Development, OncLive Insights, Menarini Silicon Biosystems, Physicians Education Resource, Pfizer, Sanofi Aventis, and WCG Oncology; has intellectual property rights in BioNTech, Elucida Oncology, MaBVAX, and Y-mAbs Therapeutics, Inc.; and has received institutional research funding from Epic Sciences, Illumina, Janssen Diagnostics, Menarini Silicon Biosystems, and ThermoFisher. No other potential conflict of interest relevant to this article was reported.
KEY POINTS
QUESTION: In patients with mPC, can 18F-FDG PET/CT provide functional quantitative measures of whole-body tumor burden?
PERTINENT FINDINGS: In a cohort study of 71 patients undergoing first-line treatment of mCRPC with second-generation antiandrogens, a PET/CT-derived whole-body imaging biomarker that integrates tumor volume and the cancer’s metabolic activity (i.e., TLG) was strongly associated with OS. Such associations were not observed in a cohort of 25 patients with castration-sensitive disease.
IMPLICATIONS FOR PATIENT CARE: With this quantitative and functional imaging metric, physicians can measure the burden of metabolically active mCRPC on a whole-body scale and estimate an individual patient’s prognosis.
Footnotes
Published online January 8, 2021.
- © 2021 by the Society of Nuclear Medicine and Molecular Imaging.
REFERENCES
- Received for publication September 10, 2020.
- Accepted for publication December 14, 2020.


