


Article Figures & Data
Figures
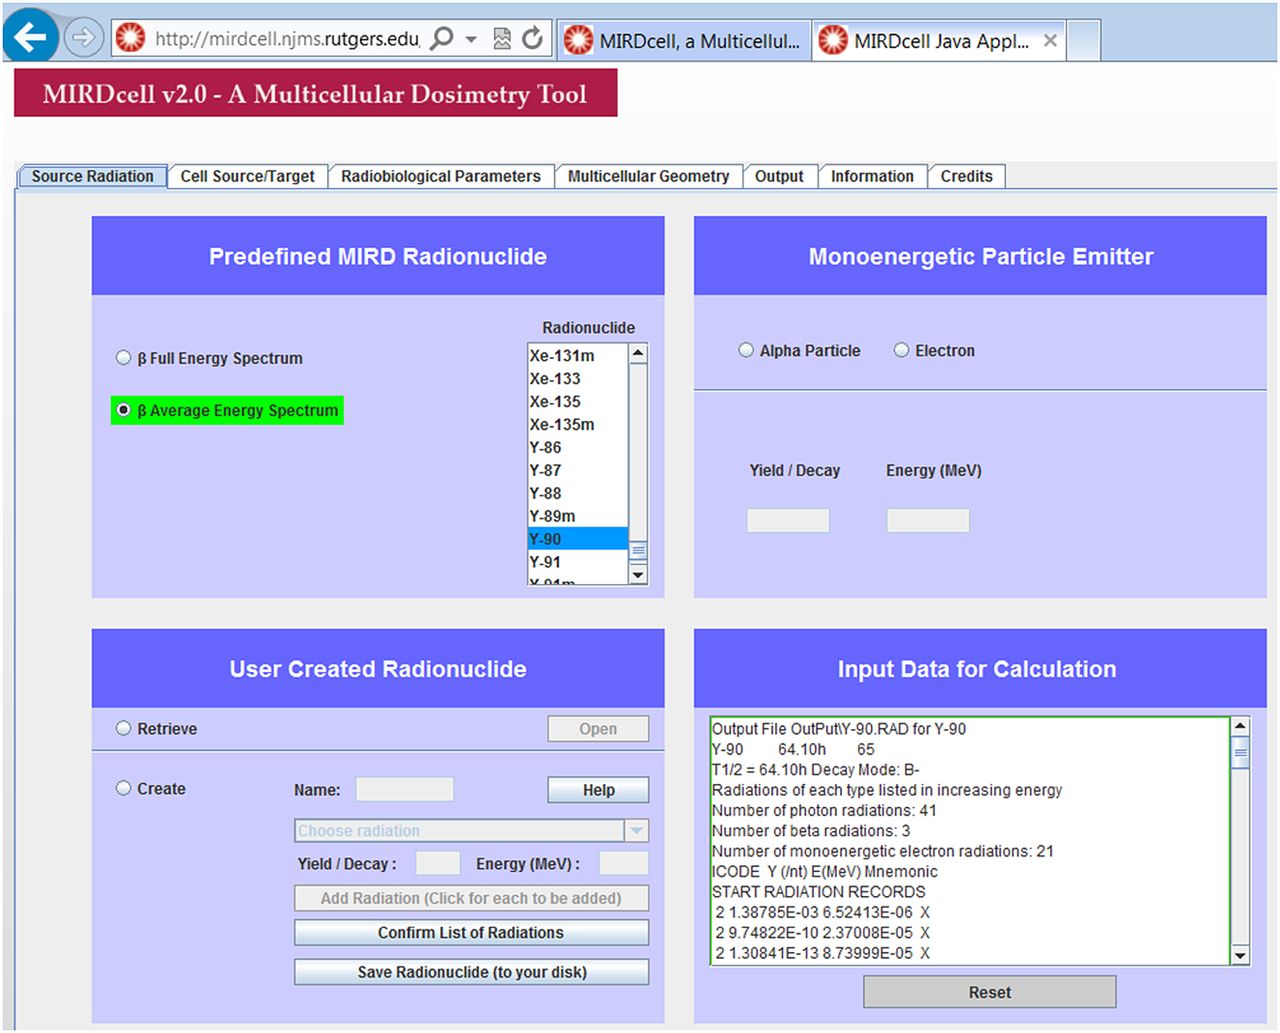
- FIGURE 1.
Screenshot of “Source Radiation” tab. This tab provides 3 options for selecting radioactivity to be placed in labeled cells: (1) Predefined MIRD radionuclide (top left). Radiation spectra are available for predefined radionuclides that include average β-particle energies (“β Average Energy Spectrum”) or complete β-particle spectrum (“β Full Energy Spectrum”). (2) Monoenergetic particle emitter (top right). Here, user can select either α particle or electron and can specify particle yield per disintegration and energy. (3) User-created radionuclide (lower left). User can create a radionuclide that includes a variety of selectable radiations (α, Auger electron, β−, and β+). Data are streamed into bottom right box, input data for calculation.
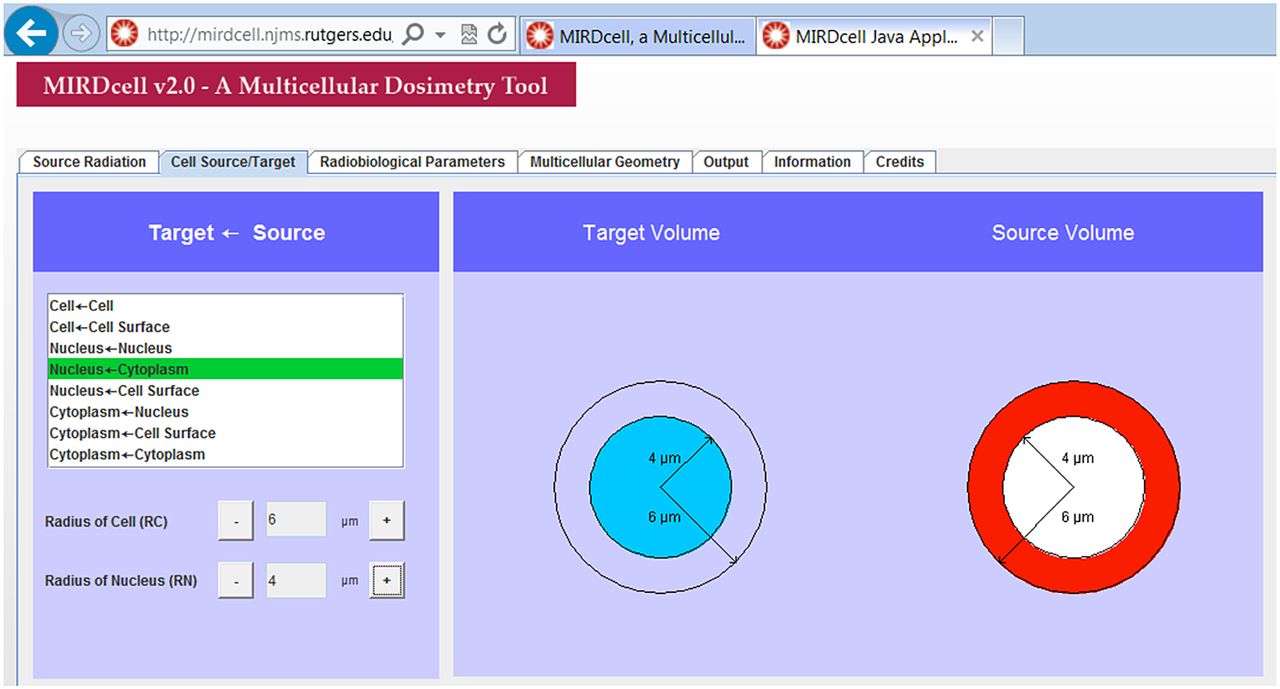
- FIGURE 2.
Screenshot of “Cell Source/Target” tab. Source region (red) in cell that contains radiopharmaceutical can be selected as cell, cell surface, nucleus, or cytoplasm (top left). Selectable target regions (blue) include cell, nucleus, or cytoplasm (top left). Cell and cell nucleus are represented by concentric shells of unit density water with cell radius (RC) and cell nucleus radius (RN), which can be set as desired (bottom left).
- FIGURE 3.
Screenshot of “Multicellular Geometry < 1-D Cell Pair.” This subtab enables rapid calculation of self-dose to labeled cell and cross-dose to neighboring cell that lies at some distance (i.e., 16 μm between centers in this example). Self- and cross-doses per unit cumulated activity in source cell (Gy Bq−1 s−1), also known as S value (2,35), are reported for selected source radiation (i.e., 90Y in this example) in box labeled “Result.” Calculation can be repeated for different cell separation distances (top left).
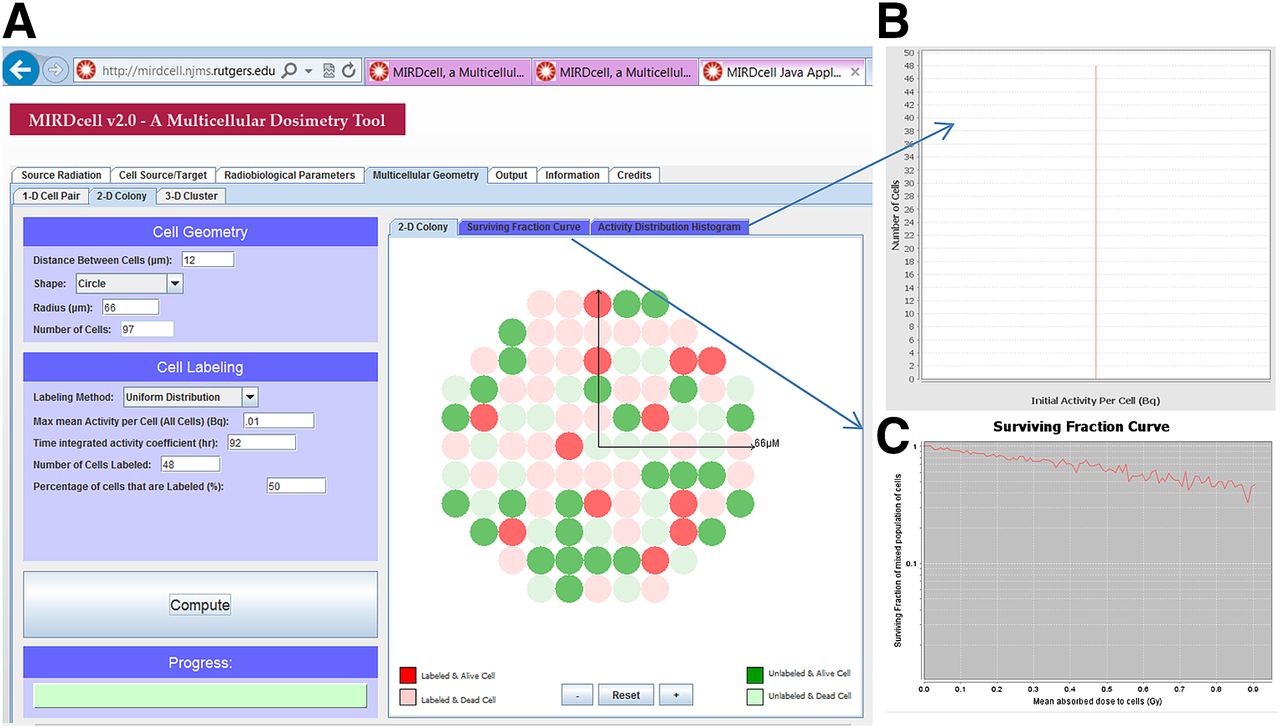
- FIGURE 4.
Screenshots of “Multicellular Geometry < 2-D Colony < 2-D Colony.” (A) Here, user can select multicellular geometry wherein cell population lies on plane. In “Cell Geometry” box, cell population can be constrained to different selectable shapes including circle (shown), ellipse, and rectangle (top left). Dimensions of each shape are provided by user (i.e., circle with 66-μm radius in this example). In “Cell Labeling” box, activity can be distributed among cell population according to selectable labeling methods: uniform (shown), normal, and lognormal. Mean activity per cell, residence time, and percentage of cells that are labeled can be specified. On selecting parameters and clicking “Compute,” resulting multicellular geometry is plotted on right in a manner that indicates whether cell is labeled (red) or unlabeled (green), and transparency represents whether cell is dead (transparent) or alive (opaque). (B) Histogram of activity per cell. This example shows uniform distribution of activity among labeled cells (each labeled cell has same activity). (C) Plot of surviving fraction of cells.
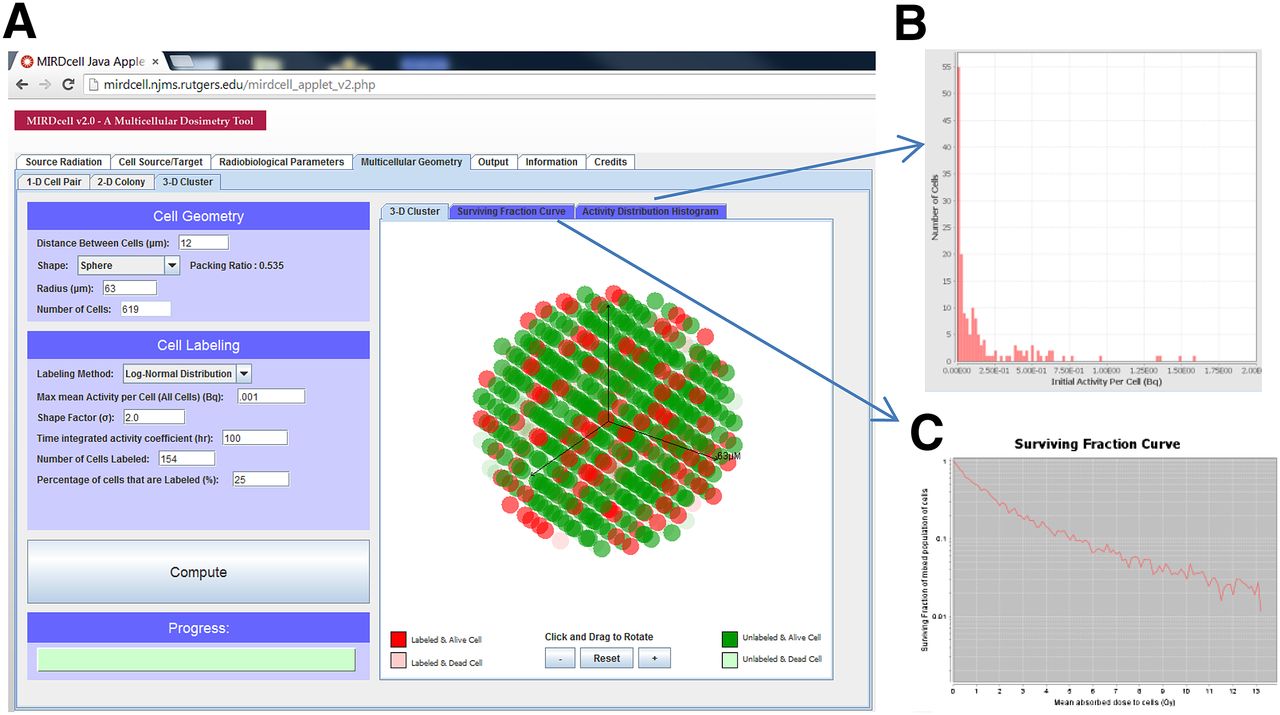
- FIGURE 5.
Screenshot of “Multicellular Geometry < 3-D Cluster < 3-D Cluster.” (A) User can select multicellular geometry wherein cell population is contained within 3-D geometry. In “Cell Geometry” box, cell population can be constrained to different selectable shapes including sphere (shown), ellipsoid, and cone. Dimensions of each shape are provided by user (i.e., sphere with 65-μm radius in this example). In “Cell Labeling” box, activity can be distributed among cell population according to selectable labeling distributions: uniform, normal, and lognormal (shown). Mean activity per cell, residence time, and percentage of cells that are labeled can be specified. When parameters are selected and “Compute” is clicked, the resulting multicellular geometry is plotted on right in a manner that indicates whether cell is labeled (red) or unlabeled (green), and transparency represents whether cell is dead (transparent) or alive (opaque). (B) Histogram of activity per cell. Small number of labeled cells (in this case it is 172) magnifies stochastic aspects of distribution in such a small population. Repeated clicking of “Compute” tab shows variations in distribution when Monte Carlo calculations are repeated. (C) Plot of surviving fraction of cells.
- FIGURE 6.
Examples of additional geometries available in “Multicellular Geometry < 3-D Cluster < 3-D Cluster.” These are 3-D cluster shapes with 50% of cells labeled. Cluster shapes are sphere, rod, cone, and ellipsoid. Cells are labeled (red) or unlabeled (green), and transparency represents whether cell is dead (transparent) or alive (opaque).
- FIGURE 7.
Comparison of experimental cell survival data (symbols) and theoretic cell survival data (solid lines; calculated with MIRDcell, version 2.0.9) for α-particle emitter 210Po in multicellular clusters. Experimental data are from Neti et al. (30), where 100%, 10%, or 1% of cells in cluster are labeled with 210Po. Inset shows full datasets for 1% labeling case. Modeling parameters are described fully in worked example 2 in online supplement.


Additional Files
Supplemental Data
Files in this Data Supplement:


Jump to section
Related Articles
Cited By...
- Establishing In Vitro Dosimetric Models and Dose-Effect Relationships for 177Lu-DOTATATE in Neuroendocrine Tumors
- MIRD Pamphlet No. 31: MIRDcell V4--Artificial Intelligence Tools to Formulate Optimized Radiopharmaceutical Cocktails for Therapy
- The MIRD Schema for Radiopharmaceutical Dosimetry: A Review
- Development and Preclinical Evaluation of [211At]PSAt-3-Ga: An Inhibitor for Targeted {alpha}-Therapy of Prostate Cancer
- [123I]CC1: A PARP-Targeting, Auger Electron-Emitting Radiopharmaceutical for Radionuclide Therapy of Cancer
- Gadolinium-Based Nanoparticles Sensitize Ovarian Peritoneal Carcinomatosis to Targeted Radionuclide Therapy
- Efficacy of HER2-Targeted Intraperitoneal 225Ac {alpha}-Pretargeted Radioimmunotherapy for Small-Volume Ovarian Peritoneal Carcinomatosis
- Marshalling the Potential of Auger Electron Radiopharmaceutical Therapy
- MIRD Pamphlet No. 28, Part 1: MIRDcalc--A Software Tool for Medical Internal Radiation Dosimetry
- Dosimetry in Radiopharmaceutical Therapy
- MIRD Pamphlet No. 27: MIRDcell V3, a Revised Software Tool for Multicellular Dosimetry and Bioeffect Modeling
- Modeling Early Radiation DNA Damage Occurring During 177Lu-DOTATATE Radionuclide Therapy
- Dosimetry for Radiopharmaceutical Therapy: Current Practices and Commercial Resources
- Overview of the First NRG Oncology-National Cancer Institute Workshop on Dosimetry of Systemic Radiopharmaceutical Therapy
- Targeted Brain Tumor Radiotherapy Using an Auger Emitter
- PARP-1-Targeted Auger Emitters Display High-LET Cytotoxic Properties In Vitro but Show Limited Therapeutic Utility in Solid Tumor Models of Human Neuroblastoma
- PARaDIM: A PHITS-Based Monte Carlo Tool for Internal Dosimetry with Tetrahedral Mesh Computational Phantoms
- Targeting Micrometastases: The Effect of Heterogeneous Radionuclide Distribution on Tumor Control Probability
- Antibody with Infinite Affinity for In Vivo Tracking of Genetically Engineered Lymphocytes
- Monte Carlo N-Particle (MCNP) Modeling of the Cellular Dosimetry of 64Cu: Comparison with MIRDcell S Values and Implications for Studies of Its Cytotoxic Effects
- 124I PET Assessment of Response of Bone Metastases to Initial Radioiodine Treatment of Differentiated Thyroid Cancer
- Biokinetic Modeling and Dosimetry for Optimizing Intraperitoneal Radioimmunotherapy of Ovarian Cancer Microtumors
- Comparison of the Therapeutic Response to Treatment with a 177Lu-Labeled Somatostatin Receptor Agonist and Antagonist in Preclinical Models
- Nanoconjugation of PSMA-Targeting Ligands Enhances Perinuclear Localization and Improves Efficacy of Delivered Alpha-Particle Emitters against Tumor Endothelial Analogues
- Monte Carlo Evaluation of Auger Electron-Emitting Theranostic Radionuclides
- Proceedings of the Second NCI-SNMMI Workshop on Targeted Radionuclide Therapy