


Abstract
With the ongoing dramatic growth of radiopharmaceutical therapy, research and development in internal radiation dosimetry continue to advance both at academic medical centers and in industry. The basic paradigm for patient-specific dosimetry includes administration of a pretreatment tracer activity of the therapeutic radiopharmaceutical; measurement of its time-dependent biodistribution; definition of the pertinent anatomy; integration of the measured time–activity data to derive source-region time-integrated activities; calculation of the tumor, organ-at-risk, and/or whole-body absorbed doses; and prescription of the therapeutic administered activity. This paper provides an overview of the state of the art of patient-specific dosimetry for radiopharmaceutical therapy, including current methods and commercially available software and other resources.
In parallel with the ongoing, dramatic growth in molecularly targeted radiopharmaceutical therapies (RPTs), there is intense interest in the development of individualized radiation dosimetry for such therapies. This paper reviews the state of the art of patient-specific dosimetry, including current methods and commercially available software and other resources.
DOSE PRESCRIPTION ALGORITHMS
Historically, 3 dose (i.e., administered activity)-prescription algorithms for RPT have been used (1,2): fixed administered activity—all patients receive the same administered dose; maximum tolerated dose (MTD)—patients receive an individualized administered activity projected to deliver the maximum tolerated absorbed dose to the therapy-limiting normal tissue; and prescribed tumor-absorbed dose—patients receive an individualized administered activity projected to deliver a specified therapeutic absorbed dose to the tumor or target tissue. The fixed-administered-activity approach does not require any kinetic or other patient measurements but is at the risk of either exceeding the MTD or treating at well below the MTD of individual patients. (In some countries, however, patient-specific dosimetry is required by regulations even for RPTs using fixed administered activities.) The patient-specific-MTD and prescribed-tumor-dose approaches typically require a series of pretherapy measurements to derive the administered activity to deliver either the MTD or the prescribed tumor-absorbed dose.
PARADIGM FOR PATIENT-SPECIFIC DOSIMETRY
The basic paradigm for patient-specific dosimetry for RPT is as follows: administration of a pretreatment tracer activity of the therapeutic radiopharmaceutical; measurement of the radiopharmaceutical’s time-dependent biodistribution and clearance; definition of the pertinent anatomy by CT or MRI; integration of the measured time–activity data to derive source-region time-integrated activities (TIAs); calculation of the tumor, organ-at-risk, or whole-body absorbed dose coefficients (i.e., the absorbed doses per unit administered activity); and prescription of the therapeutic administered activity to deliver the MTD or the prescribed tumor-absorbed dose.
Important refinements of the foregoing paradigm are incorporation of voxel-level dosimetry to derive the 3-dimensional (3D) dose distributions and mathematic modeling of the biologic impact of the spatial and the temporal nonuniformity of the doses, with adjustment for the latter requiring calculation of and integration of dose rates.
MEASUREMENT OF TIME–ACTIVITY DATA
Planar Imaging
A widely used approach to determining source-region activities is conjugate-view γ-camera imaging (3,4). Anterior and posterior conjugate-view whole-body scans are acquired. The geometric mean of the aligned scans is then calculated, and the net (i.e., background-subtracted) count rates in regions of interest (ROIs) corresponding to tumors, normal organs, and, possibly, the whole body are determined. Assuming a known uniform linear attenuation coefficient μ through the full thickness T of the patient, a first-order attenuation correction may be applied by multiplying the net counts by eμ(T/2). Alternatively, a transmission image through the patient of a uniform source of activity (such as a commercially available 57Co flood source) may be used to derive a measured attenuation correction, with appropriate adjustment (if applicable) of the energy-related difference in attenuation between the γ-rays emitted by the flood source and those emitted by the radionuclide administered to the patient (5). A transmission image through the patient with a 57Co flood source can also be used to measure the thickness of the patient (6). The attenuation-corrected source-region ROI count rates are converted to activities using a measured system calibration factor (e.g., cps/MBq) and then to activities per unit of administered activity. The conjugate-view method works reasonably well for normal-organ dosimetry but is generally less accurate for tumor dosimetry unless incorporated into a hybrid-imaging approach.
SPECT and SPECT/CT
The count rate per voxel in reconstructed SPECT image sets is proportional to the activity concentration, subject to the corrections for collimator–detector response (7,8), scatter (e.g., using the triple-energy window method (5,7,9,10)), attenuation (based on CT imaging (7)), and partial-volume averaging (based on CT-derived source-region dimensions and phantom study–derived recovery coefficients (11,12)). The corrected count rate per voxel is divided by the system calibration factor [(cps/voxel)/(kBq/mL)] to yield the activity concentration.
Hybrid SPECT–Planar Imaging
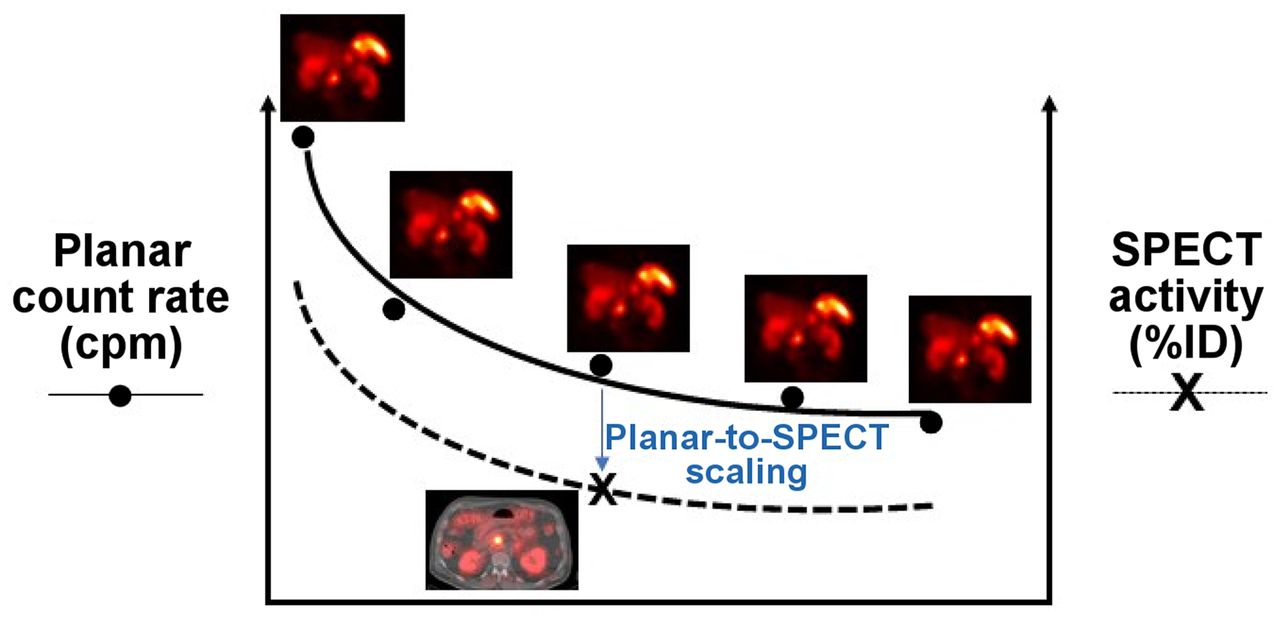
A practical alternative to serial whole-body SPECT is hybrid SPECT–planar imaging, in which both SPECT and planar scans are acquired at a single time point and only the more rapid planar scans are acquired at the remaining time points (Fig. 1) (7). The multiple planar scans provide the shapes of the time–activity curves, and the single SPECT study provides the (more reliable) activity estimate in the respective source regions at the time point of the SPECT study. The one time point at which both SPECT and planar scans are acquired thus provides a scaling factor to convert the source-region counts in each of the multiple planar scans to activity.

Hybrid SPECT–planar imaging approach to measurement of radiopharmaceutical kinetics.

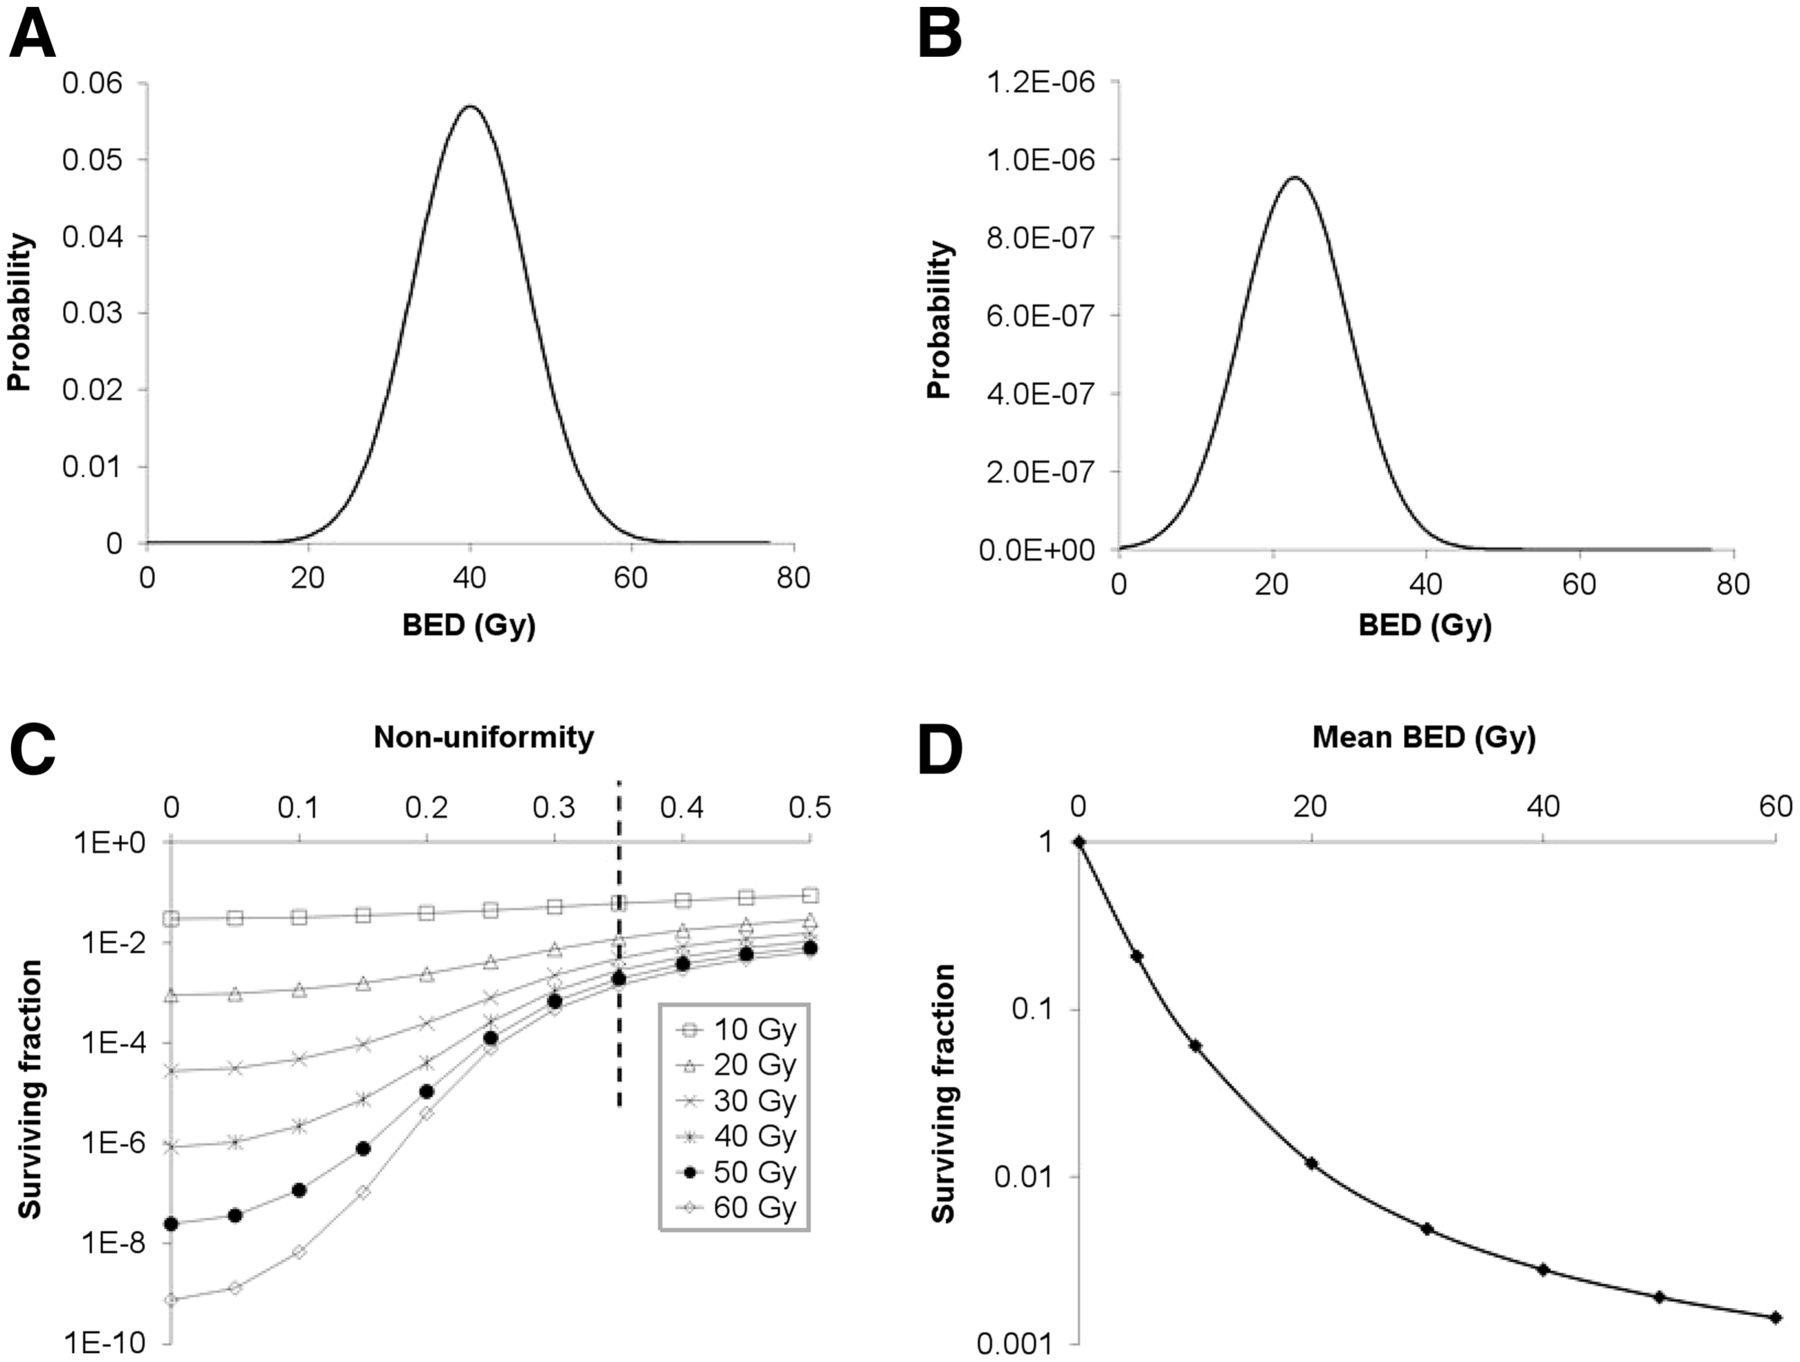
Effect of dose nonuniformity on tumor response. (A) Hypothetical nonuniform dose to tumor cell population represented by normal distribution with average of 40 Gy, SD of 7 Gy, and fractional SD of 7 Gy/40 Gy = 0.175. (B) Overall tumor cell survival fraction as function of dose nonuniformity expressed as fractional SD of average dose from 0 (i.e., uniform dose) to 0.5 and of average tumor dose from 10 Gy (highest curve) to 60 Gy (lowest curve). Tumor cell survival is greater as dose nonuniformity increases. (C) Tumor cell survival probability for dose distribution in A, assuming monoexponential tumor cell survival curve with mean lethal dose Do of 2.85 Gy (i.e., α = 0.35/Gy). Overall tumor cell survival fraction is area under curve. (D) Dose–response for dose nonuniformity (i.e., fractional SD) of 0.35, corresponding to points intersecting dotted vertical line, is concave upward. (Adapted from reference (57).)
Single-Time-Point Imaging
For radiopharmaceuticals for which the kinetics are well characterized and exhibit little variability among patients, population-averaged normal-organ time–activity curves may be scaled by the respective image-derived, patient-specific organ activities measured at an appropriate single time point to derive individualized time–activity curves and TIAs (13). The reliability of this approach requires validation, however, and the variable biology among tumors makes it unlikely to be translatable to lesion dosimetry.
PET and PET/CT
Quantitative PET remains more routine than quantitative SPECT. With rare exceptions (14), positron-emitting radionuclides have not been used in RPT. Among other reasons, a surrogate PET radionuclide and the therapeutic radionuclide must be reasonably well matched in terms of physical half-life so that serial PET scans can be performed over a sufficiently long total time frame to yield reliable estimates of the time–activity data, and that is often not the case for commonly used positron emitters. For example, 68Ga-DOTATATE (NETSPOT; Advanced Accelerator Applications) (68Ga physical half-life, 67.7 m) is far too short-lived to estimate tumor and normal-organ activities of 177Lu-DOTATATE (LUTATHERA; Advanced Accelerator Applications) (177Lu physical half-life, 6.65 d) out to several days or longer after administration, as required for 177Lu-DOTATATE dosimetry. On the other hand, surrogates of therapeutic radiopharmaceuticals labeled with positron-emitting 124I (physical half-life, 4.18 d) can provide reasonable estimates of the time–activity curve for radiopharmaceuticals labeled with 131I (physical half-life, 8.04 d) (15).
Ancillary Measurements
Blood and Bone Marrow Activity
The hematopoietic marrow is highly radiosensitive and often the dose-limiting normal tissue in RPT, particularly for radiolabeled antibodies and peptides. Quantitation of marrow activity is particularly challenging, however, as it is a widely distributed and cannot be directly sampled except by biopsy. Practical approaches are based on counting of blood samples and estimates of the marrow extracellular fluid fraction (16,17) or on scintigraphic imaging of vertebral marrow (18,19).
Whole-Body Activity
Whole-body activity may be measured by an adaptation of the conjugate-view method, with the patient undergoing a conjugate-view whole-body scan (or probe-based counting) shortly after the radiopharmaceutical administration (i.e., at time t ≈ 0) but before the patient’s first postadministration void or bowel movement. The net geometric-mean whole-body count rate at each subsequent time point is normalized to the zero-time (i.e., 100%) value to yield the whole-body percentage of the administered activity.
CALCULATION OF TIAS
The TIA (in h),  (rS), is the total number of radioactive decays in source region rS; the TIA coefficient (in h/MBq),
  (rS), is the total number of decays per unit of administered activity in source region rS (20). There are 3 basic approaches to the calculation of cumulated activities: curve fitting (often fit to exponential functions) and analytic integration; numeric integration (i.e., the trapezoidal rule), often assuming elimination by physical decay after the last measurement or by extrapolating the clearance rate deduced from the last 2 measured time points; and compartmental modeling (21). A compartmental model is a mathematic representation—a system of linked differential equations—of the exchange of a radiopharmaceutical among compartments in the body. Many compartmental-modeling programs are available, and some provide estimates of TIAs. An advantage of compartmental modeling is its ability to yield TIAs in source regions that cannot be radioassayed directly (regions such as the cell surface or the cell nucleus).
MIRD pamphlet 16 (5) provides guidance on choosing suitable time points and the number of samples for adequately defining a source region time–activity curve and TIA.
DEFINITION OF PATIENT-SPECIFIC ANATOMY
The most reliable approach to defining patient anatomy is either CT or MRI. Multimodality SPECT/CT scanners expedite the registration of scintigraphic and anatomic image sets (22). Tumor and organ volumes of interest (VOIs) may be defined by manual segmentation or by various thresholding, seed-growing, and other automated techniques, now widely available and increasingly accurate.
CALCULATION OF ABSORBED DOSES
The ultimate objective of dosimetry is the determination of organ or tumor absorbed doses, since biologic effects will be better predicted by absorbed dose than by administered activity. There are 3 basic approaches to the calculation of absorbed dose: the dose factor (S value)–based calculation, dose-point kernel convolution, and Monte Carlo (MC) radiation transport simulation.
Organ-Level Dosimetry
One of the most widely used approaches at the organ level is the MIRD schema (20,21). Several personal computer–compatible versions of the MIRD formalism have been developed, including MIRDOSE (23), OLINDA/EXM (24), IDAC Dose (25), and MIRDcalc. Adaptations of the MIRD formalism have been incorporated into various commercially available software packages.
In the MIRD formalism (20,21), the mean absorbed dose to a target region  equals the summation over all source regions
  of the products of 2 terms—the TIA in source region
  and the radionuclide S value for the source-region–target-region pair,
  (26). By modeling tumors as spheres, the MIRD formalism may be adapted to tumor self-irradiation (i.e., for
  ) dosimetry using tabulated values of sphere self-irradiation absorbed fractions.
Voxel-Level Dosimetry
Voxel-level dosimetry is addressable by dose-point kernel convolution, MC algorithms, or voxel S values. A dose-point kernel represents the radial distance–dependent absorbed dose about a point source of radiation in an infinite homogeneous (typically, water-equivalent) medium (27). The development of faster computer processors, the availability of more plentiful memory, porting of MC packages to parallel computing architectures, and other technical developments (e.g., approximation techniques) have made computationally onerous MC methods, considered the most accurate approach to voxel-level dosimetry, increasingly practical. The MIRD formalism has been extended to arbitrary macroscopic activity distributions in 3 dimensions for calculation of the dose distribution using voxel S values (28).
Cell-Level Dosimetry
The differential delivery to and uptake among and within cells of administered radiopharmaceuticals make it difficult to predict the radiation response of cell populations to radiopharmaceuticals based solely on the mean absorbed dose. A web-based applet, MIRDcell, has been developed that adapts the MIRD formalism to cellular and subcellular dosimetry (29). This applet models the dose to the cellular and subcellular compartments (i.e., the cell membrane, cytoplasm, and nucleus) for both isolated cells and clusters of cells using cellular S values (30,31) and mathematically models the responses of labeled and unlabeled cells as a function of the fraction of cells labeled.
BIOEFFECTS MODELING
The absorbed dose is not the only dosimetric factor impacting biologic outcomes of RPT. Other relevant factors include radiosensitivity and the spatial and temporal distributions of absorbed dose. Attempts have thus been made to model the biologic effects of radiation. Such bioeffects modeling is particularly relevant to RPT, as its clinical effects are impacted by the low and time-varying dose rates and the nonuniform dose distributions within associated targeted tissues.
Dose-dependent cell survival is often described by the target theory–based linear quadratic (LQ) model (32,33):
 Eq. 1
where SF is the surviving fraction, D is the absorbed dose (in Gy), α is the linear sensitivity coefficient (in Gy−1), and β is the quadratic sensitivity coefficient (in Gy−2). Important modifiers of the biologic response to radiation include the dose rate and the dose distribution. Both are particularly important for RPT, given the low, time-varying dose rates and spatially nonuniform dose distributions, especially in tumors, associated with such therapy. The various dose metrics and associated parameters for bioeffects modeling of RPT are summarized in Table 1.
Eq. 1
where SF is the surviving fraction, D is the absorbed dose (in Gy), α is the linear sensitivity coefficient (in Gy−1), and β is the quadratic sensitivity coefficient (in Gy−2). Important modifiers of the biologic response to radiation include the dose rate and the dose distribution. Both are particularly important for RPT, given the low, time-varying dose rates and spatially nonuniform dose distributions, especially in tumors, associated with such therapy. The various dose metrics and associated parameters for bioeffects modeling of RPT are summarized in Table 1.
Bioeffects Modeling of RPT: Dose Metrics and Related Parameters (19)
Several studies have shown a better response correlation with these metrics than with the average tumor-absorbed dose (34–37).
UNCERTAINTIES IN DOSE ESTIMATION
Sources of uncertainty in radiopharmaceutical dosimetry include assay of the administered activity, determination of organ and tumor volumes or masses (often the greatest contributor to uncertainty), measurement of time-dependent source-region activities, calculation of source-region TIAs, and translation of TIAs and anatomic data to absorbed dose. Assuming they are independent of each other, the respective fractional uncertainties of these quantities can be summed in quadrature to yield the overall uncertainty of the absorbed dose. In a clinical example (38), 90Y-DOTATATE radiopeptide therapy in combination with 111In-DOTATATE imaging of neuroendocrine cancer, the overall uncertainties in the estimated mean absorbed doses to at-risk normal organs (kidney, spleen, and liver), large (>100-cm3) lesions, and small (∼10-cm3) lesions were 10%, 15%, and 40%, respectively, providing some insight into the range of uncertainties one may expect in best-practice radiopharmaceutical dosimetry.
COMMERCIAL RESOURCES
The following 2 subsections describe currently marketed commercial products relevant to radiopharmaceutical dosimetry, based on material provided by the respective vendors. We note as a disclaimer that certain commercial equipment, instruments, and materials are identified in this paper solely to promote understanding. Such identification does not imply recommendation by the Society of Nuclear Medicine and Molecular Imaging or the National Institute of Standards and Technology (NIST), nor does it imply that the products identified are necessarily the best available for the purpose cited.
Standard Sources
Traceability to national agencies of standard, or reference, sources is critical in RPT dosimetry for accurate measurement of activities administered to patients and accurate calibration of imaging systems (based on the image-derived count rate of a known activity) for the measurement of time–activity data in patients. Errors in the measured administered activity or calibration activity will be propagated through the dosimetry workflow and result in systematic underestimation or overestimation of the resulting patient tissue activities and doses (as high as 20% (39)). Dose calibrators (also known as activity meters) are ionization chambers with a variable charge, or current, response that depends on the type, flux, and energy of the emitted radiations among different radionuclides. Traceable standards of precisely known activities are thus required by dose calibrator manufacturers and, in some cases, end users to derive radionuclide- and geometry-specific factors for converting measured charge (or current) to activity and are thus essential in ensuring that the correct radiopharmaceutical activity is being administered to the patient or added to a calibration phantom. Traceable standards are important in multicenter clinical trials to ensure consistency in activity- and dose-dependent results among the participating centers, particularly for radionuclides that are pure β-particle emitters (such as 90Y), for which assays must be based on measurement of the associated bremsstrahlung spectrum, or which have complex decay schemes (including 177Lu and many α-particle emitters and their progeny) with multiple x- and γ-ray emissions.
NIST
NIST is responsible for developing and disseminating standards for radioactivity measurements in the United States. NIST has established national standards for every radionuclide currently used in Food and Drug Administration (FDA)–approved radiopharmaceuticals. Work was recently completed on a standard for 223Ra, and NIST plans to develop standards for such emerging radionuclides as 67Cu and 89Zr and the α-particle emitters 212Pb, 227Th, and 225Ac.
The mission of the NIST Radioactivity Measurement Assurance Program is to enable radiopharmacies, isotope producers, and radiopharmaceutical manufacturers to establish and maintain traceability through direct comparisons of calibrated solutions between the participants and NIST. The comparison can be done either through the distribution of NIST-calibrated solutions distributed as blind samples or by the submission of a measured solution by the participant to NIST, which then assays that solution. Traceability is established by comparing the participant’s result with the NIST-determined value. More recently, NIST calibration of phantoms (typically large solid cylindric sources containing 68Ge, 133Ba, and 75Se as surrogates for 18F, 131I, and 177Lu, respectively) allows the direct calibration of SPECT and PET scanners and provides a means of comparing imaging results across multiple clinical sites.
Eckert and Ziegler Isotope Products
Eckert and Ziegler Isotope Products holds an International Organization for Standardization 17025:2017 accreditation for its Valencia Calibration Laboratory through the German accreditation service Deutsche Akkreditierungsstelle GmbH. This accreditation ensures that it maintains not only measurement capabilities for NIST traceability but also the necessary quality management system compliant with good measurement practices globally. Sealed-source configurations include line- and point-source arrays; custom-sized 2-dimensional and 3D phantoms; and vials, tubes, and syringes. Any fillable phantom can be converted to a long-lived sealed source with the desired nuclide in water-equivalent epoxy with NIST traceability. In addition, Eckert and Ziegler Isotope Products has a patented process for manufacturing phantoms with lesions embedded directly in a “warm” background with no nonradioactive encapsulation of the lesions. Lesions can be fabricated in various shapes and sizes (including anthropomorphic shapes). Eckert and Ziegler Isotope Products has the capability to calibrate solutions of longer-lived radiopharmaceuticals such as 177Lu, 111In, and131I or other radionuclides with physical half-lives of 2 d or longer. Calibration of shorter-lived nuclides may also be possible, depending on customer location and shipment time constraints. A wide range of sealed sources and solutions for reference and calibration for over 80 nuclides and multinuclide combinations are available.
Sanders Medical Products
Sanders Medical Products manufactures a complete line of NIST-traceable 68Ge cylindric uniform phantoms (activity, ≤370 MBq [10 mCi] ± 3%; 68Ge radionuclidic purity, 99.8%). The phantoms use a high-density polyethylene thermoplastic polymer shell with a uniform cast polymer matrix of 68Ge. The units are checked by high-resolution PET/CT scanning before release. Sanders also produces positron-emitter calibration standards composed of uniform solid suspensions of 68Ge encased and sealed in plastic bottles for use with PET scanners, dose calibrators, and survey meters.
Dosimetry Software
By design, the following compilation of dosimetry software is limited to packages that are commercially available and therefore readily obtainable by the user community. Of course, many academic investigators have developed software packages with comparable functionality.
QDOSE
QDOSE (ABX-CRO) is a stand-alone software suite for internal dosimetry using serial nuclear medicine and anatomic DICOM images of diagnostic or therapeutic radionuclides, including 90Y-microsphere selective internal radiation therapy (SIRT). QDOSE supports calculations using planar imaging, including attenuation and background corrections, tomographic imaging, and hybrid imaging. Planar images can be calibrated using a system calibration factor based on a reference vial (as for PET and SPECT) or total-body activity. QDOSE provides automatic (rigid and deformable) and manual registration of serial planar or tomographic images and multiple options for drawing planar-image ROIs and tomographic VOIs and for manual, semiautomatic, and automatic organ segmentation. Time–activity curves are generated and can be fit to exponential functions and integrated to yield TIAs, with accounting for the total-body or remainder-of-body activity. TIAs can also be calculated using the trapezoidal approach. Time–activity curves and TIAs (e.g., red-marrow data based on blood sampling) derived outside QDOSE can be imported. QDOSE uses the IDAC-Dose program (25) (which includes 27 commonly used radionuclides) to calculate the mean normal-organ absorbed doses as the sum of the self-dose and cross-organ absorbed doses based on the Cristy–Eckerman stylized phantoms (40). For more patient-specific dose results, the standard organ masses can be edited or calculated from the 3D segmented organs. Absorbed-dose distributions may also be calculated by convolution of voxel S values with the voxel TIAs in segmented source regions, yielding dose–volume histograms (DVHs) and patient-specific dose distribution images. The mean absorbed doses and dose distributions to tumor-simulating spheres may also be calculated.
The results of IDAC Dose, version 1.0, mean organ dose calculations were compared with those of OLINDA/EXM, version 1. Version 2.1 of IDAC Dose was validated against version 1.0. This validation was used for the certification according to Directive 93/42/EEC (Medical Device Directive). QDOSE is CE (Conformite Europeenne)-approved for clinical use within the European Union and for use as a research device outside the European Union.
PLANET Dose
PLANET Dose (DOSIsoft), for 3D RPT dosimetry, is FDA-approved for 90Y-microsphere SIRT and CE-marked for other isotopes (90Y, 177Lu, 131I [pending]) or workflows. Images (DICOM-compatible) from CT, MRI, planar γ-cameras, SPECT, and PET are supported as input, with correction for partial-volume averaging available. Rigid or deformable registration of multiple image sets and of VOIs can be performed manually or semiautomatically (based on user-selected anatomic fiduciary markers). Time–activity curves can be integrated by the trapezoidal method or fit to affine or to exponential functions and integrated analytically. 3D voxel-based doses are calculated using voxel S values, with tissue mass-density corrections available. Target-region dosimetry results are reported in color-wash or isodose-contour displays and as DVHs. PLANET Dose has been validated against MC simulations and OLINDA/EXM.
GE Dosimetry Toolkit and Q.Thera AI
The GE Dosimetry Toolkit (GE Healthcare) is an application to define and report patient organ volumes and time–activity curves and to calculate the organ TIAs and mean absorbed doses on the basis of serial whole-body planar scans, serial SPECT/CT scans, or hybrid imaging. Specific dosimetry applications include 131I-iodide thyroid cancer therapy, 90Y-SIRT, and 177Lu therapies. There are 4 steps in the GE Dosimetry Toolkit SPECT workflow: SPECT/CT image reconstruction, with detection of patient motion and correction for attenuation, scatter, and collimator–detector blurring; registration of serial scans to one common reference image with semiautomatic (seed-growing) or manual tools; segmentation of the target organs and generation of VOIs; and calculation of volumes, activities, and TIAs. A standard-activity syringe can be included in the field of view to measure system sensitivity for each scan. The measured time–activity curves are fit to exponential functions. All outputs are provided as Microsoft Excel files or in an OLINDA/EXM-compatible format.
Q.Thera AI is a technology in development by GE Healthcare; it is not currently FDA-approved. Automatic registration and segmentation of organs and lesions (and calculation of the percentage injected dose for each source region) are performed. The resulting time–activity curves are fit to exponential functions and integrated either analytically or by the trapezoidal method. Organ-absorbed doses are calculated for the user-entered radionuclide, model (newborn to adults), source-region TIAs, and, optionally, volumes. If the total-body mass only is altered, the reference-phantom organ masses remain the same, but if the user selects the option to normalize by patient body mass, the total body and all the internal organs will be scaled accordingly. Self-irradiation absorbed doses for unit-density spheres (1–1,000 g in mass) are also calculated.
Hermes Medical Solutions
Hermes Medical Solutions markets a suite of dosimetry tools, including scanner-independent quantitative SPECT reconstruction (HybridRecon of DICOM-compatible SPECT/CT data); SIRT planning and verification (HermesSIRT); OLINDA, version 2.2; and voxel-level dosimetry. The HybridRecon SPECT reconstruction currently handles 67Ga, 123I, 131I, 111In, 81Kr, 177Lu, 99mTc, 201Tl, 166Ho, 90Y, and 133Ba. With Hermes SIRT, the planning tumor volume, lean body mass, or partition models can be used to calculate the individual-patient dose on the basis of a 99mTc-macroaggegated albumen scan. The user is guided through alignment, segmentation, and normalization of serial images and curve fitting of the organ time–activity curves and TIAs as input to OLINDA, version 2.2. The Hermes Medical Solutions voxel-level dosimetry product uses a fast MC algorithm to simulate an activity distribution from serial SPECT or PET images plus CT scans to calculate a dose map. Organ mean and maximum absorbed doses and DVHs are reported.
MIM Software
MIM Software dosimetry includes quantitative ordered-subsets expectation maximization SPECT image reconstruction (SPECTRA Quant) with CT-derived attenuation correction, energy window–based scatter correction and resolution recovery, organ and tumor segmentation (using an FDA-approved artificial-intelligence autosegmentation platform), and absorbed-dose calculations. SPECTRA Quant has been tested for quantitative accuracy, and corrections have been developed for several radionuclides. For a simulated 177Lu test with the SIMIND MC code, an 85% recovery was found for a 32-mm-diameter sphere with a 10:1 activity concentration ratio between the sphere and background. Local rigid registrations among SPECT images are performed using only the information in and around each segmented region, and these are then merged to generate a composite aligned SPECT image, with validation against manual registration (agreement within 1% of TIAs for both organ and tumors). For β-emitters such as 90Y, MIM Software supports dosimetry using either local deposition or voxel S-value kernel convolution and can be performed on either bremsstrahlung SPECT or PET images. For γ-ray emitters such as 177Lu and 131I, voxel S-value kernel convolution with CT-based density correction is available, and dosimetry can be performed using multiple SPECT/CT scans, a hybrid approach, or a single SPECT/CT scan. For dosimetry with multiple SPECT/CT scans and hybrid SPECT/planar scanning, TIAs are calculated using either trapezoidal integration with exponential terms for extrapolation or one of several exponential models. With serial SPECT/CT scans, these can be applied on an organ-level or a voxel-level basis. With hybrid SPECT/planar scanning, integration is based on the planar-image activities, with scaling based on the SPECT-derived activity. Planar image corrections for scatter, attenuation, and background are available. MIM Software is also developing 2 methods of single-time-point dosimetry for 177Lu DOTATATE: the Hänscheid approach (which assumes an exponential time–activity curve) (41,42) and the a priori information approach (which relies on a patient-specific time–activity curve measured by serial SPECT/CT scans of a prior therapy cycle).
PMOD
PMOD (PMOD Technologies) supports an automated workflow of preprocessing steps to derive dosimetry input data from a set of sequential image acquisitions, using its PBAS tool and the PKIN kinetic modeling tool. The first task is to combine these images into a dynamic series using PMOD’s Merge tool. Organ VOIs are defined by isocontouring, manual or semiautomatic outlining, or use of a matched anatomic dataset. Using a drop-down list, each VOI can be assigned to an organ in a particular reference phantom. Each organ VOI’s activity concentration is then transferred to PKIN, PMOD’s kinetic modeling tool, as a time–activity curve. These curves may be time-shifted to account for acquisitions with multiple bed positions and integrated to yield TIAs by rectangular or trapezoidal integration followed by isotope decay, fitting of the declining portion to exponential functions and analytic integration, or a combination of both. The resulting TIAs may be directly imported into an OLINDA/EXM case file or an IDAC, version 2.1, file.
Rapid
Rapid offers quantitative imaging and dosimetry consulting and analysis services and the software required for implementation. The specific services include analysis and dosimetry of preclinical data, support for imaging trial design (i.e., determining the number and temporal spacing of the image acquisitions and their settings, describing and analyzing phantom studies for site qualification and calibration, developing imaging manuals and procedures, and performing centralized vendor-agnostic quantitative SPECT reconstruction), and standard phantom and patient-specific 3D dosimetry calculations.
Based on the open-source 3D Slicer package, RPTDose generates MC-derived 3D dose distribution maps and radiobiologic dosimetric parameters for a radiopharmaceutical. RPTDose incorporates 2 software packages (IRL and 3D-RD) that were originally developed and validated at the Johns Hopkins University and have been licensed by Rapid. IRL (Iterative Reconstruction Library) is a vendor-neutral software package for quantitative ordered-subsets expectation maximization reconstruction of SPECT images, with compensation for attenuation (based on CT-derived attenuation maps), scatter (using the effective source scatter estimation method with approximations for nonuniform attenuators and multiple scatters), and collimator–detector response (estimated by MC simulation of point sources at various distances from the collimator face and propagation of photons in the collimator and detector). IRL has been validated for a number of radionuclides (including 90Y, 99mTc, 111In, 123I, 131I, 201Tl, 223Ra, and 227Th) on the basis of data from physical phantom studies and MC-simulated projection data. The second software package, 3D-RD, performs patient-specific absorbed dose calculations using electron γ-shower MC simulations based on CT-derived 3D density maps and the quantitative SPECT-derived activity distributions at multiple time points. The dose rates for each VOI are fit using nonlinear least-squares fitting to model functions, and the absorbed doses are then calculated as the area under the dose-rate curve from 0 to infinity.
Rapid has also developed and validated a web-based, multiuser reference-phantom, organ-level MIRD-style dosimetry software tool, 3D-RD-S, currently in the final stages of development for a 510k application for FDA clearance. 3D-RD-S uses International Commission on Radiological Protection publication 89 phantoms (43), publication 107 radionuclide decay data (44), and publication 133 specific absorbed fractions (72 source and 43 target regions (45)). 3D-RD-S also supports calculation of tumor self-dose for spheric tumors with 5 compositions and 10 diameters from 0.2 to 12 cm. The code supports dose calculation for a radionuclide and all its radioactive progeny, allowing the user to assume that the daughters have the same distribution as the parent or a distribution that is scaled to that of the parent or independent of it. Rapid is also developing a software package to perform quantitative SPECT reconstruction of difficult-to-image therapeutic radionuclides, including α-particle emitters, yielding output directly importable into 3D-RD-S.
Simplicit90Y
Simplicit90Y (Mirada Medical) is a software package developed for personalized 90Y-SIRT planning, incorporating multimodality images with a variety of rigid and deformable registration tools. It also includes calculation of dosimetry parameters with multicompartment, voxelwise techniques and pre- and posttreatment dosimetry. The application does not perform SPECT or PET image reconstruction but rather uses DICOM-formatted reconstructed tomographic image data. Simplicit90Y generates MIRD-schema phantom-based, organ-level absorbed-dose distributions (e.g., displayed as isodose contours) and DVHs based on the assumptions of complete physical decay in situ and local dose deposition.
RapidSphere Dosimetry Navigator and RapidSphere Tradeoff Explorer Navigator
The RapidSphere Dosimetry Navigator (Varian Medical Systems) is a software tool for 90Y-microsphere dosimetry. Conversion of the posttherapy SPECT/CT or PET/CT reconstructed image set is used to create an RTDose object representing the delivered dose (Gy). The user next defines the patient’s external body and lung contours or selects predefined contours to be used in the dosimetry calculation for the local deposition model. The local deposition model assumes that count levels are proportional to the injected activity of 90Y. β-particles released within a voxel are absorbed locally, and 90Y is eliminated by physical decay only. In the event that the entire lungs are not included in the RTDose object, the independently evaluated lung shunt fraction is entered by the user. The user also specifies structure-specific tissue densities and structures for DVH analysis during the exploration step. The RapidSphere Dosimetry Navigator, an interactive tool intended to be used retrospectively to assess how various parameters impact the 90Y-microsphere dose distribution, generates DVHs and isodose contours.
Voximetry Torch
Voximetry markets a software package called Torch, which incorporates an automated or manual dosimetry workflow. Torch is configured to use the parallel-processing capabilities of graphics-processing units to handle the successive steps of image registration, contour propagation, kinetic modeling, and radiation transport. A key component of this workflow is the software’s proprietary graphics-processing-unit–accelerated MC algorithm. Torch can be operated either in an automated click-and-go fashion or in a manual advanced mode. The first step is DICOM import of CT and PET or SPECT datasets for each time point. Currently, Torch does not perform SPECT calibration, so the user must input a calibration (e.g., cps/MBq) factor. Next, the user imports either a DICOM structure image set or ROI index files for at least one imaging time point. For multiple-time-point dosimetry, the user is required to import a set of ROIs for the first time point from external software. For subsequent time points, Torch will propagate the contours across time points using proprietary graphics-processing-unit–accelerated deformable registration algorithms, or users can import their own ROIs for these additional time points.
To calculate TIAs, Torch uses the Akaike information criterion to find the function that best fits the time–activity curves; the Akaike information criterion is an estimator of prediction error and therefore of the relative quality of statistical models for a given dataset. The user can accept the result, choose from other fitting functions, or manually adjust the parameters of the selected function. Trapezoidal integration followed by physical decay after the final time point may also be selected.
Next, a modified version of the MC code dose-planning method, optimized to operate on graphics processing units, is applied. Electron transport is done using the condensed history method, in which large energy transfers are accounted for in an analog manner and small energy transfers are accounted for by the continuous slowing-down approximation. After each step, the angular distribution of electrons is determined using step size–independent multiple-scattering theory. Photons are transported using a standard analog approach accounting for photoelectric absorption, Compton scattering, and, when applicable, pair production
Lastly, the radiation transport distribution is evaluated using DVHs and dose statistics. It is possible to generate a dosimetry report structured to meet the requirements for complex dosimetry billing codes in the United States. In addition, dose volumes can be exported in either DICOM-RT or raw format to be visualized in another software package—for example, for possible combination with external-beam radiotherapy.
Torch has been benchmarked and validated using both computational and physical phantoms. The dose calculation algorithm in Torch has been benchmarked against the GEANT4 MC code, using voxel S-value kernels in water and using patient datasets for multiple isotopes, including 90Y, 177Lu, 131I, and 223Ra. In addition, Torch has also been benchmarked using data provided by the OpenDose collaboration, which averages the results of 4 MC codes (electron γ-shower++ 2018, GATE 7.2, GATE 8.1, and GEANT4 10.5). Reference S values have been calculated for the International Commission on Radiological Protection adult male and female standard phantoms (43) for both monoenergetic sources and various isotopes, with better than ±5% agreement for all source-region–target-region combinations. Voximetry has also partnered with the University of Wisconsin Accredited Dosimetry Calibration Laboratory to design and acquire physical measurements to evaluate the accuracy of Torch. In measurements to date, excellent agreement has been observed between Torch-calculated and radiochromic film–measured 90Y depth-dose distributions in solid water.
DISCLOSURE
George Sgouros is a founding official of Rapid, the manufacturer of one of the dosimetry software products described in the paper. Brian Zimmerman is currently the Leader of the Radioactivity Group at NIST, and products and services offered by NIST are also described. Jacek Capala is a program director at the Clinical Radiation Oncology Branch in the Radiation Research Program of the National Cancer Institute and oversees a portfolio of research grants in the field of targeted radiopharmaceuticals therapy and its combination with other treatment modalities. Pat Zanzonico is a coinventor of intellectual property licensed to Y-mAbs Therapeutics and a paid consultant to Novartis. The opinions expressed in this publication are the author(s)’ own and do not reflect the view of the National Institutes of Health, the Department of Health and Human Services, or the United States government. No other potential conflict of interest relevant to this article was reported.
- © 2021 by the Society of Nuclear Medicine and Molecular Imaging.
REFERENCES
- Received for publication June 30, 2021.
- Revision received October 22, 2021.
In this issue


Jump to section
Related Articles
Cited By...
- Dosimetry of [177Lu]Lu-DOTATATE in Patients with Advanced Midgut Neuroendocrine Tumors: Results from a Substudy of the Phase III NETTER-1 Trial
- The MIRD Schema for Radiopharmaceutical Dosimetry: A Review
- MIRD Pamphlet No. 28, Part 1: MIRDcalc--A Software Tool for Medical Internal Radiation Dosimetry
- Dosimetry in Radiopharmaceutical Therapy
- Practical Considerations for Implementation of 177Lu-DOTATATE Neuroendocrine Tumor Treatment Programs
- Normal-Tissue Tolerance to Radiopharmaceutical Therapies, the Knowns and the Unknowns