


Abstract
The aim of this study was to determine the normal l-[methyl-11C]-methionine (11C-methionine) uptake and the extent of variation using standardized uptake value (SUV). Methods: Five healthy volunteers and 58 adult patients with normal 11C-methionine uptake were included in the interindividual analysis and 22 patients in the intraindividual analysis. SUVs in different brain regions, age-associated changes, correlation between 2 correction methods (for body weight [w-SUV] or body surface area [s-SUV]), and intraindividual reproducibility were examined. Results: w-SUVs were statistically different between the brain regions. The frontal or parietal cortex showed lower coefficients of variation than did the cerebellum or brain stem. There was no significant age-associated change. w-SUVs showed lower coefficients of variation in interindividual analysis and lower symmetric percentage change in intraindividual reproducibility than did s-SUVs. Conclusion: SUVs in the normal brain show inter- and intraindividual variation, and our proposed normal w-SUVs represent an important reference value.
The PET tracer l-[methyl-11C]-methionine (11C-methionine) is considered to accumulate preferentially in tumor tissue, with a low level of accumulation in normal brain tissue, and provides good contrast to highlight tumor uptake. The mechanism of increased uptake of 11C-methionine in tumors has been described as cellular proliferation (1) and microvessel count (2). In contrast, 18F-FDG accumulates preferentially in normal gray matter. Therefore, 11C-methionine is a useful PET tracer for imaging in neurooncology (3–5).
Although PET is highly valued because of its capability for quantification, 11C-methionine PET is interpreted mainly by comparison between 11C-methionine uptake in the lesion and that in the corresponding normal region in the contralateral hemisphere, known as the lesion-to-normal (L/N) ratio (6–8). The L/N ratio has been described because of the complicated substantial variation in 11C-methionine uptake. Therefore, little attention has been paid to the accumulation in normal brain tissue. However, the L/N ratio is a relative evaluation, and there are difficulties in comparing data among studies between individuals or within the same individual at different times.
On the other hand, in 18F-FDG PET in the torso, the index of accumulation is evaluated semiquantitatively with standardized uptake value (SUV) (9,10). To evaluate brain 11C-methionine PET using SUV, it is necessary to confirm both 11C-methionine uptake in the normal brain and the extent of variation. Moreover, the standardized method of correction of SUV and the reproducibility of SUV should also be confirmed.
In this study, we evaluated the normal 11C-methionine uptake in adults using SUV corrected for body weight (w-SUV) with regard to distributions in different parts of the brain (step 1) and age-associated changes (step 2). Next, we compared the w-SUV with another correction method, SUV corrected for body surface area (s-SUV) (step 3), and evaluated the differences in reproducibility by these 2 correction methods (step 4). On the basis of our results, we proposed the level of normal 11C-methionine uptake and the extent of variation using SUV.
MATERIALS AND METHODS
Subjects
Between November 1999 and October 2008, a total of 889 patients underwent 11C-methionine PET at Osaka City University Hospital. Exclusion criteria included the following: infiltrative grade II–IV neoplasms according to the World Health Organization classification (11), extraaxial tumors greater than 20 mm in diameter, edematous changes in the brain, history of radiotherapy or chemotherapy, and age less than 20 y.
A total of 5 healthy volunteers and 58 patients (25 men and 38 women; mean age ± SD, 43.5 ± 15.6 y; range, 20–77 y) thought to have normal 11C-methionine accumulation were included in the interindividual analysis (steps 1–3). Twenty-two patients undergoing multiple 11C-methionine PET studies (13 men and 9 women; mean age ± SD, 46.5 ± 15.8 y; range, 21–70 y) and thought to have normal 11C-methionine accumulation were included in the intraindividual analysis (step 4). Subject characteristics and the primary lesions are shown in Table 1. This PET study was approved by the Ethics Committee of Osaka City University Graduate School of Medicine. Informed consent was obtained from all patients and volunteers.
Patient Characteristics
Steps 1–4
In step 1, w-SUVs in the different parts of the brain (frontal cortex, parietal cortex, cerebellum, and brain stem) were evaluated in 63 subjects. The coefficients of variation (CVs) were compared by identifying the region showing the lowest variance and the best area to use as a reference for normal 11C-methionine uptake.
In step 2, w-SUVs in the right frontal cortex were evaluated to confirm the age-associated changes in 63 subjects.
Step 3 determined the correlation between 2 different correction methods. w-SUVs in the right frontal cortex were compared with s-SUVs in 63 subjects.
In step 4, w-SUVs and s-SUVs in the right frontal cortex were evaluated with regard to differences in intraindividual reproducibility to identify which method of correction had a lower symmetric percentage change in 22 subjects.
PET
PET was performed with an Eminence B PET scanner (Shimadzu) with a spatial resolution of 4.5 mm (in full width at half maximum) and a slice thickness of 5.6 mm. Patients were placed in the scanner so that slices parallel to the orbitomeatal line could be obtained. During a period of fasting, patients were injected intravenously with 11C-methionine at 6 MBq/kg over 30 s. After a transmission scan was obtained, a static scan of 10 min was begun 20 min after injection.
Imaging Analysis
The scans were interpreted by 2 experienced nuclear medicine radiologists. The PET images were reconstructed by measured attenuation correction. In both analyses, the region of interest (ROI) was placed manually in the axial plane within the frontal cortex, parietal cortex, cerebellum, and brain stem. The ROIs of the frontal cortex, parietal cortex, and cerebellum were demarcated manually within the lateral side of the gray matter by reference to the MRI data. In the brain stem, the ROI was placed over the whole of the brain stem at the middle pons level (Figure 1). Mean pixel counts in the ROI were normalized to SUV using the subject's body weight or body surface area with the following equation: SUV = [(mean pixel count/pixel volume)/(injected radioisotope activity/body weight or body surface area)] × calibration factor.

11C-methionine PET images in healthy subject. ROIs were enclosed manually in frontal cortex (F), parietal cortex (P), cerebellum (C), and brain stem (B).
Body surface areas were calculated using the DuBois formula: body surface area = (W 0.425 × H 0.725) × 0.007184 (12).
Statistical Analysis
The distributions in different parts of the brain were demonstrated using box-and-whisker plots and analyzed by 1-way repeated measures ANOVA and the Tukey–Kramer post hoc test. The degrees of dispersion of each SUV were compared with CVs. Age-associated changes were analyzed by linear regression analysis. The degrees of dispersion between w-SUV and s-SUV were compared with CVs.
To examine the intraindividual reproducibility of w-SUV and s-SUV, the first SUV and second SUV were compared in each by the paired t test. In the next step, the symmetric percentage change between first SUV and second SUV was calculated as follows and the results are shown as box-and-whisker plots: symmetric percentage change = 2|first SUV – second SUV|/(first SUV + second SUV) × 100(%).
In all statistical analyses, significance was defined as P less than 0.01.
RESULTS
Step 1: Distribution in Different Parts of Brain
w-SUVs (mean ± SD) were 1.136 ± 0.233 in the right frontal cortex, 1.257 ± 0.259 in the right parietal cortex, 1.468 ± 0.331 in the right cerebellum, and 1.477 ± 0.355 in the brain stem. Box-and-whisker plots are shown in Figure 2. There was a significant difference between the brain regions (P < 0.01, 1-way repeated-measures ANOVA). Statistically significant differences were demonstrated between the following regions: frontal cortex and cerebellum, frontal cortex and brain stem, parietal cortex and cerebellum, and parietal cortex and brain stem (P < 0.01, Tukey–Kramer). CVs in the frontal cortex (0.205) and parietal cortex (0.206) were lower than those in the cerebellum (0.226) and brain stem (0.240).
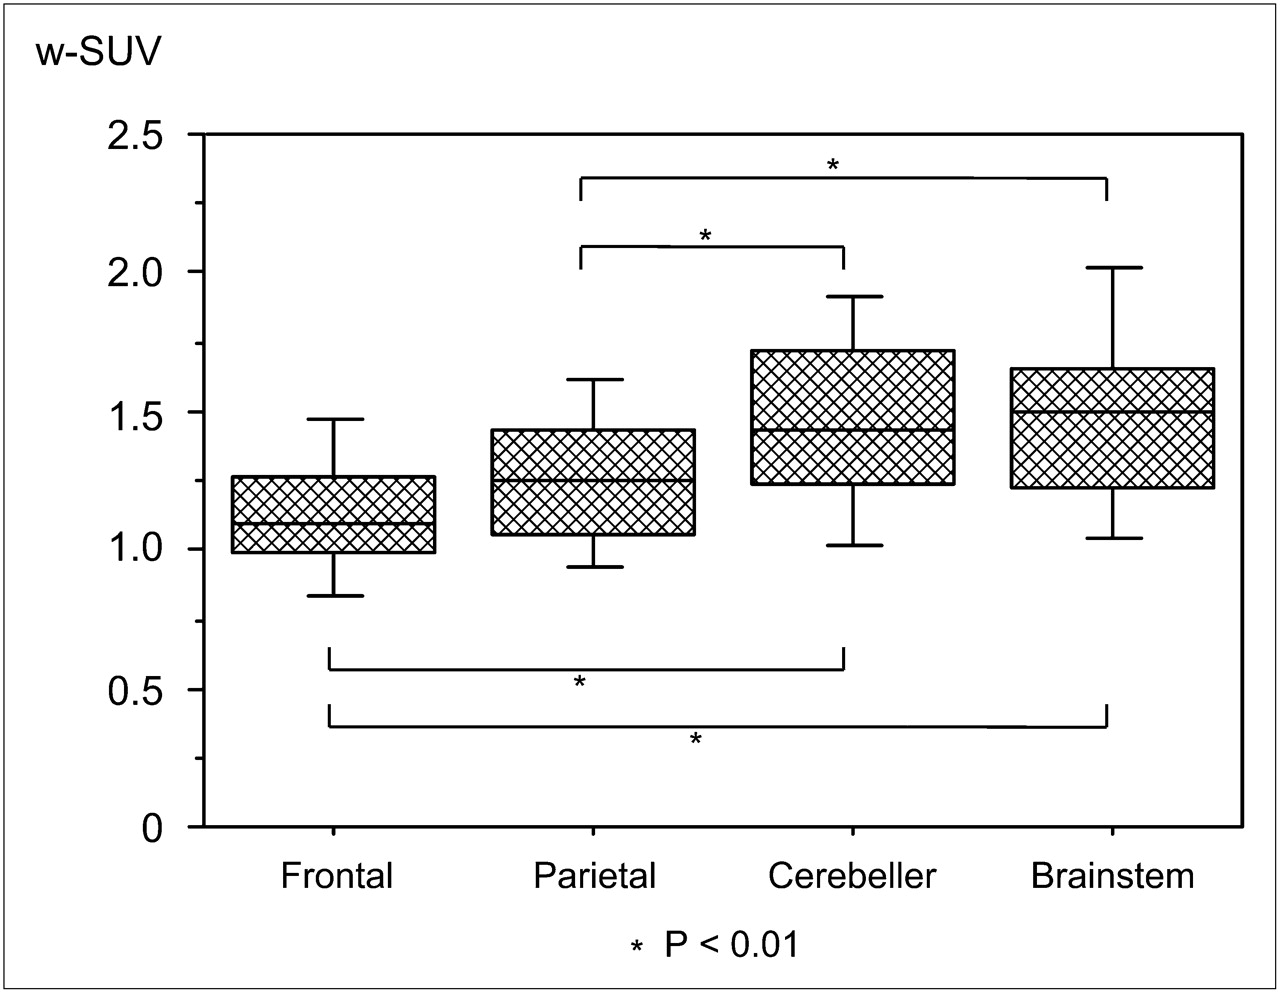
w-SUVs in different parts of brain are shown as box-and-whisker plots. Box plots indicate upper and lower quartiles, median, and range. Error bars indicate farthest points that are not outliers. Significant differences were observed between frontal cortex and cerebellum, frontal cortex and brain stem, parietal cortex and cerebellum, and parietal cortex and brain stem (P < 0.01).
Step 2: Age-Associated Changes
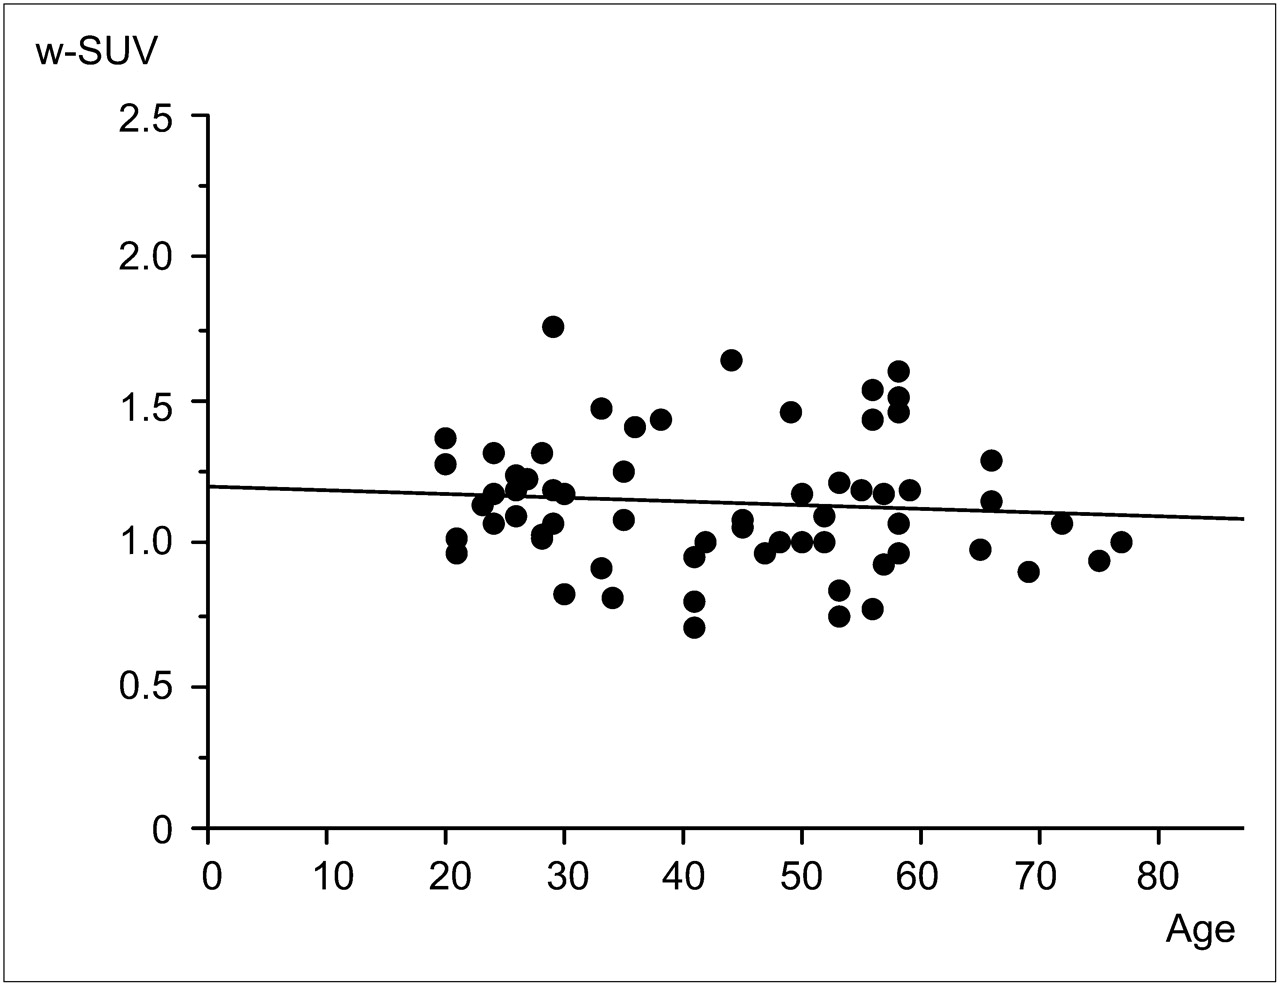
Regression analysis was performed, and the scatter plot is shown in Figure 3. Although a slight negative linear regression was suggested between aging and SUV, the regression coefficient was not statistically significant (P = 0.485).

Regression analysis and scatter graph for analysis of age-associated changes in w-SUV. Although slightly negative linear regression was suggested between aging and SUV, P value of regression coefficient was not statistically significant (P = 0.485).
Step 3: Correlation Between 2 Different Correction Methods
w-SUV was 1.137 ± 0.233, and s-SUV was 3.110 ± 0.656. CVs were 0.205 for w-SUV and 0.211 for s-SUV.
Step 4: Differences in Intraindividual Reproducibility Between w-SUV and s-SUV
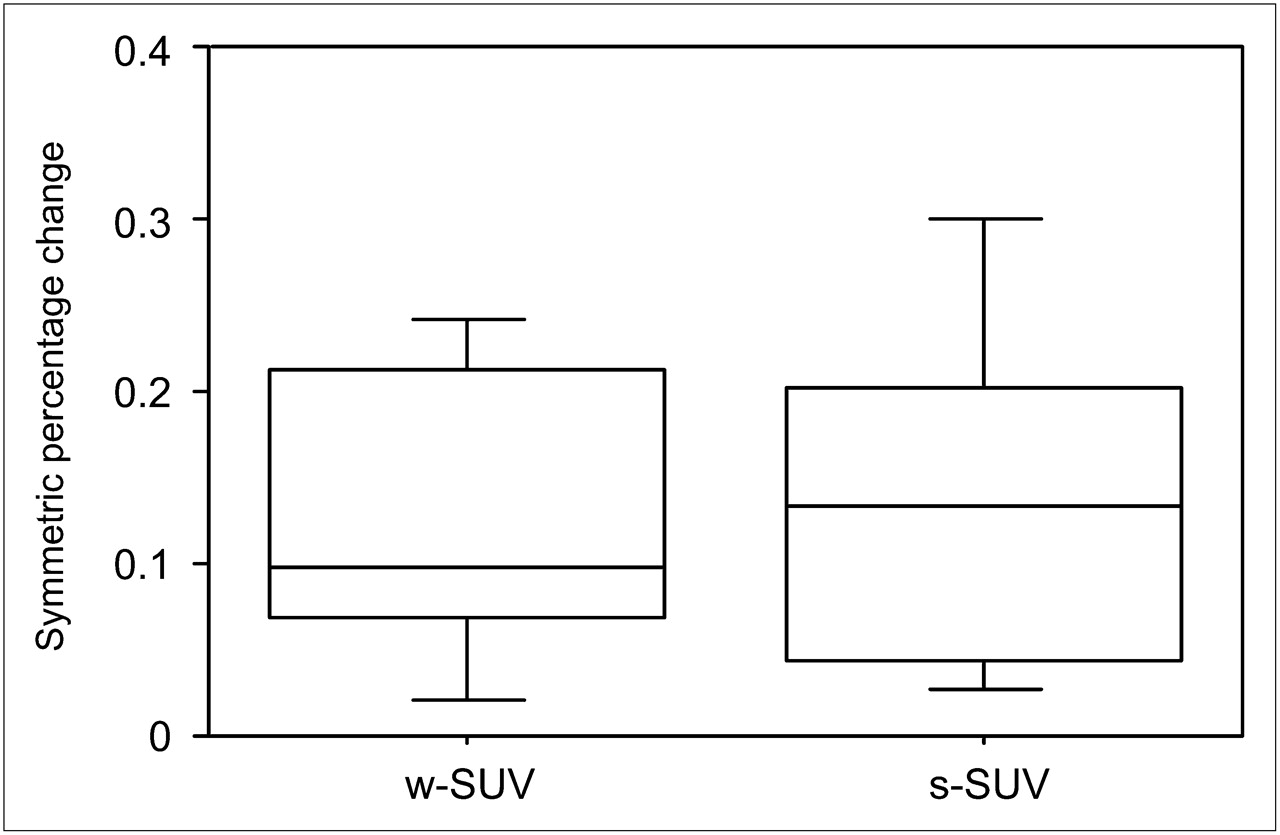
First w-SUV was 1.130 ± 0.211 and second w-SUV was 1.176 ± 0.160; first s-SUV was 3.005 ± 0.568 and second s-SUV was 3.162 ± 0.449. In both correction methods, there were no significant differences between the first and second PET analyses (P = 0.260 and P = 0.207, respectively). The symmetric percentage changes in w-SUV and s-SUV were 12.6% and 14.4%, respectively. Both are shown as box-and-whisker plots in Figure 4.

Symmetric percentage changes between first and second PET analyses in w-SUV and s-SUV are shown as box-and-whisker plots. Box plots indicate upper and lower quartiles, median, and range. Error bars indicate farthest points that are not outliers.
DISCUSSION
The substantial changes in free amino acid concentrations in the brain and rates of protein synthesis in the brain result in difficulty in normalizing 11C-methionine uptake (13). Moreover, age-associated changes in 11C-methionine uptake and methodologic differences may also influence the observed values. However, the extent of the influence of these factors has not been analyzed in detail. To our knowledge, this is the first clinical study to evaluate normal 11C-methionine uptake in a large population.
In the present study, the uptake values were significantly different in different parts of the brain. This difference was thought to be due not only to the differences in protein synthesis in each part of the brain but also to the differences in the gray–to–white matter ratio in manually demarcated ROIs. Therefore, we proposed the absolute SUV in each part of the brain. However, in cases in which 1 absolute value is required for interindividual comparison, the frontal or parietal cortex is a more appropriate region as a reference than the cerebellum or brain stem because of the low CVs.
Coope et al. also reported the difference of 11C-methionine uptake in each part of the brain (14). In their report, the relationship between the frontal cortex, parietal cortex, and cerebellum was similar to that in the present study, but the brain stem showed lower 11C-methionine uptake. This difference may have been due to the differences in ROI demarcation between the 2 studies.
Although O'Tuama et al. reported a marked age-dependent decline of 11C-methionine uptake in maturing humans and suggested this finding was derived from the developmental decline in the activity of the neutral amino acid transporter of the blood–brain barrier (13), in our subjects aged 20–77 y we did not find a significant correlation with aging, despite the slightly negative linear regression. Therefore, we concluded that age-associated changes do not need to be considered in normalizing the SUV.
Our results indicated that the more reasonable SUV correction method is w-SUV because of the lower CV in interindividual comparison and lower symmetric percentage change in intraindividual reproducibility.
Finally, we proposed the w-SUV in each part of the brain as an absolute reference value: 1.137 ± 0.233 in the frontal cortex, 1.257 ± 0.259 in the parietal cortex, 1.468 ± 0.331 in the cerebellum, and 1.477 ± 0.355 in the brain stem. It is clear that SUVs in the normal brain have inter- and intraindividual variance to some extent. Our proposed normal uptake value will become an important reference value, especially in the case of midline, bilateral, or whole-brain lesions.
Further studies are needed to evaluate each brain lesion or the progression of brain lesions within the same individual using SUV.
CONCLUSION
The present study indicates the importance of confirming the value of 11C-methionine accumulation in the normal brain, especially for comparison of multiple scans in 1 patient or comparison with scans from other patients. The absolute w-SUVs in each region of the brain were 1.137 ± 0.233 in the frontal cortex, 1.257 ± 0.259 in the parietal cortex, 1.468 ± 0.331 in the cerebellum, and 1.477 ± 0.355 in the brain stem.
Acknowledgments
We thank Drs. Susumu Shiomi and Shigeaki Higashiyama for their help with this study and Technologists Yoshihiro Shimonishi and Hiroyuki Tsushima at the Central Radiology Department of Osaka City University Medical School for their technical support in PET.
Footnotes
-
COPYRIGHT © 2010 by the Society of Nuclear Medicine, Inc.
References
- Received for publication July 30, 2009.
- Accepted for publication November 5, 2009.


