


Abstract
The purpose of this study was to prospectively determine whether combined MRI and 18F-FDG PET is more accurate than MRI in assessing nonbenign uterine smooth muscle tumors (USMTs). Methods: Seventy patients (mean age, 49 ± 10 y; range, 28–77 y) suspected of having nonbenign USMTs underwent both MRI and 18F-FDG PET before surgery. Results were evaluated using receiver-operating-characteristic (ROC) analyses and the Cochran Q test. Results: The area under the ROC curve for MRI with 18F-FDG PET was significantly higher than that for MRI (0.97 vs. 0.89, P < 0.05). Although multiple comparisons using the Cochran Q test were not significant, the sensitivity, specificity, and accuracy for MRI with 18F-FDG PET with probable nonbenign USMT cases considered to be positive were higher than those for MRI (93.3% vs. 73.3%; 92.7% vs. 85.5%; and 92.9% vs. 82.9%, respectively). Conclusion: MRI with 18F-FDG PET is useful in assessing nonbenign USMTs, as compared with MRI.
Uterine leiomyoma is a common benign uterine smooth muscle tumor (USMT) that occurs in 20%–25% of women over 30 y of age (1,2). The management of leiomyomas is dependent of patient age, symptoms, and clinician skill. Determining the indications for surgical treatment requires careful judgment (1). Uterine leiomyoma is an indication for approximately 30% of all hysterectomies performed (2). However, approximately 80% of hysterectomies performed for uterine leiomyoma are judged as inappropriately recommended because of a “suspected nonbenign tumor” based on tumor size (3–5). Thus, differentiating benign from nonbenign USMTs is one of the most important clinical problems. As preoperative histologic examination of myometrial lesions is not possible, imaging plays an important role in evaluation of myometrial lesions. The usefulness of an MRI in the workup of USMTs is well known (6–9); however, even when using MRI, it is difficult to distinguish between leiomyosarcoma (LMS), a rare neoplasm that is the most common and aggressive malignant USMT (10), and leiomyoma, particularly when degeneration is evident (6–9). Increased uptake on PET with 18F-FDG PET has emerged as a promising oncologic imaging tool (11). Although there have been some case reports and small series (12–14), to the best of our knowledge, a systematic investigation of 18F-FDG uptake in USMTs has yet to be described. The purpose of this study was to prospectively determine whether combined MRI with 18F-FDG PET is more accurate than MRI in assessing nonbenign USMTs.
MATERIALS AND METHODS
Patients
Two experienced gynecologic oncologists recruited 84 participants among 772 patients who visited our outpatient clinic with USMT-related symptoms between October 1, 2002, and March 30, 2007, with a diagnosis of “suspected nonbenign USMT” for the following reasons: the patient had a “rapid growth USMT,” in which the mass doubled in size within 6 mo (4,5); the patient had an “enlarged soft USMT” based on the results of pelvic examination; and the patient's ultrasound showed an enlarged tumor with the characteristic “mosaic pattern” on ultrasonic power Doppler images (13). This study was approved by the Institutional Review Board of our institution, and informed consent was obtained from all participants.
Subsequently, 14 of the 84 patients were excluded for the following reasons: they had abnormal endometrial cytology; they did not undergo surgery; or they underwent 18F-FDG PET and MRI more than 2 wk before surgery. Thus, within 2 wk before surgery, 70 patients (mean age, 49 ± 10 y; range, 28–77 y) underwent both MRI and 18F-FDG PET.
MRI
MRI was performed on all patients using a 1.5-T system (Sigma; GE Healthcare). The pelvic imaging protocol included axial, coronal, and sagittal T1-weighted gradient-echo sequences (TR/TE, 89.3/4.1), as well as T2-weighted turbo-spin-echo sequences (2,800/138). The technical parameters were as follows: slice thickness, 6 mm; acquisitions, 2; and field of view, 300 × 300 mm. To detect fat within the tumor, a fat-saturation technique was used on both T1- and T2-weighted images (T1WI, T2WI). Contrast-enhanced T1WI were not acquired in the present series.
18F-FDG PET
All subjects underwent PET with a whole-body tomography scanner (Advance; GE Healthcare) that permits simultaneous acquisition of 35 image slices with interslice spacing of 4.25 mm. Performance tests showed intrinsic resolution of 4.6–5.7 mm and 4.0–5.3 mm in the transaxial and axial directions, respectively. After fasting for at least 12 h before tracer administration, each patient was injected intravenously with approximately 185 MBq of 18F-FDG, a commonly used dose for 18F-FDG scans in Japan.
Fifty minutes after 18F-FDG administration, a 16-min whole-body emission scan began with 3 min at the pelvic region (2 bed positions) and 2 min in each remaining region (5 bed positions) to completely cover the head to inguinal areas. Postinjection transmission scans with 2 min at the pelvis and 1 min in other areas were obtained after the emission scans and in the same bed positions as the emission scans using a 68Ge/68Ga rod source for attenuation correction. The acquired data were reconstructed using the iterative reconstruction method selecting 14 subsets and 2 iterations. The reconstructed image was then converted to a semiquantitative image corrected for injection dose and subject body weight (= standardized uptake value [SUV]) for data analysis (15).
MRI Analysis
MRI analysis was performed by 2 reviewers unaware of all clinical data. The signal intensity of the mass was evaluated as high on T1WI when its signal was higher than that of fatty bone marrow in the pubic symphysis (9). On T2WI, signal intensity of the mass was evaluated as high when its signal was more than 33% higher than that of the outer myometrium. The signal intensity patterns were graded subjectively on a 4-point scale as follows: score 0, low signal intensity on both T1WI and T2WI (benign); score 1, low signal intensity on T1WI and high signal intensity on T2WI (equivocal); score 2, high signal intensity on T1WI with or without high signal intensity on T2WI (probably nonbenign); and score 3, high signal intensity on both T1WI and T2WI (nonbenign).
18F-FDG PET Image Analysis
PET images were qualitatively and quantitatively evaluated by 2 reviewers who were unaware of all clinical data. In accordance with previous studies (15), physiologic liver uptake was used as the reference point. Qualitative estimation of lesions on 18F-FDG PET images was performed visually using a 4-point scale as follows: score 0, less-than-liver 18F-FDG uptake (benign); score 1, equivalent-to-liver 18F-FDG uptake (equivocal); score 2, moderate 18F-FDG uptake, which is higher than the liver but less than the brain (probably nonbenign); and score 3, strong 18F-FDG uptake, equivalent to brain uptake (nonbenign). For quantitative evaluation of regional radioactivity using 18F-FDG PET images, circular regions of interest of 8 mm in diameter were manually placed on the tumor image. The SUVs were obtained from 5 regions of interest of high radioactivity accumulation as visualized in the tumor, and the mean SUV was then calculated for each tumor.
Image Analysis of MRI with 18F-FDG PET
Consensus diagnoses for nonbenign USMTs were made based on both the 18F-FDG PET and MRI scores. Each tumor was graded subjectively using a 4-point scale based on the following total scores: benign, total score 0–1; equivocal, total score 2–3; probably nonbenign, total score 4–5; and nonbenign, total score 6.
Histopathologic Evaluation
The pathologist was unaware of all clinical data when reviewing the histopathology of surgically removed tumors. USMTs were classified based on the World Health Organization histologic classification system (10). In this study, we used the term uterine smooth muscle tumors of uncertain malignant potential (USMTsUMP) for nonbenign USMTs.
Statistical Analysis
MRI and 18F-FDG PET findings were interpreted in 3 ways: MRI alone, 18F-FDG PET alone, and MRI with 18F-FDG PET. The probability of each USMT being nonbenign was assigned a score using a 4-point scale. Histopathologic assessment after hysterectomy was used as the standard of reference, and receiver-operating-characteristic (ROC) curves were generated from the imaging assessment scores. The “rocgold” command was used to calculate the area under the curve and multiple comparisons with Bonferroni correction (16–18). When findings of probable nonbenign USMTs were considered as positive, we analyzed differences in sensitivity and specificity among the imaging modalities using the Cochran Q test (18,19). The unpaired Student t test was used to test for significant differences in age, tumor size, and SUV between nonbenign and benign USMTs. Interobserver agreement of the MRI and PET readings was assessed by Cohen's κ-statistics (20). A P value of less than 0.05 was considered to indicate a statistically significant difference. All statistical tests were performed using commercially available software (SPSS 8.0; SPSS, and Stata 8.0; StataCorp).
RESULTS
Of the 70 study patients, 15 had a final diagnosis of nonbenign USMTs, whereas 55 had a benign USMT. Histopathologic diagnoses and difference in the patient population are shown in Table 1. In the assessment of nonbenign USMTs, the areas under the ROC curves for MRI, 18F-FDG PET, and MRI with 18F-FDG PET were 0.89 (95% confidence interval [CI], 0.82–0.97), 0.96 (95% CI, 0.93–1.00), and 0.97 (95% CI, 0.95–1.00), respectively (Fig. 1). The area under the ROC curve for MRI with 18F-FDG PET was significantly higher than that for MRI (P < 0.05). Although not significant, MRI with 18F-FDG PET was slightly higher than 18F-FDG PET (P = 0.32), and 18F-FDG PET was marginally superior to MRI (P = 0.05). For MRI and 18F-FDG PET, the κ-values for the 2 reviewers were 0.68 (95% CI, 0.52–0.83) and 0.86 (95% CI, 0.69–0.99), respectively, indicating good and very good interobserver agreement with regard to nonbenign USMTs.

Results of ROC analysis with histologic results used as reference standard. ROC curve generated for presence of nonbenign USMT demonstrates improved accuracy for MRI with 18F-FDG PET when compared with MRI alone.
Clinical and Histopathologic Findings in 70 Patients Suspected of Having Nonbenign USMTs
Sensitivity, specificity, and accuracy were calculated for each modality, and probable nonbenign USMT cases considered to be positive are summarized in Table 2. As indicated in the table, MRI had positive findings in 19 cases, of which 8 were false-positives, consisting of 1 case of hemorrhagic cellular variant, 5 cases of myxoid variants, 1 case of myxoid variant with adenomyosis, and 1 case of uncomplicated leiomyoma with adenomyosis. MRI had negative findings in 51 cases, of which 4 were false-negatives, consisting of 1 case of LMS and 3 cases of USMTsUMP.
Analysis of Accuracy of 18F-FDG PET, MRI, and MRI Plus 18F-FDG PET
18F-FDG PET had positive findings in 17 cases, of which 4 were false-positives, consisting of 2 cases of myxoid variants and 2 cases of uncomplicated leiomyomas. 18F-FDG PET had negative findings in 53 cases, of which 2 were false-negatives, consisting of 1 case of LMP and 1 case of USMTsUMP.
MRI with 18F-FDG PET had positive findings in 18 cases (Fig. 2), of which 4 were false-positives, consisting of 3 cases of myxoid variants (Fig. 3) and 1 case of hemorrhagic cellular variant. Only 1 case of USMTsUMP was a false-negative (Fig. 4).

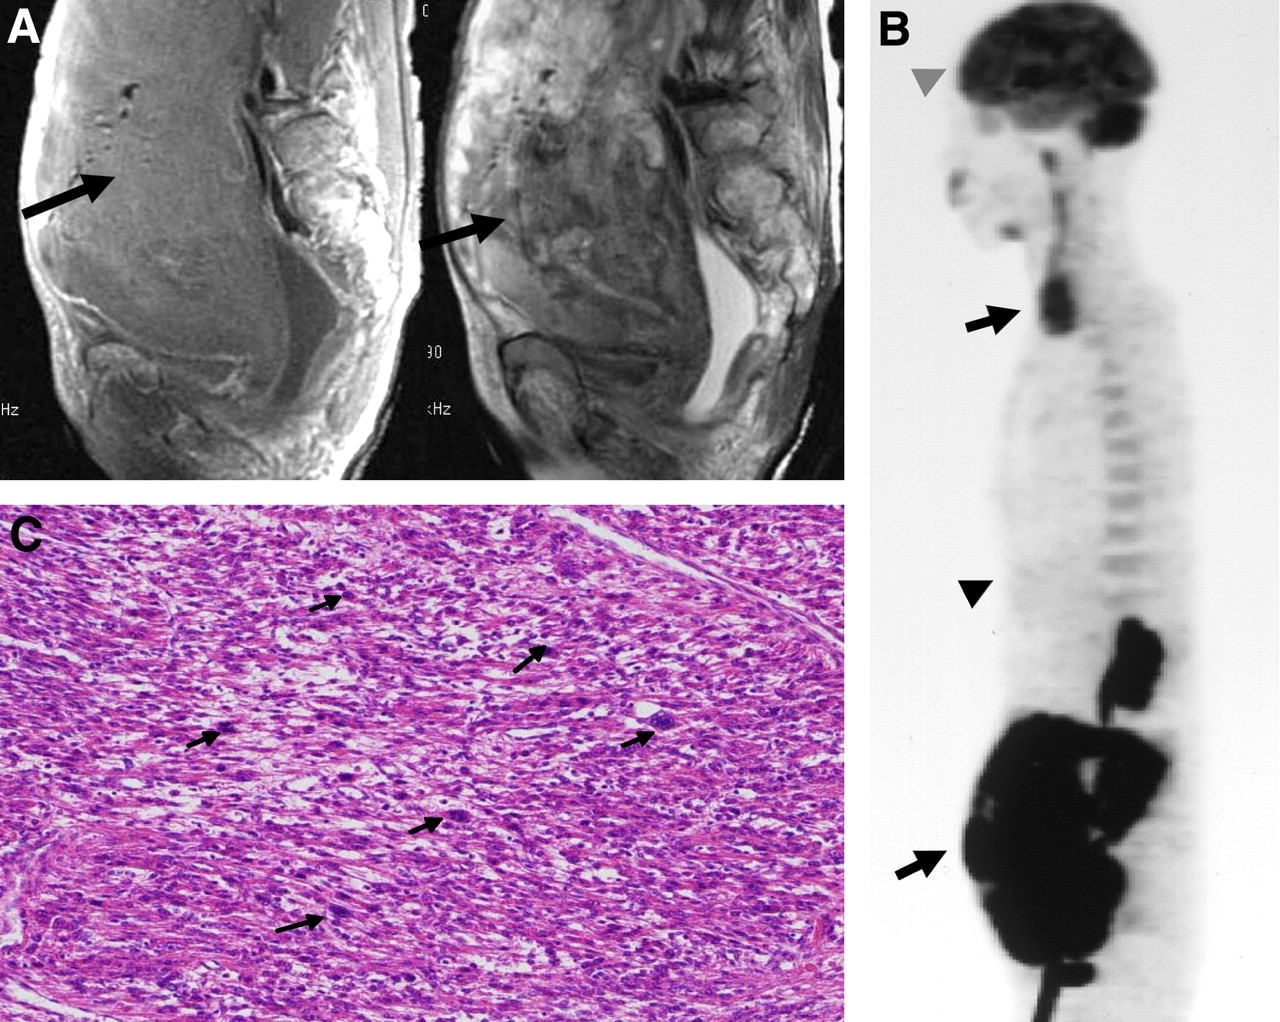
A 66-y-old woman with LMS. (A) Sagittal MRI shows large tumor with heterogeneous high signal intensity (arrow) on T1-weighted (left) and T2-weighted (right) images (MRI score, 3). (B) Sagittal 18F-FDG PET shows 18F-FDG uptake (top arrow indicates physiologic uptake in vocal cords, bottom arrow indicates USMT, bottom arrowhead indicates liver, and top arrowhead indicates brain) equivalent to that in brain (PET score, 3). Consensus score was “nonbenign.” (C) Histopathologic section of this tumor demonstrates LMS (hematoxylin-eosin stain, ×40. Arrows indicate mitotic figures).

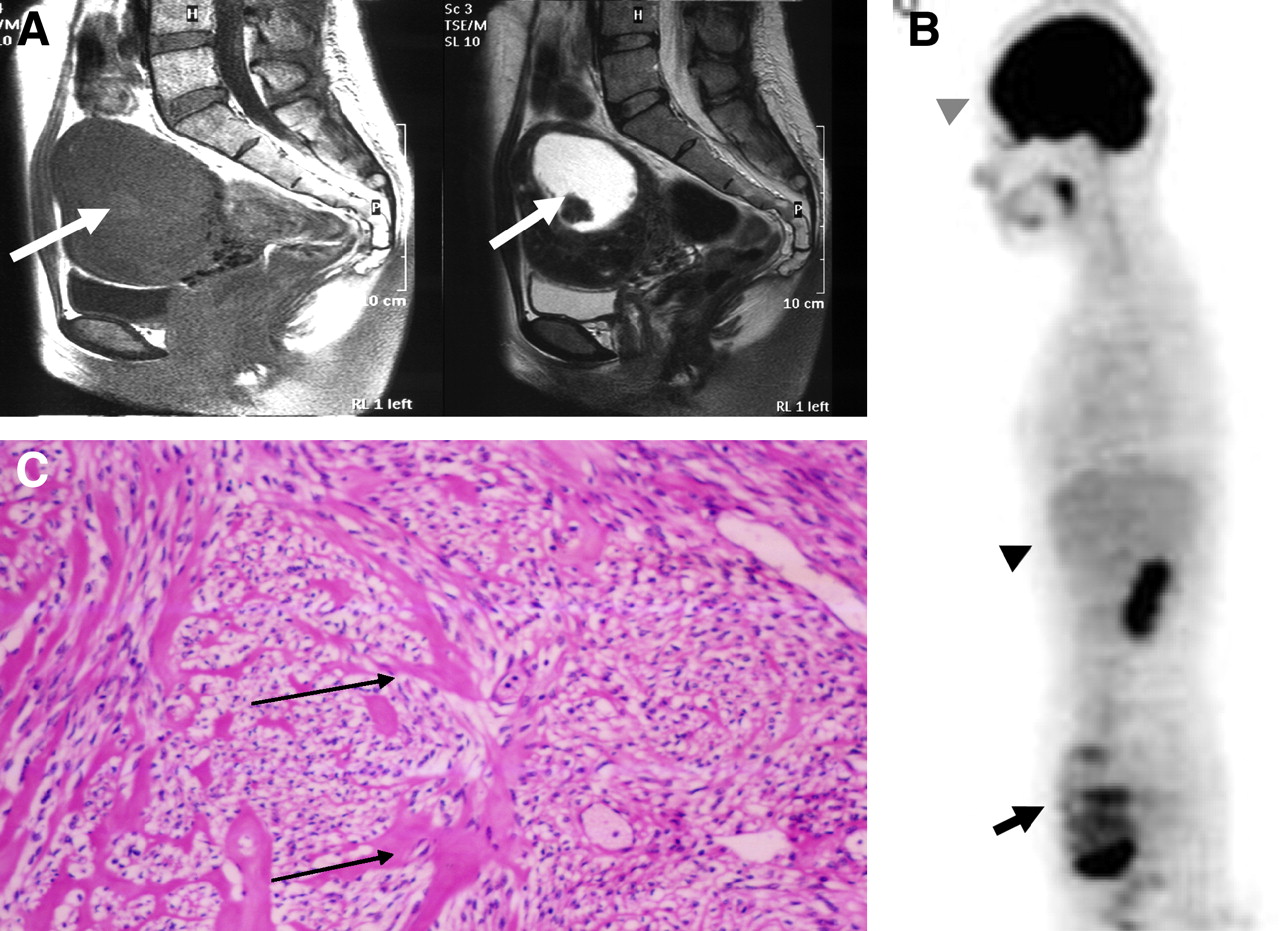
A 38-y-old woman with myxoid variant leiomyoma. (A) Sagittal MRI shows uterine mass with spotty pocket of high (arrow) signal intensity on T1-weighted (left) images and background of low signal intensity and a mass with central high (arrow) signal intensity on T2-weighted (right) images (MRI score, 3). (B) Sagittal 18F-FDG PET shows diffuse high (arrow) 18F-FDG uptake (arrow indicates USMT, bottom arrowhead indicates liver, and top arrowhead indicates brain) with multispots (PET score, 2). Consensus score was “probably nonbenign.” (C) Histopathologic section of this tumor reveals myxoid variant leiomyoma (hematoxylin-eosin stain, ×100. Arrows show myxoid degeneration).

A 38-y-old woman with USMTs of uncertain malignant potential. (A) Sagittal MRI shows uterine mass with low signal intensity (arrow) on T1-weighted (left) and T2-weighted (right) images (MRI score, 0). (B) Sagittal 18F-FDG PET shows equivalent-to-liver 18F-FDG uptake (arrow indicates USMT, bottom arrowhead indicates liver, and top arrowhead indicates brain) with multispots (PET score, 1). Consensus score was “benign.” (C) Histopathologic section of the tumor confirms uncertain malignant potential (hematoxylin-eosin stain, ×100. Arrows indicate severe cytologic atypia).
Thus, although no significance was seen on multiple comparisons (sensitivity, P = 0.174; 1 − specificity, P = 0.135), the sensitivity, specificity, and accuracy of MRI with 18F-FDG PET was higher than that of MRI alone (93.3% vs. 73.3%, 92.7% vs. 85.5%, and 92.9% vs. 82.9%, respectively) (Table 2). On quantitative PET analysis, there was a significant difference in SUVs between nonbenign (7.9 ± 1.1; range, 2.7–13.1) and benign USMTs (1.8 ± 0.9; range, 0.7–6.3) (P < 0.05).
DISCUSSION
In the present study, MRI with 18F-FDG PET was shown to be more accurate than MRI in assessing nonbenign USMTs. This improvement is presumably because visual correlations between MRI and 18F-FDG PET could alleviate the main diagnostic difficulties inherent in MRI, including some false-positive findings caused by leiomyoma with the presence of myxoid degeneration.
Whole-body imaging by 18F-FDG PET in the assessment of nonbenign USMT may provide important information in detecting unexpected metastatic sites, but lesion localization is difficult. PET/CT provides both metabolic information and anatomic information. Furthermore, PET/MRI is desirable because MRI provides good soft-tissue contrast and does not require ionizing radiation.
In quantitative PET analysis, the SUV of nonbenign USMTs is significantly higher than that of benign USMTs; however, there were some overlapping cases. These overlapping cases do not generally allow exclusion of nonbenign USMTs with sufficient confidence, particularly in small tumors or at early stages. Ten of the 772 patients (1.3%) had LMS; hence, the population in this study is a reasonable representation of the number of actual patients suspected of having malignant USMTs (3–5).
A potential criticism of the present study is that we did not take contrast-enhanced T1WI MRI findings into consideration, as a contrast enhancement medium could not be used in some patients, and a recent study reported the typical features of uterine LMS on MRI based on T1WI and T2WI findings (8). This may account for the relatively inferior sensitivity and specificity of MRI when compared with 18F-FDG PET and MRI with 18F-FDG PET.
CONCLUSION
MRI with 18F-FDG PET is useful in assessing nonbenign USMTs compared with MRI alone. This study suggests that high suspicion of nonbenign USMTs after physical examination and ultrasound is a useful indication for MRI with 18F-FDG PET. When combined with even limited MRI, 18F-FDG PET may provide a rationale for conservative management of patients with USMT, thus reducing the number of patients undergoing unnecessary surgery.
Acknowledgments
We thank Takahiro Tsuji, of Fukui National Hospital, for his clinical support and comments. We are also grateful to Seiko Kato for assistance with manuscript preparation. This study was partly funded by the Research and Development Project Aimed at Economic Revitalization (Leading Project) from MEXT Japan, and the 21st Century COE Program (Medical Science) from the Japan Society for the Promotion of Science.
Footnotes
-
COPYRIGHT © 2008 by the Society of Nuclear Medicine, Inc.
References
- Received for publication June 26, 2007.
- Accepted for publication January 16, 2008.


