


Abstract
The continued development of antisense targeting will require a better understanding of the mechanism. Methods: We performed initial studies of the mechanism of intracellular antisense targeting through measurements of in situ transcription, immunofluorescence, reverse transcription polymerase chain reaction (RT-PCR), 32P-labeled uridine-5′-triphosphate (α-32P-UTP) incorporation, nuclear accumulations of 99mTc-labeled DNAs, and messenger RNA (mRNA) transcription rate. As reported earlier, an antisense DNA against the mdr1 mRNA coding for P-glycoprotein (Pgp) and its sense DNA control were used in KB-G2 (Pgp++) cells. Results: Definitive evidence for antisense targeting was obtained by in situ transcription showing complementary DNA elongation in cells exposed to antisense DNA, acting therefore as an intracellular PCR primer of mdr1 mRNA, but not in cells exposed to sense DNA. Immunofluorescence staining showed higher accumulations of antisense versus sense DNAs in KB-G2 cells. Transnuclear migration was confirmed by higher accumulations in the nucleus compared with the cytoplasm in cells incubated with 99mTc-labeled antisense DNA. However, the observed specific accumulations of antisense DNAs of about 106 per cell over 10 h could not be explained by a feedback mechanism upregulating transcription in cells exposed to antisense DNA as no increase in mRNA levels was detected by both RT-PCR and 32P-UTP in these cells. To explore an alternative hypothesis, a novel approach using 99mTc-labeled antisense DNA as a probe of total mRNA from cells previously saturated with unlabeled antisense DNA was used to estimate the transcription rate. Compared with controls, mdr1 mRNA levels were found to be initially low after saturation and to recover at about 2,000 copies per minute per cell. If persistent, this transcription rate would provide 106 mRNAs in 10 h. Conclusion: The results of all studies are consistent with antisense as the mechanism of targeting. Though a feedback mechanism leading to upregulation of mRNA transcription is an unlikely explanation for the high specific accumulations, our results may be explained if antisense DNAs are targeting mdr1 mRNAs produced at high transcription rates. If the target is primarily pre-mRNA in the nucleus rather than mature mRNA in the cytoplasm, this would provide as well an explanation for the observed migration of 99mTc-labeled antisense DNA into the nucleus.
Our laboratories are evaluating radiolabeled antisense (AS) oligomers as potential imaging and radiotherapy agents (1–3). Recent reports show that targeting of tumor by an AS mechanism has been demonstrated in cell culture (3,4) and suggest strongly that tumor targeting by an AS mechanism has also been demonstrated convincingly in vivo in mice with tumors (2). Nevertheless, an improved understanding of the mechanism whereby AS oligomers gain access to cells and bind to their target messenger RNA (mRNA) would clearly be beneficial in the development of AS imaging. For example, in the course of the these studies, the number of AS DNAs accumulating per tumor cell was found to be in the order of 106–107 over 10–24 h. These values are higher than expected on the basis of the steady-state mRNA levels generally thought to be around 10–1,000 per cell. It is possible that studies designed to help establish the mechanism of AS targeting would provide explanations for this and other perceived anomalies.
This report describes the results of the initial series of experiments from our laboratories to explore the mechanism of AS targeting of tumor cells. As before, our preferred mRNA target was that coding for the mdr1 protein associated with multidrug resistance and the preferred cell type was the KB-G2 cell, a transfectant of the KB-31 human epidermoid carcinoma cell upregulated to overexpress the target mRNA.
The studies included in situ transcription (IST) in which both KB-G2 and KB-31 cells were incubated with both the AS and sense (S) DNAs and, after permeation and fixation, subject to the transcription reaction in situ. Only those mRNAs to which DNA is bound can act as the primer for elongation. We believe that positive results in this study would provide the first direct evidence for AS targeting. Further evidence for AS targeting could be obtained by immunofluorescence if staining of permeated and fixed KB-G2 cells show AS DNA located at the mRNA sites. The possibility that the intracellular presence of the AS DNA results in upregulation of transcription leading to increased concentrations of the target mRNA can be explored both by reverse transcription polymerase chain reaction (RT-PCR) and by incubation with 32P-labeled uridine 5′-triphosphate (α-32P-UTP). If KB-G2 cells are incubated with unlabeled AS and S DNAs and upregulation occurs leading to increases in mRNA levels, this should be evident by semiquantitative RT-PCR and by increased counts in total RNA after incubation with α-32P-UTP. Finally, an important criterion of AS targeting appears to be transcription rate. In the course of this investigation, it became apparent that an estimate of the transcription rate may be helpful in explaining the high number of AS DNAs accumulating per tumor cell. A measure of transcription rate may be possible if KB-G2 cells are first incubated with unlabeled AS DNA at saturating levels followed by extraction of total mRNA by oligo(dT) affinity chromatography and probing with radiolabeled AS DNA as a measure of target mRNA concentration. If these studies are repeated at various times after saturation, it may be possible to estimate the rate at which target mRNAs regenerate. We report herein the results of these measurements.
MATERIALS AND METHODS
Oligonucleotides
All DNAs were 20-mer uniform phosphorothioate (Integrated DNA Technologies, Inc.). The base sequences of mdr1 AS DNA (5′-CCATCCCGACCTCGCGCTCC) and S DNA (5′-GGAGCGCGAGGTCGGGATGG) were as previously selected (3) and were obtained with a primary amine on the 5′-end attached through a 6-carbon alkyl linker. The DNAs were also purchased in their native form (without the terminal amine group and linker) and also with a biotin group attached to the 5′-end. The S-acetyl NHS-MAG3 (MAG3 = mercaptoacetyltriglycine) was synthesized in house (5), and the structure was confirmed by elemental analysis, proton nuclear magnetic resonance, and mass spectroscopy. The 99mTc-pertechnetate was eluted from a 99Mo-99mTc generator (Bristol-Myers Squibb Medical Imaging, Inc.). The uridine-5′-triphosphate (α-32P–UTP) was purchased (Perkin-Elmer). The basic sequence of AS β-actin DNA (5′-GGTCTCAAACATGATCTGGG) (GeneBank accession no., BC016045; nucleotides 434–453) was selected as an internal reference.
Cell Culture and DNA Accumulation
The KB-G2 (Pgp++ [Pgp = P-glycoprotein]) and KB-31 (Pgp+) human epidermoid carcinoma cell lines were provided as a gift by Isamu Sugawara (Research Institute of Tuberculosis, Tokyo, Japan) and were cultured in Dulbecco's modified Eagle media (DMEM) (Gibco BRL Products) containing 10% fetal bovine serum (FBS). Incubations were for 18–24 h at 37°C, 5% CO2 unless otherwise noted. Cells were cultured until reaching about 60%–70% confluence. For all passive accumulation studies, cells were rinsed with serum-free DMEM and incubated with 100 nmol/L of DNAs in DMEM for 2 h. For accumulation of DNA complexed with a cationic lipid, TransFast Reagent (Promega) was mixed with DNA at a ratio of 1 μg DNA/3 μL of lipid according to the manufacturer's instructions and again used at a final DNA concentration of 100 nmol/L in serum-free DMEM. After incubation for 2 h, cells were rinsed 3 times with DMEM plus 10% FBS and then allowed to grow for 12 h in DMEM with 10% FBS. The use of TransFast Reagent was restricted to the study of IST.
DNA Conjugation and Radiolabeling
DNAs with a primary amine on the 5′-end were conjugated with S-acetyl NHS-MAG3 as previously described (6,7). Briefly, a solution of 1,000 μg DNAs in 200 μL of 0.2 mol/L N-(2-hydroxyethyl)piperazine-N′-(2-ethanesulfonic acid) buffer (pH 8.0) was added to a vial containing S-acetyl NHS-MAG3 to a final MAG3/DNA molar ratio of 15:1. The vial was vortexed immediately and incubated for 1 h at room temperature. The DNA was then purified on a 0.7 × 20 cm P4 column (Bio-Rad Laboratories) with 0.25 mol/L NH4OAc buffer, pH 5.2, as eluant. The peak fractions were pooled and adjusted from pH 5.2 to pH 7.6 with a pH 9.2 buffer (0.5 mol/L Na2HCO4, 0.25 mol/L NH4OAc, 0.175 mol/L NH3). After heating for 20 min, the DNA was again purified over P4 using the buffer as eluant. The peak fractions were pooled and quantitated by ultraviolet spectrophotometry at 265 nm.
Radiolabeling of the MAG3-coupled DNAs was achieved by introducing about 37 MBq (1 mCi) of the 99mTc-pertechnetate generator eluate into a combined solution of 50 μL (about 5 μg) MAG3-conjugated DNAs in the pH 5.2 NH4OAc buffer, 10 μL of 50 μg/μL Na2tartrate·2H2O in the pH 9.2 buffer, and 4 μL (1 μg/μL) SnCl2·2H2O in ascorbate-HCl solution (1 μg/μL sodium ascorbate in 10 mmol/L HCl). The final pH was 7.6. After vortexing and then heating for 20 min in boiling water, the labeling solution was evaluated by C18 SepPak (Waters) in which the first elution with phosphate-buffered saline (PBS) removes radiolabeled pertechnetate and tartrate, the second elution with 40% acetonitrile removes radiolabeled DNAs, and the SepPak retains radiolabeled colloids. In all cases, the radiochemical purity exceeded 90% without purification.
IST
Both KB-G2 and KB-31 cells were incubated with mdr1 AS and S DNAs and with β-actin AS DNA as control, always at 100 nmol/L (8). Cells were treated for 2 h with naked DNAs or DNAs complexed with TransFast Reagent. Thereafter, cells were trypsinized and plated at 20,000 cells per 12-mm round glass coverslip in 24-well dishes (BD Falcon) containing DMEM plus 10% FBS. Cells were washed in cytoskeletal extraction buffer (CSK buffer: 0.3 mol/L sucrose, 0.1 mol/L KCl, 5 mmol/L MgCl2, 10 mmol/L piperazine-N,N′-bis(2-ethanesulfonic acid), pH 6.9, 2 mmol/L ethylene glycol-bis(2-aminoethylether)-N,N,N′,N′-tetraacetic acid, 1 μg/mL leupeptin (Sigma), 1 μg/mL trypsin inhibitor (Sigma), and 1.2 mmol/L phenylmethylsulfonyl fluoride (Sigma)), and then permeabilized with 0.5% Triton X-100 (Sigma) in CSK buffer for 90 s on ice. Treated cells were fixed directly in 4% formaldehyde in K-PBS (1 mmol/L KH2PO4, 10 mmol/L Na2HPO4, 0.137 mol/L NaCl, 2.7 mmol/L KCl, pH 7.0), and 5 mmol/L MgCl2. Cells were washed in 1 × SSC (150 mmol/L NaCl, 15 mmol/L sodium citrate, pH 7.0) at room temperature. Samples were incubated with reverse transcription mixture, containing 1.2 U/μL Moloney murine leukemia virus reverse transcriptase (Promega), 0.4 U/μL RNasin (Promega), 250 μmol/L dNTPs (Promega), 50 μmol/L DIG-11-dUTP (digoxigenin-3-O-methylcarbonyl-ε-aminocaproyl-[5-(3-aminoallyl)-2′-deoxyuridine-5′-triphosphate]) (Roche) in a humidified chamber for 1 h at 37°C. Cells were visualized using sheep antidigoxigenin antibodies (Roche) linked to alkaline phosphatase followed by bromochloroindolyl phosphate/nitroblue tetrazolium color visualization (Roche). Coverslips were mounted in Faramount aqueous mounting medium (Dako). Images of individual sections were captured using a Photometrics charged coupled device camera. The average cell count was obtained from 9 random microscopic fields of each coverslip in triplicate with cells stained dark blue considered positive.
32P-UTP Incorporation During RNA Synthesis
The KB-G2 cells were plated in 24-well plates and cultured with 37 kBq (1 μCi) of α-32P–UTP per well in the presence of AS or S DNA (100 nmol/L) or no DNA, in DMEM with 1% fetal calf serum (FCS) for 24 h. After washing with PBS twice, cells were collected with trypsin. The total RNA was extracted using the RNeasy Mini extraction kit (Qiagen). The total RNA from each sample was transferred to scintillation vials along with 18 mL of scintillator (Complete Counting Cocktail; Research Products International Corp.), and left for at least 5–8 h before counting. All samples were counted against a standard in a liquid scintillation counter (Beckman LS 6000IC).
RT-PCR
The KB-G2 cells were incubated with 100 nmol/L AS or S DNAs or no DNA, in serum-free DMEM for 2 h, and then allowed to grow for 12 h in DMEM with 10% FBS. The total RNA was extracted again using the RNeasy Mini extraction kit. Two-step RT-PCR was performed using the Qiagen 1-step RT-PCR kit. The final reaction mixture contained 1.5 mmol/L Mg2+, 200 μmol/L dNTP, and 0.4 μmol/L of each primer. Reverse-transcription reactions were performed at 50°C for 30 min. Reaction mixtures were heated to 95°C for 15 min to activate HotStarTaq (Qiagen); then PCR amplification was performed for 35 cycles at 95°C for 45 s, 58°C for 45 s, and 72°C for 60 s, followed by 72°C for 10 min. The amplification products were electrophoresed on a 2.0% agarose gel containing 0.02% ethidium bromide, photographed, and quantified using Kodak Imaging Station 440CF. Samples were normalized against the expression of the β-actin mRNA. Primer probe set sequences for each transcript were all 20-mer and are as shown in Table 1.
RT-PCR Primer Sequences
Immunofluorescence
After incubating with biotinylated AS and S DNAs (100 nmol/L) for 2 h, the KB-G2 cells were plated at 20,000 cells per 12-mm round glass coverslip in 24-well plates (BD Falcon). After washing with PBS twice, the coverslips were placed in 20°C methanol for 10 min, rinsed twice for 10 s with cold acetone, and washed 3 times with PBS. After permeation with 0.1% Triton X-100 in 1% bovine serum albumin (BSA)/PBS for 30 min on ice and rinsing 3 times with 1% BSA/PBS, the cells were incubated with antibiotin-Cy3 antibody (Sigma), diluted 1:200, for 1 h at 37°C in the dark, and washed 3 times with 1% BSA/PBS. At 15 min before microscopy and photography, the coverslips were mounted in fluorescent mounting medium (Dako) and viewed on a fluorescence microscope with a ×40 objective.
Nuclear Accumulation
To establish whether AS and S DNAs show progressive accumulation in the nucleus of KB-G2 cells and, if so, to obtain a measure of the rate of accumulation therein, the KB-G2 cells were plated in 6-well plates and incubated with 99mTc–AS or –S DNAs (100 nmol/L) in DMEM with 1% FBS for 1, 3, 5, 7, and 9 h. The nuclear and other fractions from these cells were separated using a Nuclei EZ Prep kit (Sigma) at different times and were counted for radioactivity in an automatic NaI(T1) well counter along with a standard. In this way, the fraction of counts within the cell that accumulated in the nucleus was determined.
mRNA Transcription
The KB-G2 cells were plated in 6-well plates and cultured with 1,200 nmol/L unlabeled AS or S DNA in DMEM with 1% FBS for 20 h. The concentration of unlabeled AS DNA required for saturation was established in a previous investigation in our laboratories (3). Cells were rinsed twice with PBS and then allowed to grow in DMEM with 10% FBS for 0 min, 15 min, and 1, 2, and 6 h. The total RNA from each sample was extracted in triplicate using the RNeasy Mini extraction kit. The RNA was dissolved in loading buffer (0.5 mol/L NaCl, 20 mmol/L Tris·HCl, pH 7.5, 1.0 mmol/L ethylenediaminetetraacetic acid) and heated at 65°C for 5 min. The sample was quickly cooled in an ice bath for 5 min before adding 0.1 g oligo(dT)-cellulose (BioLabs) for each 0.5 mg of RNA. After rinsing 3 times with loading buffer, 99mTc–AS or –S DNAs (37 kBq/105 cells [1 μCi/105 cells]) were added to the cellulose pellets containing the target mRNA as a probe of mRNA content. The pellet was thoroughly loosened by flicking and the tube was placed at room temperature for 5 min. Thereafter, the tube was centrifuged at 4°C for 15 s at 12,000g and the supernatant was discarded. The cellulose pellets were washed 3 times with loading buffer; then the contents of each tube were transferred and counted directly in an automatic NaI(T1) well counter.
Statistical Analysis
Data are presented as the mean ± SD of at least n = 3 samples and statistical analysis was performed using the Student t test. A P value < 0.05 was considered statistically significant.
RESULTS
IST
The accumulation of AS DNA in cells by an AS mechanism should result in hybridization to its target mRNA. The resulting DNA/RNA hybrid would then be capable of priming elongation by reverse transcriptase in situ. Only hybridized DNA will prime incorporation of labeled nucleotide into new complementary DNA (cDNA) to provide a measurable signal in situ (9).
Figure 1 presents evidence for hybridization by in situ reverse transcription in KB-G2 and KB-31 cells after incubation with mdr1 AS DNA, S DNA, β-actin AS DNA, or no DNA. Cells growing on glass coverslips were first incubated with 100 nmol/L DNA in the presence of TransFast Reagent and then permeabilized, fixed, and subjected to in situ reverse transcription with DIG-11-dUTP. The incorporated label was detected using antidigoxigenin antibodies linked to alkaline phosphatase. Figures 1A and 1B are KB-G2 cells incubated with mdr1 AS and S DNA, respectively; Figures 1C and 1D are KB-31 cells incubated with mdr1 AS or S DNA, respectively; Figures 1E and 1F are KB-G2 cells incubated with β-actin AS DNA and no DNA, respectively; and Figures 1G and 1H are KB-31 cells incubated with β-actin AS DNA or no DNA, respectively. The β-actin was included as a positive control to ensure that in situ hybridization was free of artifacts by showing positive contrast in both cell types when incubated with the β-actin AS DNA compared with incubations with no DNA. The images clearly show increased signal resulting from elongation of the transcripts in KB-G2 cells incubated with mdr1 AS DNA compared with the same cells incubated with mdr1 S DNA and compared with KB-31 cells incubated with either. The intensity of the hybridization signal decreased in the absence of TransFast Reagent but otherwise the results were essentially identical. These results provide what we believe to be the first direct evidence that mdr1 AS DNA hybridized with its cellular mRNA target in KB-G2 cells that overexpress mdr1 mRNA and that these hybrids may be detected by priming synthesis of labeled transcripts in situ.

Hybridization of AS to mdr1 mRNA in KB-G2 and KB-31 cells detected using in situ reverse transcription. Cells growing on glass coverslips were incubated with 100 nmol/L DNA in the presence of TransFast Reagent and then cells were permeabilized, fixed, and subjected to in situ reverse transcription using DIG-11-dUTP. Incorporated label was detected using antidigoxigenin antibodies linked to alkaline phosphatase. (A and B) Cells incubated with mdr1 AS or S in KB-G2 cells. (C and D) Cells incubated with mdr1 AS DNA or S DNA in KB-31 cells. (E and F) Cells incubated with β-actin AS DNA or no DNA in KB-G2 cells. (G and H) Cells incubated with β-actin AS DNA or no DNA in KB-31 cells. (×400)
Table 2 presents the results of counting the number of positive cells in the incubations of both cell types with mdr1 AS and S DNAs, both with and without TransFast Reagent, and is presented as both the number and the percentage of cells in each category that were positive by visual inspection. With and without TransFast Reagent, the accumulation in both cell types was statistically higher for AS DNA compared with S DNA (*P < 0.01; †P < 0.01).
Results of In Situ Reverse Transcription in KB-G2 and KB-31 Cells
32P-UTP Incorporation During RNA Synthesis
The KB-G2 cells were incubated with α -32P–UTP in the presence of AS DNA, S DNA, or no DNA for 24 h. Total RNA was then extracted and counted. To provide evidence for a feedback mechanism, the counts in cells exposed to the AS DNA should be much higher than that of controls. Figure 2 presents histograms showing that the relative counts in total RNA for cells exposed to AS DNA was not higher than that of S DNA and no DNA and shows that the counts are similar for all 3.
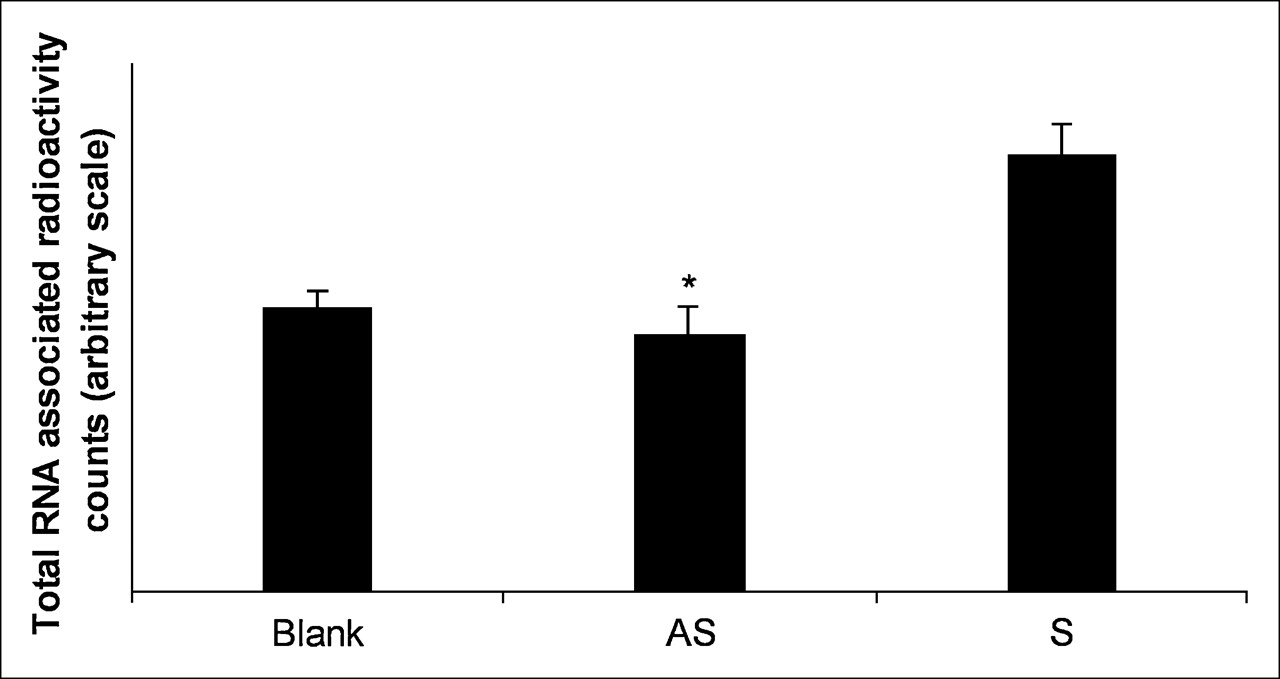
32P-UTP incorporation during RNA synthesis in KB-G2 cells. Cells were cultured with 37 kBq (1 μCi) α-32P–UTP per well in the presence of AS DNA, S DNA, or no DNA (100 nmol/L) in DMEM with 1% FCS for 24 h. Total RNA was extracted and counted from each sample. Error bars signify 1 SD. *P < 0.05 AS vs. S.
RT-PCR
Figure 3 presents gels with ethidium bromide staining showing the molecular weights (Fig. 3A) and relative abundance of mdr1 mRNA normalized to that of β-actin mRNA (Fig. 3B) for the results of RT-PCR. The sizes of PCR products agree exactly with the expected size (mdr1, 201 base pairs [bp]; β-actin, 228 bp). As in the 32P-UTP study, to provide evidence for a feedback mechanism, the band intensity of cells exposed to the AS DNA should be much higher than that of controls. Figure 3 shows that this is not the case and that the mdr1 mRNA levels in cells exposed to AS DNA, S DNA, or no DNA are similar.
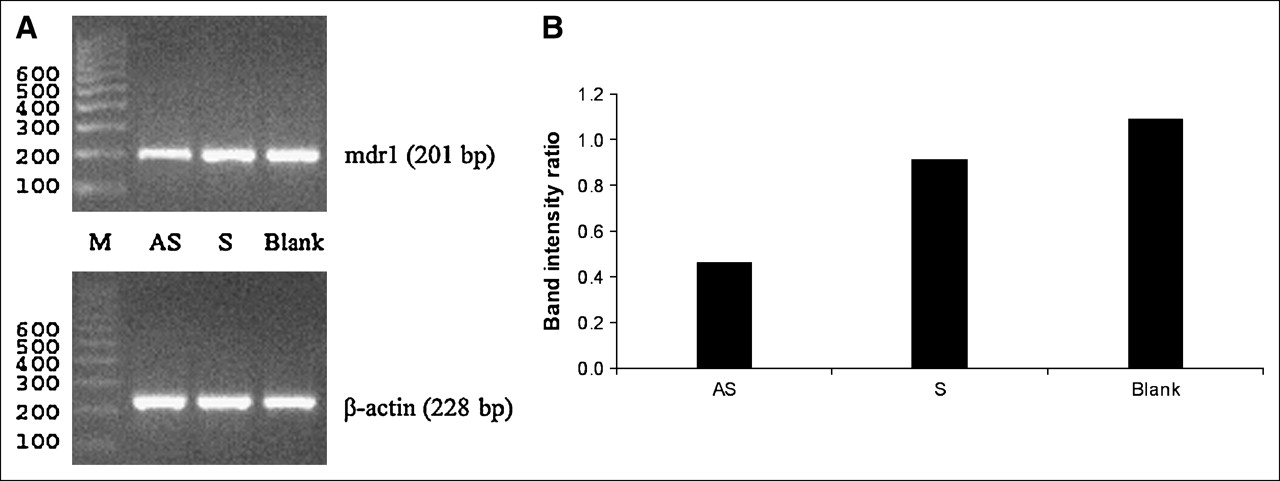
Results of RT-PCR on KB-G2 cells treated with AS DNA, S DNA, or no DNA. (A) Gels with ethidium bromide staining show correct molecular weights (M) for RT-PCR products of mdr1 mRNA and reference β-actin mRNA. (B) Histograms show similar relative abundances of mRNA when KB-G2 cells are treated with AS DNA compared with S DNA or no DNA. bp = base pairs.
Immunofluorescence
Figure 4 presents the fluorescence images of KB-G2 cells incubated with biotinylated AS DNA (Fig. 4A) and S DNA (Fig. 4B) followed by staining with antibiotin-Cy3 antibody. Intense fluorescence signal is apparent in the AS DNA–treated cells but not in S DNA–treated cells.
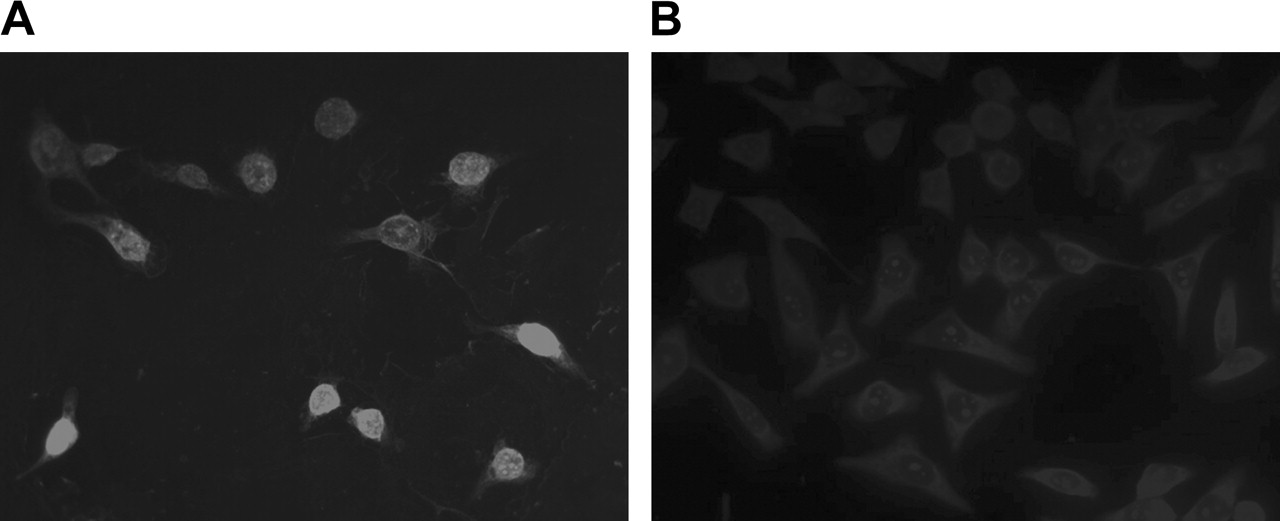
Cellular accumulation and distribution of mdr1 AS by immunofluorescence microscopy in KB-G2 cells incubated with biotinylated AS DNA (A) and S DNA (B) and detected with antibiotin-Cy3 antibody. (×400)
Nuclear Accumulation
After incubation of KB-G2 cells with radiolabeled AS DNA and S DNA for different times, the nuclear and cytoplasmic fractions were isolated and counted separately. As shown in Figure 5, at early incubation times, the accumulation of 99mTc in the nucleus exceeded that in the cytoplasm for cells incubated with AS DNA but not in cells incubated with the S DNA control. After 9 h of incubation, the accumulation of 99mTc in the nucleus was about 2.2-fold higher compared with the cytoplasm in cells incubated with the AS DNA and was still less than unity for cells incubated with the S DNA.
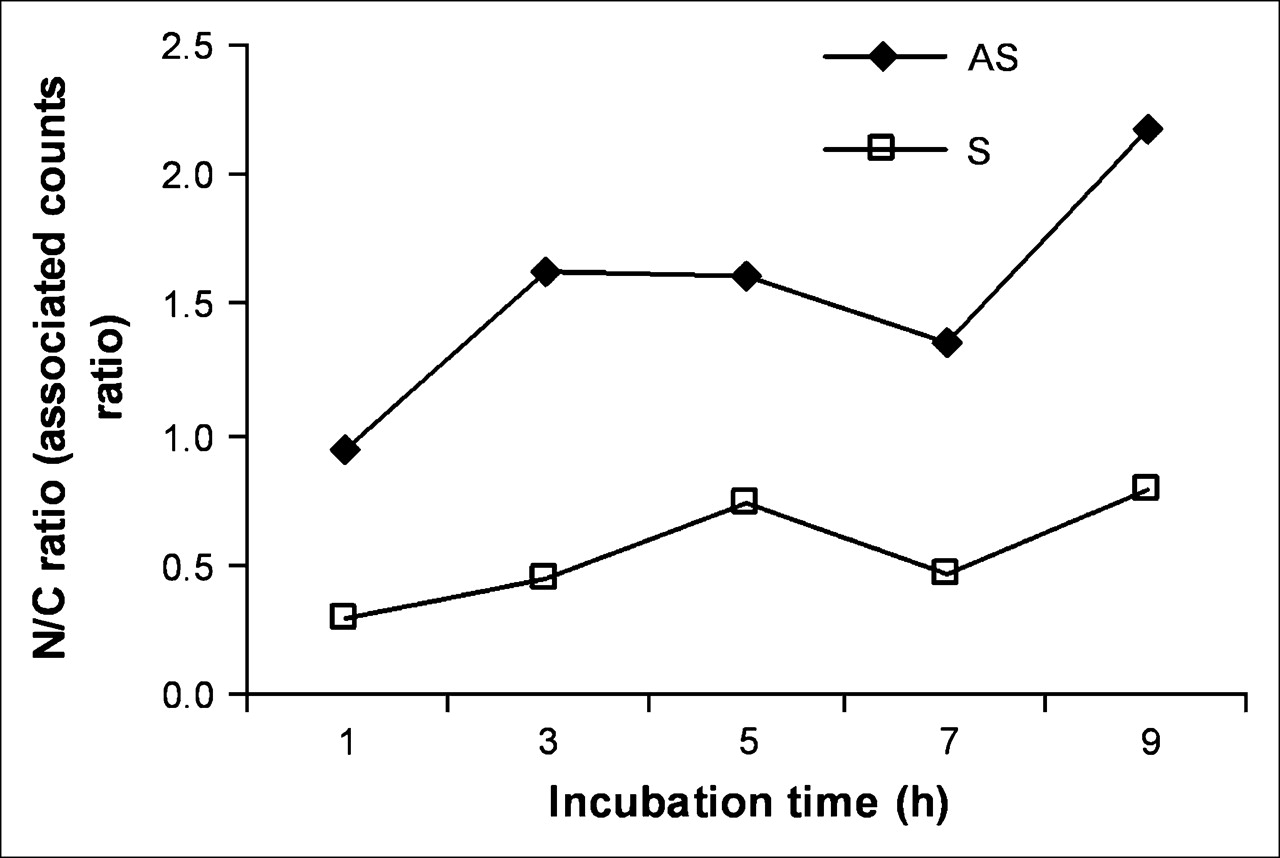
Accumulation of 99mTc in nucleus (N) compared with cytoplasm (C) for cells incubated with AS DNA and S DNA for up to 9 h.
mRNA Transcription
Successful AS targeting may require a high rate of mRNA transcription to provide sufficient targets for the radiolabeled AS DNA. To estimate the transcription rate of mdr1 mRNA in KB-G2 cells, these cells were first saturated by incubation with unlabeled AS DNA and, as a control, “saturated” with unlabeled S DNA, both at 1,200 nmol/L for 20 h. Thereafter the cells were washed free of DNA and incubated with 10% FBS DMEM for various times up to 6 h. At each time point, total RNA and then total mRNA were extracted as described and probed for the concentration of target mRNA with 99mTc-AS DNA. As a further control, the cells were also probed identically with 99mTc-S DNA. As shown in Figure 6, the relative concentration of mdr1 mRNA measured by 99mTc–AS probing (open circles) was at a high level at all time points for cells exposed to the S DNA to indicate no influence of the incubation with S DNA as expected. Furthermore, also as expected, probing with the control radiolabeled S DNA (open and closed triangles) indicated only low relative concentrations of target mRNA levels at all time points presumably due to nonspecific binding. In what we believe to be due to transcription, the relative concentration of mdr1 mRNA indicated by probing with the radiolabeled AS DNA in cells saturated with the unlabeled AS DNA (closed circles) is statistically identical to nonspecific binding at early times but increases with time to reach levels expected for unsaturated cells at about 120 min.

The relative concentration of mdr1 mRNA as shown by 99mTc–AS DNA probing of KB-G2 cells incubated at saturating concentrations with unlabeled AS DNAs (•) compared with cells incubated with unlabeled S DNA (○). As further controls, cells incubated with unlabeled AS DNA (▴) and unlabeled S DNA (▵) were also probed with 99mTc–S DNA. *P < 0.05, cells saturated with AS DNA vs. cells “saturated” with S DNA when probed with 99mTc–AS DNA. ¶P < 0.05, cells saturated with AS DNA and probed with 99mTc–AS DNA vs. 99mTc–S DNA. ¶P < 0.05, also for cells saturated with AS DNA and probed with 99mTc–AS DNA vs. cells “saturated” with S DNA and probed with 99mTc–S DNA.
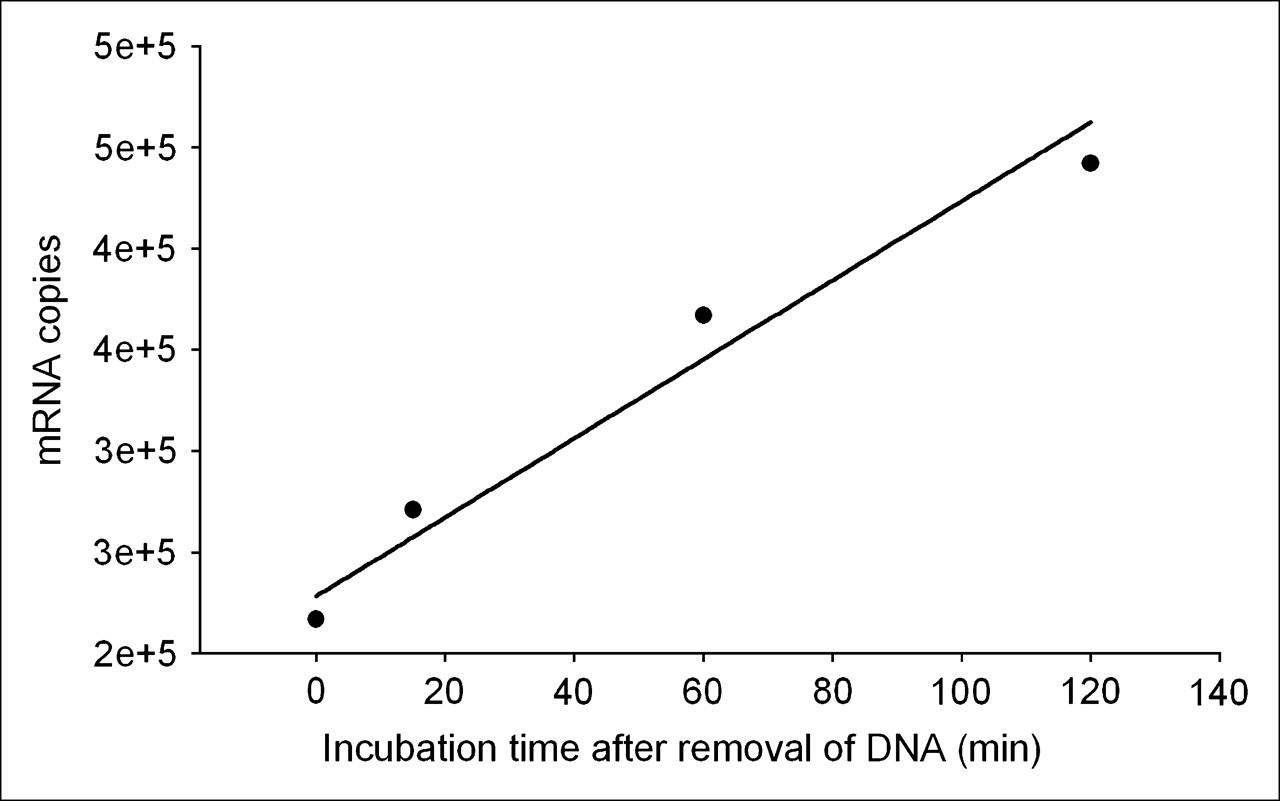
These results provide a means of estimating the transcription rate of the target mdr1 mRNA in KB-G2 cells. Figure 7 is a plot of the counting rate of total RNA divided by the number of cells incubated at the 4 earliest time points from end of saturation. The regression line through the data points provides a slope of 1.95 × 10³ copies per minute per cell (R2 = 0.961). Because both the RT-PCR and 32P-UTP studies showed no increase in transcription rate after incubations with unlabeled AS DNA, the transcription rate measured above must be a constant. Under this assumption, the number of target mRNAs produced would equal about 106 over 10 h.

Plot of counting rate of total RNA from Figure 6 divided by number of cells for the earliest 4 time points. Regression line through data points provides a slope of 1.95 × 10³ copies per minute per cell (R2 = 0.961).
DISCUSSION
Evidence for the accumulation of radiolabeled oligomers in cell culture by an AS mechanism is now compelling (4). Evidence for AS targeting to tumor in vivo is also mounting, particularly recently (2,10). Despite encouraging progress, basic questions regarding the mechanisms of this targeting remain unanswered and, consequently, the pathway to improvement is often unclear. For example, the mechanism whereby AS oligomers gain access to the cellular cytoplasm has not yet been firmly established such that the search for transfecting agents with potential to improve delivery remains based on trial and error. Furthermore, although the cellular and, occasionally, in vivo tumor accumulations of AS DNA are roughly in proportion to established steady-state concentrations of target mRNAs, for yet-unknown reasons, the relationship is not quantitative (3). Another example, and one particularly relevant to this report, is the unexpectedly high number of AS DNAs accumulating specifically in vitro (4,10) of about 106 per tumor cell over 10–24 h and in vivo (2).
The objective of this study was to provide further evidence for AS targeting of tumor cells in culture through the use of conventional and unconventional assays. An additional incentive for this investigation was to explore 2 possible explanations for the high accumulations mentioned.
Our laboratories have recently focused on targeting the mdr1 mRNA responsible for the production of Pgp as one of the protein members of the multidrug resistance family. This selection was based partly on the availability of 2 cell lines—a parent human epidermoid carcinoma cell line, KB-31, usually reported to be a low-level expressor of the target and its upregulated progeny, KB-G2, shown by us and others to be a high-level expressor of the same target mRNA. Furthermore, several DNA base sequences have been shown in other laboratories to interfere with this target mRNA by what appears to be an AS mechanism, thus making straightforward the selection of an AS DNA for these investigations (11). Using this DNA and cell lines, we have been able to show definitive accumulation by an AS mechanism in cell culture and evidence of AS accumulations in vivo in a mouse tumor model (2,3). The previous successful use of this combination encouraged its use again in this investigation.
The first goal of this study—namely, to obtain further evidence for AS targeting—was initially explored by immunofluorescence staining showing significantly higher accumulations in KB-G2 cells of biotinylated AS compared with S DNA (Fig. 4). One unexpected observation in this research was evidence for the progressive diffusion of AS DNA but not S DNA into the nucleus. This migration was confirmed by measuring the ratio of radiolabeled DNA in KB-G2 cells that were present in the nuclear fraction compared with the cytoplasmic fraction. As shown in Figure 5, the radiolabeled AS DNA showed a 2.2-fold higher nuclear accumulation than the radiolabeled S DNA over 9 h.
Perhaps the most definitive evidence of this investigation for AS target was obtained by IST. Because cDNA elongation requires a primer, providing the ingredients for in situ reverse transcriptase will be unproductive in the absence of DNA binding to mRNA (8). As shown in Figure 1, the staining of KB-G2 cells incubated with AS DNA is clearly more pronounced than that of either KB-31 cells incubated with the AS DNA or either cell type incubated with S DNA. These impressions are confirmed by counting the percentage of positive cells (Table 2).
Mentioned throughout several reports from our laboratories (3,4) and others (10) is specific cellular accumulation of AS DNA of about 106 per cell after 10–24 h of incubation. Using both RT-PCR and 32P-UTP accumulation, this laboratory found earlier weak but significant evidence for upregulated transcription of the regulatory subunit RIα mRNA in tumor cells exposed to a phosphorothioate DNA against that target mRNA (4). This observation was used in support of the suggestion that binding of the target mRNA with the AS DNA resulted in positive feedback leading to increased transcription of this mRNA. No similar evidence was obtained in this investigation in essentially the same studies on the mdr1 mRNA target. The results of both 32P-UTP accumulation (Fig. 2) and RT-PCR (Fig. 3) failed to show increased production of mdr1 mRNA in KB-G2 cells exposed to the AS DNA. Accordingly, at least under the conditions of this investigation, a feedback mechanism would seem to be improbable. One further conclusion that may be possible from these observations is that the rates of transcription and degradation are independent of the presence in the cell of the AS DNA, at least under the conditions of this investigation. The lower values found in both studies for the AS DNA compared with the S DNA, if significant, may be explained by the expected degradation of AS DNA/mRNA duplexes by ribonuclease H enzymes in the case of phosphorothioate DNAs (12,13).
An alternative explanation for the unexpectedly high cellular accumulations of AS DNA requires a very high transcription rate. If this high transcription rate were to be balanced by a comparably high degradation rate, then the equilibrium steady-state mRNA levels would still be modest. The novel approach adopted in this study to obtain evidence of rapid transcription was first to saturate target mRNA levels with unlabeled AS DNA. The extraction of total RNA from cells saturated in this fashion followed by the binding of the mRNAs by oligo(dT) affinity chromatography would be expected to show low levels of target mRNA when probed with radiolabeled AS DNA. As shown (Fig. 6), the levels of target mRNA are indeed low immediately after saturation but increase to that of the unsaturated cells in approximately 120 min.
One explanation for this behavior involves the balance between the transcription and degradation rates of the target mRNA. The number of mRNA targets should be equal to the difference between the transcription and degradation rates. Transcription should be predominant soon after saturation since the target mRNA concentration will then be low and so will the degradation rate (the product of concentration and rate constant). In the face of constant transcription and decreased degradation, the number of target mRNAs will increase. At some point, the degradation rate will reach its normal value and at that point the number of targets will become constant.
These data were subjected to regression analysis (Fig. 7) that provided a value for the transcription rate of about 2,000 mRNAs per minute per cell. Should that rate persist for 10 h, the number of mRNAs produced during this period would be about 106, a number in gratifying agreement with the high cellular accumulations of AS DNAs described (3,4). Furthermore, we believe that the results of both the RT-PCR and the 32P-UTP studies that showed no increase in mRNA concentration in cells exposed to unlabeled AS DNA indicate that the transcription and degradation rates are constant and independent of the presence or absence of AS DNA within the cell. Therefore, the above transcription rate should be constant and not influence by the presence of AS DNA at saturating levels.
An explanation consistent with both the rapid transcription rate measured herein and the observation that the AS DNA migrates to the nucleus is the targeting with AS DNA of pre-mRNAs in the nucleus that are in equilibrium at much higher concentrations than the equilibrium value for mature mRNAs in the cytoplasm. The fact that the AS DNAs have been observed in this work and in others (14,15) to diffuse into the nucleus would argue that the highest concentration of target mRNA must reside therein.
There are increasing observations that AS DNAs modulate mRNA splicing (16–18) and degrade cellular mRNA by targeting pre-mRNA (19). A recent report has shown that enzymatic degradation of target mRNA levels by RNA interference occurs in the nucleus (20). The authors suggest that modulation of pre-mRNAs is a normal process required to protect the cell from aberrant transcripts or overproduction due to tandem repeats.
CONCLUSION
While providing further evidence for an AS mechanism for the targeting in cell culture of AS DNAs, the results of this investigation have provided a plausible explanation for the unexpectedly high cellular accumulations and for the observed migration into the nucleus. Our results are consistent with the targeting of pre-mRNAs in the nucleus (as well as targeting the much lower concentration of mature mRNAs in the cytoplasm). This explanation requires a rapid transcription rate to provide sufficient targets for the AS DNA. By using radiolabeled AS DNA as a probe of total RNA from cells exposed to saturating levels of unlabeled AS DNA, it was possible in this research to measure a transcription rate. The value of about 2,000 copies per cell per minute represents a rate that would explain the high cellular accumulations.
Acknowledgments
The authors thank Dr. Isamu Sugawara (Research Institute of Tuberculosis, Tokyo, Japan) for providing the cell lines used in this investigation. This research was supported in part by the Office of Science (Biological and Environmental Research), by the U.S. Department of Energy (grant DE-FG02-03ER63602), and by Grant-in-Aid for Scientific Research (grants 16591225 and 17659374) and the 21st Century Code of Excellence Program to Keio University, both from the Japanese Ministry of Education, Science, Sports and Culture.
References
- Received for publication July 15, 2005.
- Accepted for publication October 7, 2005.


Jump to section
Related Articles
Cited By...
- Auger Radiation-Induced, Antisense-Mediated Cytotoxicity of Tumor Cells Using a 3-Component Streptavidin-Delivery Nanoparticle with 111In
- A Generalizable Strategy for Imaging pre-mRNA Levels in Living Subjects Using Spliceosome-Mediated RNA Trans-Splicing
- Cell Culture and Xenograft-Bearing Animal Studies of Radiolabeled Antisense DNA Carrier Nanoparticles with Streptavidin as a Linker