


Abstract
Image registration and fusion of whole-body 18F-FDG PET with thoracic CT would allow combination of anatomic detail from CT with functional PET information, which could lead to improved diagnosis or PET-based radiotherapy planning. Methods: We have designed a practical and fully automated algorithm for the elastic 3-dimensional image registration of whole-body PET and CT images, which compensates for the nonlinear deformation due to breath-hold CT imaging. A set of 18 PET and CT patient datasets has been evaluated by the algorithm. Initially, a 9-parameter linear registration is performed by maximizing the mutual information (MI)-based cost function, between the CT and the combination of emission and transmission PET volumes, using progressively increased matrix sizes to increase speed and provide better convergence. Subsequently, lung contours on transmission maps and corresponding contours on CT volumes are automatically detected. A large number (few hundreds) of corresponding point pairs are automatically derived, defining a thin-plate-spline (TPS) elastic transformation of PET emission and transmission scans to match the CT scan. Results: In all 18 patients the automatic linear registration with multiresolution converged close to the final alignment, but, in 10 cases, the nonlinear differences in the diaphragm position and chest wall were still clearly visible. The nonlinear adjustment, which was in the order of 40–75 mm, significantly improved the alignment between breath-hold CT and PET, especially in the areas of the diaphragm. Lung volumes measured from transmission and CT scans match closely after the warping has been applied. The average computation time is <40 s for the linear component and <30 s for the nonlinear component for a typical PET scan with 4–6 bed positions. Conclusion: We have developed a technique for automatic nonlinear registration of CT and PET whole-body images to common spatial coordinates. This technique may be applied for automatic fusion of PET with CT acquired on stand-alone scanners during normal breathing or breath-hold data acquisition.
In the diagnosis and follow-up of cancer patients, PET is increasingly used. However, PET suffers from limited image resolution, and additional anatomic scans such as CT or MRI are often needed to improve the localization of the lesions or to guide patient therapy. These anatomic scans can be performed using specialized hybrid PET/CT systems (1) but often need to be performed during separate imaging sessions on separate scanners, due to clinical requirements or facilities available. A combined interpretation of these stand-alone PET and CT images is often needed to optimize patient diagnosis or therapy. Such combination could be facilitated by applying automated software image registration to align PET and CT scans into common spatial coordinates. The PET modality has been particularly useful in the imaging of the thoracic regions for the assessment of pulmonary malignancies. Current software image registration techniques, however, have mostly been applied and validated in multimodality brain studies (2).
Image registration methods can use fiducial markers or exploit inherent image similarities (3) to achieve data alignment. Techniques based on fiducial markers are especially useful in brain image registration (4) because the rigid character of the skull allows relatively accurate positioning of the markers and, therefore, good reproducibility and accuracy. The use of fiducial markers, however, may significantly complicate image acquisition procedures, landmark-based registration cannot be performed retrospectively, and it may have limited accuracy (5). In the registration of the thoracic and abdominal area, the placement and accuracy of external fiducial markers would be problematic because of soft-tissue deformations of internal organs such as the lungs. The logistic difficulties in using fiducial landmarks for all patients prospectively limit the practicality of this approach.
Image-based algorithms for multimodality registration have been developed and applied primarily to brain images from various modalities (2,3). These algorithms can be divided into surface-matching methods and voxel similarity methods. Voxel similarity methods have been demonstrated to have superior performance in comparison with surface matching or the external fiducial landmark–based methods in the registration of PET CT and MRI images of the brain (4,6). Some registration algorithms have been applied in multimodality fusion of images of the thorax and abdomen in preliminary studies. The multimodality registration of CT and PET or SPECT of the thorax has been approached as a rigid-body problem using a surface-based technique based on chamfer matching (7), lung segmentation (8,9), interactively defined homologous markers (10), and mutual information (MI) maximization (11).
Nonlinear approaches, which attempt to compensate for soft-tissue deformations, have been proposed for registration of the thoracic and abdominal regions by maximizing MI based on the 15-parameter thin-plate-spline (TPS) model (12) or piecewise linear approach to independently move portions of the volume (13). A nonlinear polynomial approach has been used to create 3-dimensional (3D) abdominal atlases of MRI (14) and for MRI/CT matching (15). Image warping is typically accomplished by energy-minimizing interpolation such as TPSs (16) or B-splines (17). The automation of nonlinear registration techniques is of great importance because the number of adjustable image parameters can be very large. The limitations of the surface-based nonlinear registration techniques are that they are sensitive to the initial errors in the image segmentation phase, whereas the computational cost of the more robust, volume-based iterative approach can be prohibitive.
In this study, we developed software algorithms for thoracic PET/CT image registration, which would allow robust, rapid, fully automated, and retrospective fusion of images obtained with stand-alone PET and CT machines. We designed and implemented such an algorithm for thoracic PET/CT registration, overcoming the difficulty of incomplete anatomy on PET emission data by using both emission and transmission datasets. Two complementary steps were investigated: (a) a linear 9-parameter registration, which alone may be suitable for image registration, if both scans have been acquired during tidal breathing; and (b) a nonlinear registration refinement, for the correction of the thoracic deformation during the breath-hold CT acquisition. We put particular emphasis on the performance of the software algorithm to achieve practical computational times for clinical deployment.
MATERIALS AND METHODS
Data Acquisition
CT and PET scans of 15 patients (9 male, 6 female) serially selected from clinical referrals have been used in this retrospective study. Standard diagnostic CT scans have been performed on a spiral CT scanner (Somatom Plus 4; Siemens) with 5-mm center-to-center slice separation, 512 × 512 matrix size, pixel size of 0.54–0.82 mm, and 39–85 axial slices covering at least the entire lung volume. Scans were performed with intravenous contrast. Patients were scanned in breath-hold mode with arms elevated. In 3 patients, additional CT scans were performed during normal breathing. Thus, in total, we had 18 PET/CT pairs.
PET was performed with a whole-body PET scanner (ECAT EXACT; Siemens CTI) with an axial field of view of 15.8 cm, resulting in 47 transverse slices with a slice thickness of 3.4 mm. 18F-FDG of high specific activity was produced in the radiopharmacy of the Bad Berka PET Center. All patients were asked to fast for 12 h (overnight) before the study to minimize glucose utilization by normal tissue and to ensure standardized glucose metabolism. To reduce the confounding effects of changing bladder activity on assessment of the pelvis, patients were encouraged to drink water (750 mL) before the study and were given 20 mg furosemide 30 min before imaging. The images were acquired approximately 60 min after the administration the intravenous administration of 6 MBq 18F-FDG per kilogram of body weight. All scans consisted of 4–6 bed positions. Patients were placed in the supine position with arms elevated. Transmission scans were obtained with 68Ge rod sources (4 min increasing up to 6 min, depending on the activity of the rod sources). Emission data (6- to 8-min acquisition times) corrected for random events, dead time, and attenuation were reconstructed by means of iterative processing of both emission and transmission data by the ordered-subsets expectation maximization algorithm. Transmission data was reconstructed with the filtered backprojection technique. The image pixel counts were calibrated to activity concentration (Bq/mL) and were decay corrected using the time of tracer injection as the reference. The resulting in-plane image resolution of the transaxial images was approximately 8-mm full width at half maximum (FWHM), with an axial resolution of approximately 5-mm FWHM. Pixel sizes of reconstructed images was 4.34 mm for emission data and 5.15 mm for transmission data (due to different reconstruction methods) but were equalized later by the registration software. Transmission and emission scans had the range of 85–168 slices. Both transmission and emission matrix sizes were 128 × 128.
Initial Data Processing
After the reconstruction, images were transferred to the HERMES (Nuclear Diagnostics) image workstation. Before image registration, the CT data were resampled to the 256 × 256 matrix, and the volume extents and pixel sizes were adjusted automatically by our registration software to equalize PET and CT field-of-view extents. Transmission and attenuation-corrected emission PET pairs were considered for the image registration with CT datasets. The linear module of the presented registration algorithm has been implemented on the HERMES platform as a module in the Multimodality Fusion toolkit. No manual operation was performed during the data preprocessing steps.
Registration Algorithm
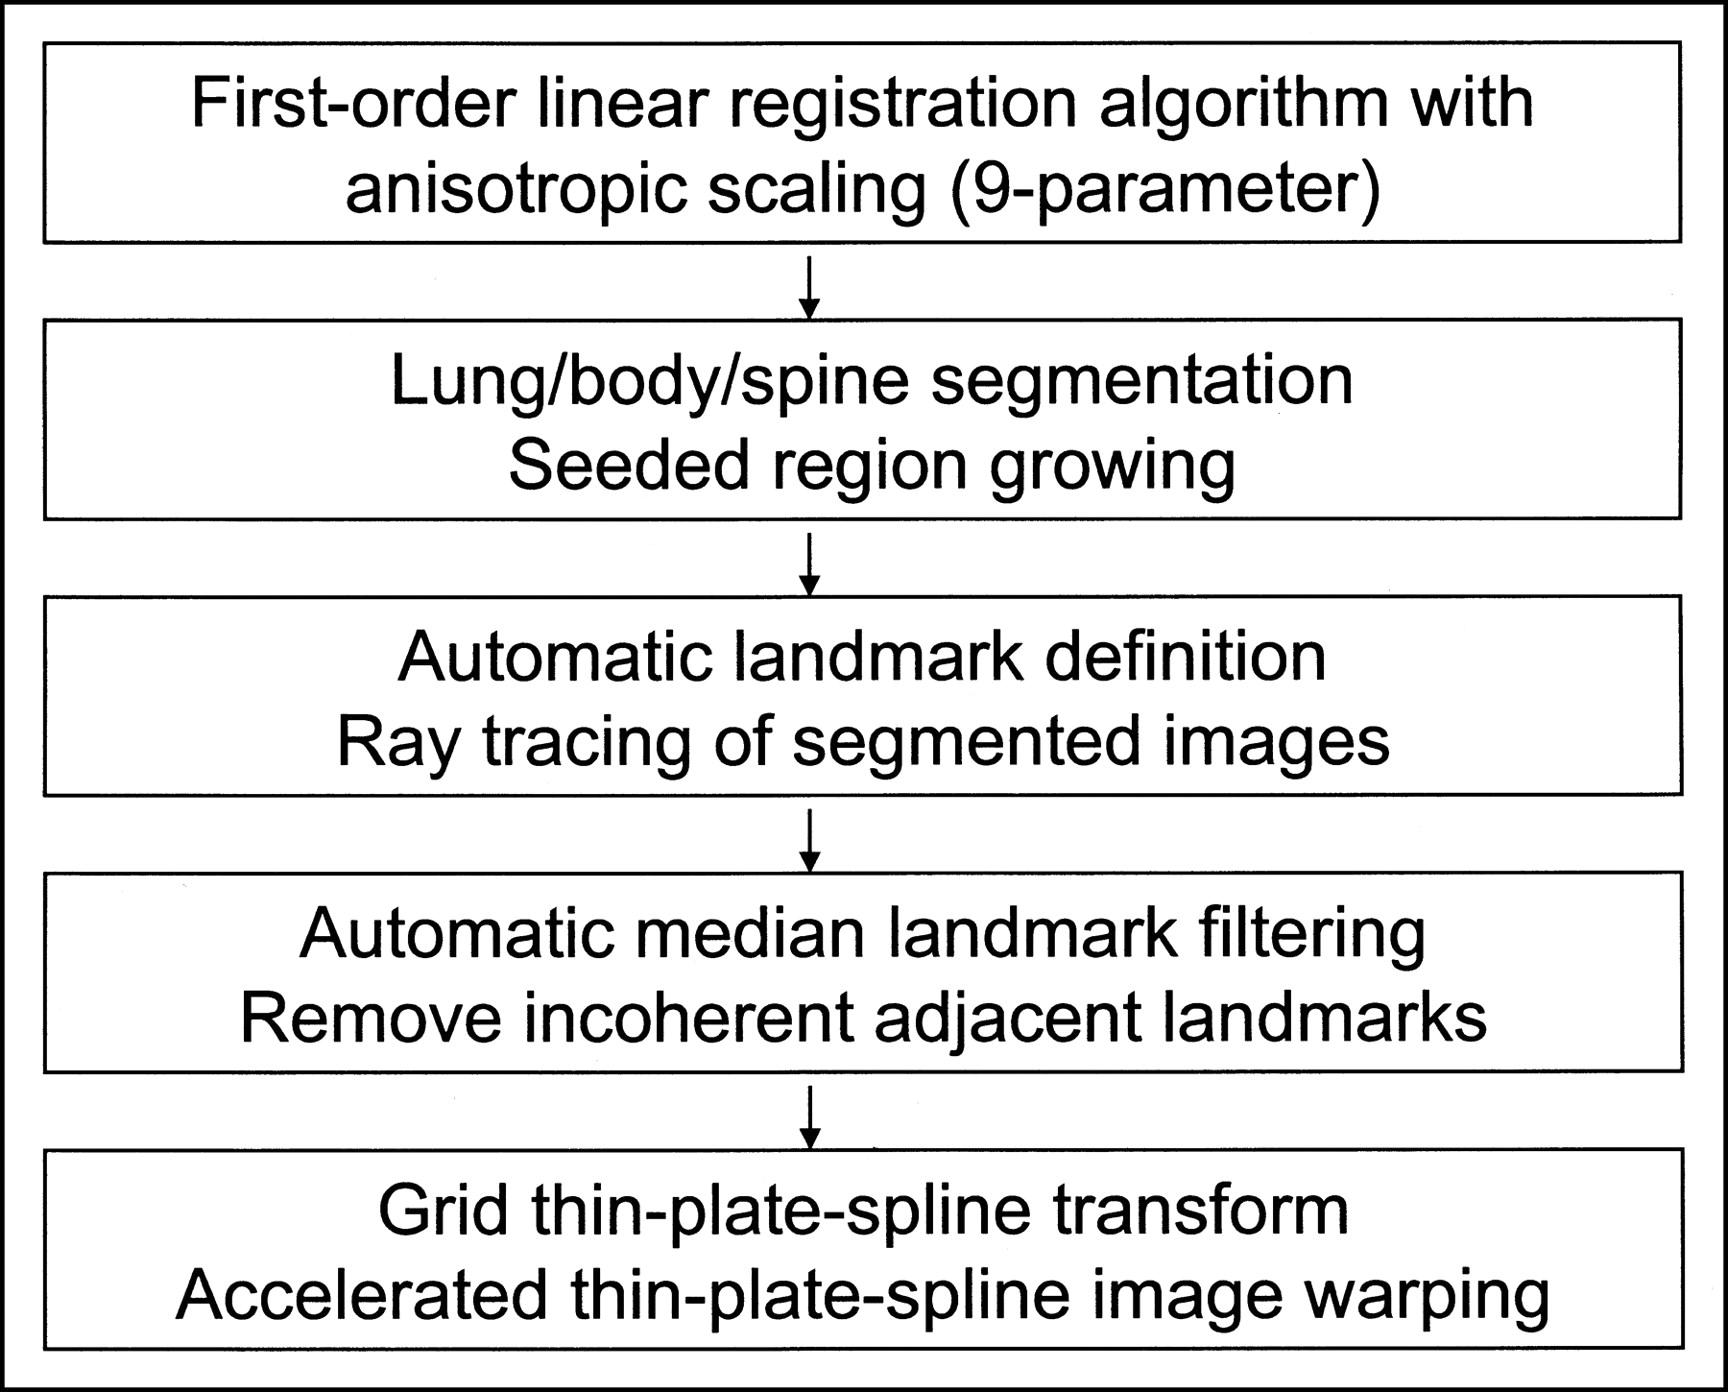
The algorithm consists of several steps described below and a general overview is presented in Figure 1.

Flow chart with steps performed during automatic image registration.
Registration Cost Function.
We applied an MI-based technique (18) as a cost function and tested various implementations related to this method. The MI (19) estimates the statistical dependence of random variables. Perfectly aligned images will exhibit overlap of the features and, therefore, the overall information content in the combined, fused image will be reduced. This information reduction is greatest when the data are best aligned to each other. Therefore, we can try to maximize this reduction by varying the geometric transformation parameters of 1 volume (PET). The information reduction could be captured by finding the minimum of the joint entropy measure between 2 volumes, but such joint entropy is also dependent on the changing overlap of volumes (2). MI is less sensitive for these changes because it is defined as a difference between individual entropies and joint entropies (20).
Transformed PET data (both emission and transmission) and CT voxel intensities can be defined as random variables with marginal probability distributions pCT(c) and pPET(et) and a joint probability distribution pPETCT(et,c), where et are PET emission and transmission intensity values and c are the CT voxel intensity values; then the MI(PET,CT) between PET and CT, is defined as:
 Eq. 1 The joint probability distribution pPETCT(et,c) is defined as the probability of encountering voxel locations for which the intensity values are et in emission and transmission volumes and the CT values are c in the CT volume. The et value can refer to either emission or transmission voxel value or a combination of both. In addition, a modified normalized MI criterion (NMI) has been evaluated as proposed by Studholme et al. (21). This criterion was reported to be more successful than MI for the brain image registration due to lesser dependence on the variable overlap between volumes during registration. We have implemented this method because changing volume overlap was considered to be significant in our application (large misalignments along the axis of the bed and varying volume coverage). The NMI criterion was defined as:
 Eq. 2
Eq. 2
To improve the computational efficiency and reduce the effect of the random noise in the calculation of the cost function, we reduced the number of the intensity levels to 100 in each modality and, therefore, the number of all intensity pairs was limited to 10,000, similar to our previous work (22). This reduction in the number of intensity bins assumes that the intensity variations of <1% are discarded in the calculation of the MI. The use of a larger number of bins did not have any significant effect on the registration as assessed in our preliminary evaluations. The joint probability is subsequently calculated by dividing the number of such voxel pairs (#) by the number of all voxels in the volume:
 Eq. 3 where X, Y, Z are the 3D dimensions of the volumes and x,y,z are the individual voxel indices.
The marginal probability distributions pPET(et) and pCT(c) are defined as the probabilities of encountering a particular intensity in each of the volumes (PET or CT), regardless of the corresponding voxel intensities in the other volume. They can be calculated as follows:
 Eq. 4
Eq. 4
 Eq. 5
Eq. 5
Transmission maps acquired during PET scans for the purposes of attenuation correction can be used for the image registration (23,24). To reduce the dependence on the highly variable PET image characteristics, we have defined the cost function as a function of both transmission and emission scans, assuming both have been acquired in the same orientation. We have evaluated the registration using emission data alone (EM), transmission data alone (TR), and also using a combination of both emission and transmission data (TR+EM). In this implementation, the combination was achieved by addition of 2 volumes after normalization with a particular weighting function. To determine a suitable weighting factor we have attempted to maximize the number of successful registrations after image misalignment testing 3 different factors. The maximum number of successful registrations (95/100) was obtained for the weighting factor of 0.8 for emission and 0.2 for the transmission scan. Therefore, this weighting value was used in all subsequent experiments.
Minimization Algorithm for Linear Registration.
The automatic linear registration used a simplex-based minimization algorithm (25) to maximize the MI measure as defined above. To be able to use the minimization algorithm for maximization of the MI, the cost function was defined to be −MI(PET,CT) or −NMI(PET,CT). In minimizing the cost function, the simplex algorithm adjusted translations along the 3 coordinate axis (X shift, Y shift, and Z shift) and rotations within the 3 orthogonal planes (XY rotation, XZ rotation, and YZ rotation) as well as X, Y, and Z scalings, similar to the approach used by Hill et al. for correction of pixel scaling errors (26). In each iteration, PET volumes were resampled using trilinear interpolation. The iteration process was terminated when the relative decrease in the cost function was below a predefined threshold (<0.1%).
To improve the performance and reduce the possibility of entrapment in local minima, we used a multiresolution approach. The minimization process was repeated for PET and CT volumes rebinned to several matrix sizes, starting from the 32 × 32 matrix size. The search range was then progressively reduced for each cycle at a given image resolution. We evaluated the PET/CT registration algorithm with a different number of multiresolution steps.
Nonlinear Algorithm.
After linear registration with anisotropic linear scaling, we performed an additional step to correct for any remaining nonlinear differences. Lung voxels were automatically identified on PET transmission and CT volumes after linear registration using an adaptive threshold region-growing technique. Emission PET data were not used in the warping process. Second, all voxels inside the patient body were classified as lung or soft-tissue voxels. Subsequently, corresponding points on PET and CT lung outlines and external body outlines were identified by automatic ray tracing from centroids of the lungs and outside the body (Fig. 2A). In addition, spine voxels were identified on CT scans and assumed to be in the same location on the transmission scans (where spine is typically not clearly identifiable). The corresponding point pairs (ray points intersecting the CT and PET lung and body surfaces) formed 3D displacement vectors, which were then used as an input to the image warping module (Fig. 2B). To reduce image artifacts due to the incorrectly and inconsistently defined point pairs, we apply median filtering of vectors based on local neighborhoods. We assume that for each motion vector there exists a spheric neighborhood of a given radius, in which all motion vectors must have similar directions. This step avoids image artifacts caused by dissimilar motion vectors positioned close to each other.
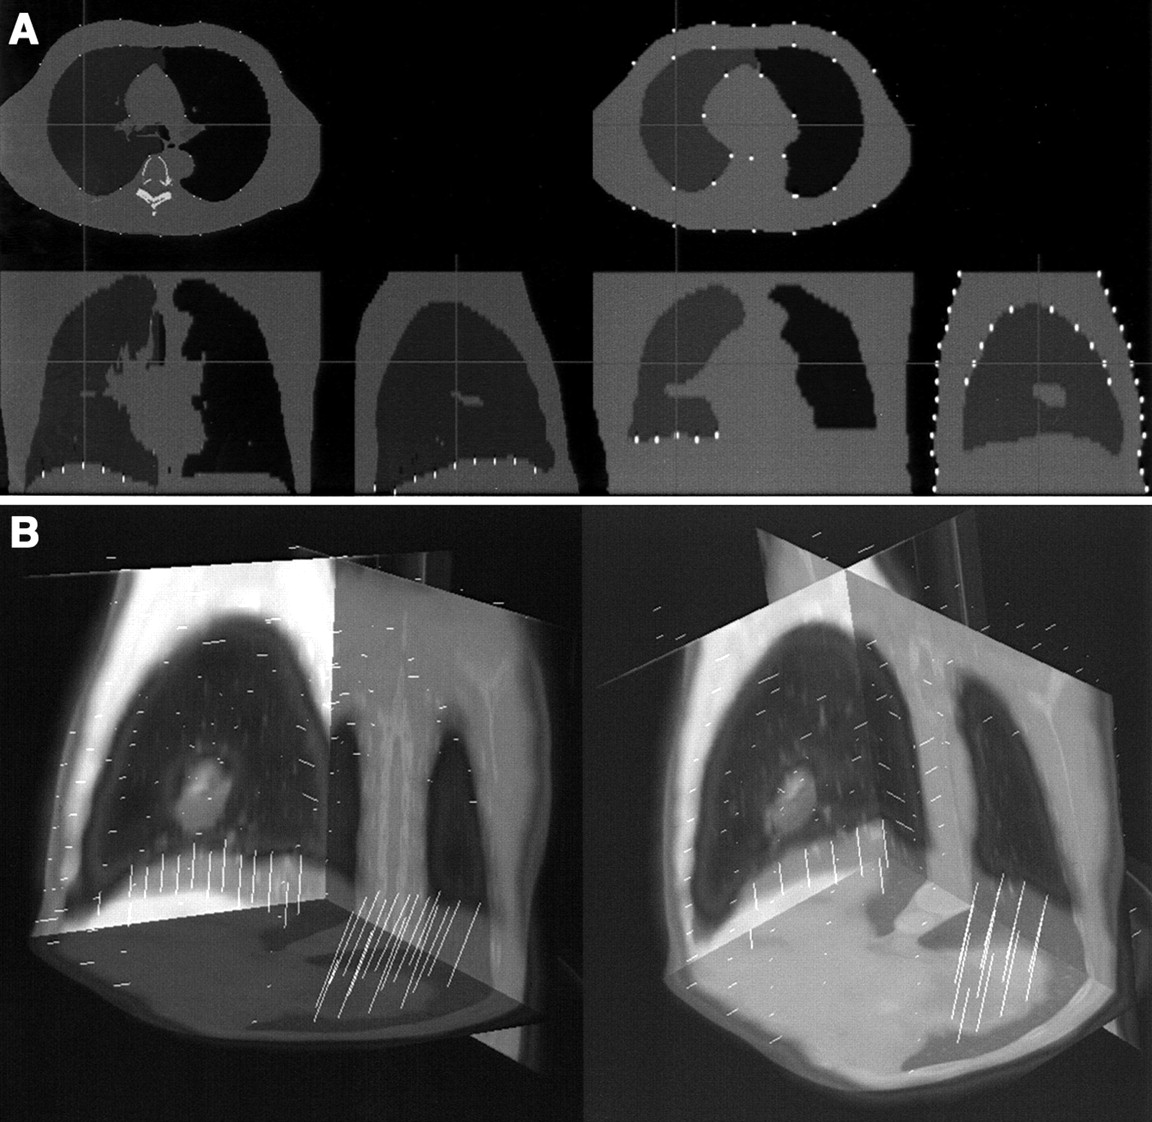
Automatically identified landmarks on segmented CT (left) and segmented transmission map (right) identified by algorithm for nonlinear step (A) and resulting displacement vectors created by joining corresponding CT and transmission map landmarks (B).
Image Warping Method.
We use the TPS algorithm as described by Bookstein et al. (16) for nonlinear image warping based on the identified displacement vectors. This technique uses bicubic image interpolation and produces a smoothly interpolated deformation of the volume. To accelerate the performance we use a grid version of the TPS algorithm. The implementation of the arbitrary point pairs is represented as a grid deformation of a particular resolution. The implementation of this nonlinear image interpolation method has been recently described (27). A grid-based TPS transform allows for faster software implementation of the TPS.
Evaluation of Algorithm
To test the reproducibility of various methods due to the entrapment in the local minima, we performed multiple registrations of the same data from different initial 3D orientations. The PET emission and transmission volume pairs were arbitrarily misaligned by 6 parameters: 3 angles varied from 0° to 10° in 2° steps, translations along the x- and y-axes varied in 5-pixel steps from 0 to 15 pixels (0–65 mm), and translation along the z-axis varied from 0 to 15 pixels in 5-pixel steps (0–75 mm). These misalignments were selected to represent a range that could be encountered in clinical practice. These tests were repeated for multiresolution and single-resolution techniques, for different similarity measures (MI and NMI), for the registration of emission and transmission pairs, and for the registration of emission or transmission data alone for 5 alphabetically selected datasets. Because the correct position was unknown in this experiment with clinical data, we defined the correct position to be the mean transformation for all registrations starting from different initial positions, which were labeled by the observer as “correctly aligned.” The reproducibility error was subsequently defined as the mean of absolute differences from that correct position for each of the registration parameters. All registration results with various combinations of parameters (300 tests in total) were also visually assessed by 2 observers and failures were recorded. Visual success was defined if a 9-parameter transformation was close to the correct alignment, without considering the remaining nonlinear mismatch.
On the basis of the tests described in the previous section, the most optimal linear registration technique was chosen. Subsequently, the results of the linear and nonlinear registration for all original 18 datasets (15 breath-hold, 3 normal breathing) were evaluated by 2 observers. Linear registration was judged without considering the remaining nonlinear mismatches in the diaphragm or thoracic area. Warping results were assessed visually, separately by 2 observers, and also quantitatively by comparing the lung volumes determined from the inspiration CT scans and from the transmission PET scans before and after warping was applied. All computing times were recorded.
RESULTS
During the reproducibility test of the linear registration, the use of emission data only (EM) resulted in 30 failures out of 100 as visually assessed (70% success rate). The use of transmission data (TR) resulted in 16 failures out of 100 (84% success rate). The use of the combination transmission and emission and data (TR+EM) resulted in 5 failures out of 100 (95% success rate) as determined visually. The reproducibility error of the registrations, for these 3 methods, has been evaluated quantitatively and the results are presented in Table 1. The reproducibility error was evaluated for the subset of the registration results, which have been determined as successful visually (to avoid bias by clearly failed results). The reproducibility error was similar for the TR+EM registration and TR registration but seems to be higher for the EM registration. We also did not observe difficulties in convergence of the algorithm when increasing the initial misalignment. Figures 3A and 3B show the errors in the translation parameters resulting from the initial translational misalignment and initial rotational misalignment, respectively, for the TR+EM MI registrations.
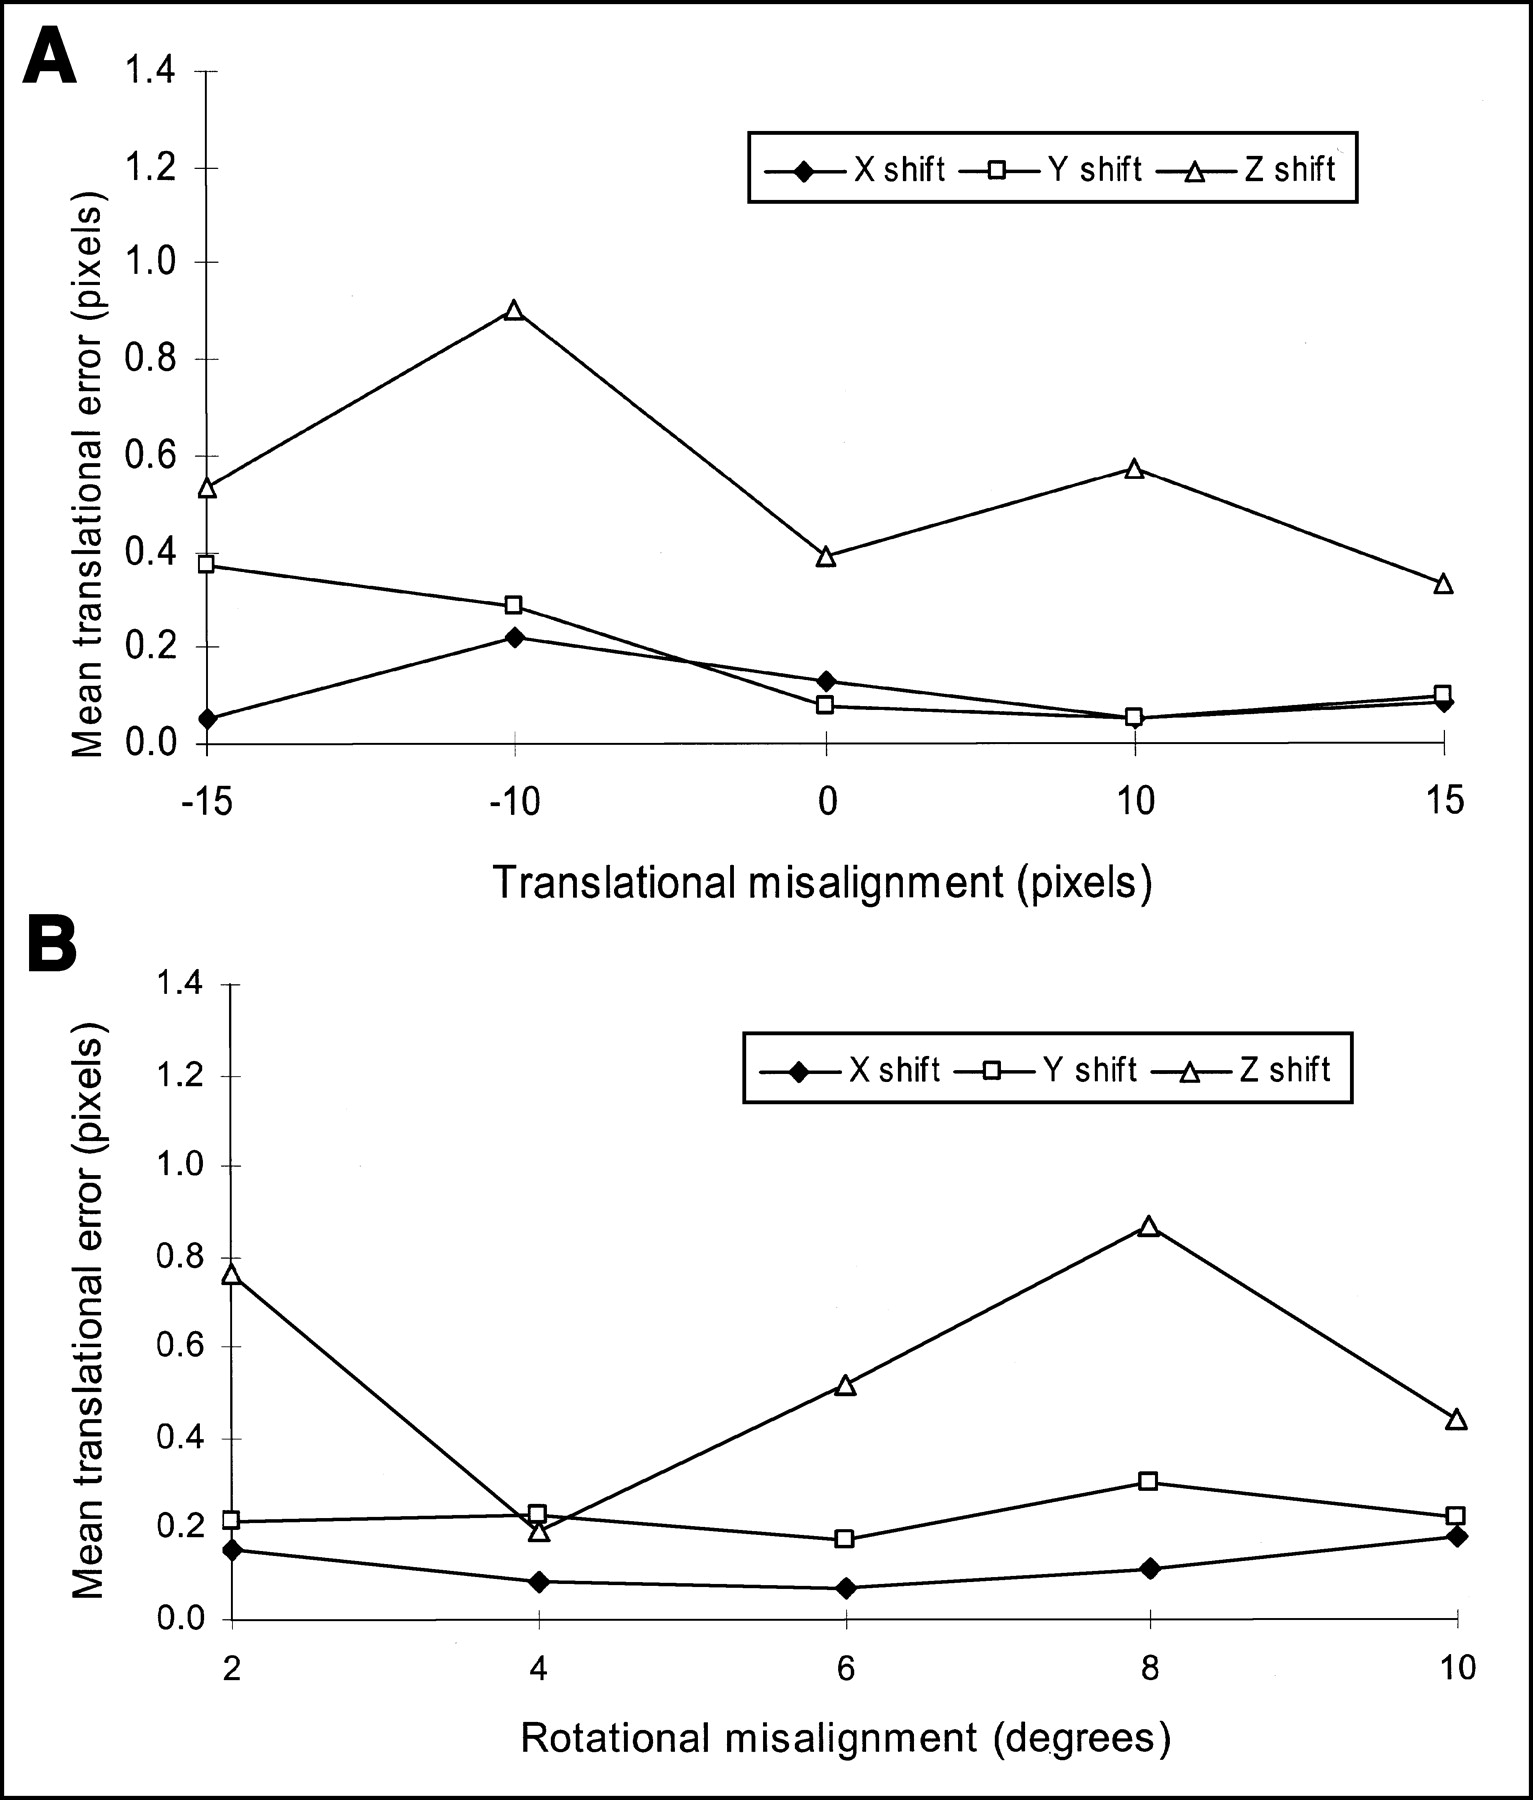
Errors in translational parameters after image registration as function of initial translational (A) and rotational (B) image misalignment.
Reproducibility of TR, EM, and TR+EM Image Registration
Registration using the NMI criterion was converging faster than the MI criterion (n = 212 ± 92 iterations vs. 532 ± 92 iterations in 1 resolution pass). The number of failures that occurred during MI registration was 2 out of 50 (96% success). For the NMI registration, the number of failures was 5 out of 50 (90% success). Both MI and NMI were tested using a combined emission/transmission (TR+EM) registration. In addition, the reproducibility error of the registration using the MI criterion appeared to be better than the NMI-based registration for the combined emission/transmission registration (Table 2).
Reproducibility of Image Registration Using MI and NMI Criteria
The use of the multiresolution registration algorithm resulted in the decrease of the registration time, despite the larger number of iterations (Table 3). The typical processing time on an Intel Pentium 2-GHz processor is <40 s. Please note that the specific results in Table 3 were obtained on a slower SPARC (Sun Microsystems) computer.
Performance of Algorithm for Various Multiresolution Levels
Multiresolution also improved the initial convergence and reproducibility of the registration (16/18 successfully registered datasets without multiresolution vs. 18/18 successfully registered datasets with multiresolution). On the basis of these results, the MI registration with multiresolution and with combined transmission/emission/data (TR+ EM) was selected as a method of choice before further nonlinear processing was applied.
The linear registration of all original 18 datasets using MI, multiresolution, and EM+TR combination was considered to be aligned automatically as close as possible to the correct position by translation, rotation, and scalings, as judged by the 2 observers. In 8 cases (3 normal breathing, 5 breath-hold), there was no visible diaphragm misregistration after applying the 9-parameter transformation. In the remaining 10 cases, there were evident nonlinear misregistration errors in the diaphragm area that were further corrected by the nonlinear algorithm. After application of the nonlinear algorithm, all registrations were judged successful. The differences between the original unregistered and registered positions were up to 20 pixels. The biggest differences were in the Z direction. Scaling parameters were adjusted up to 115%, the largest amount also in the Z direction.
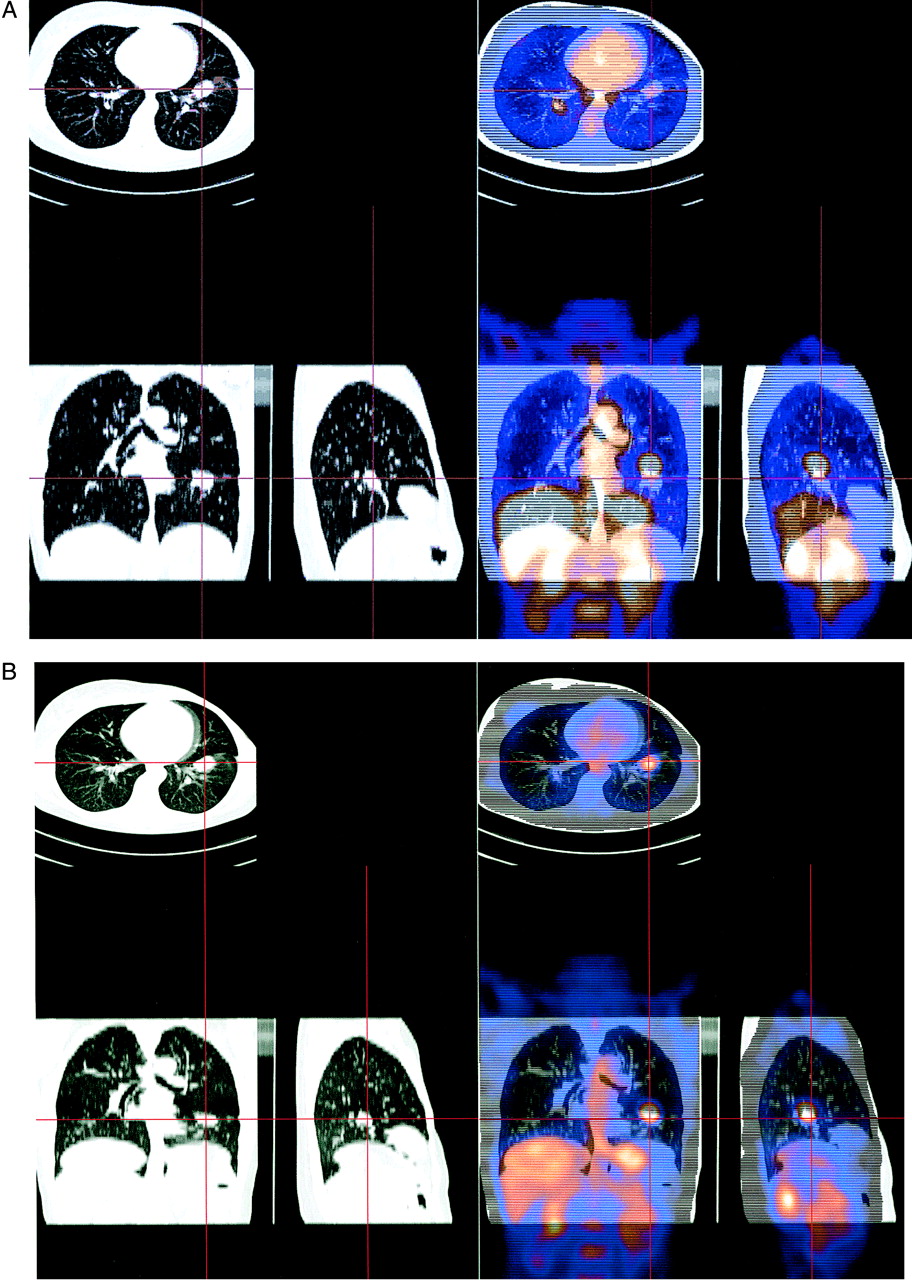
Figure 4A represents the results of the linear registration with the CT acquired during deep breath-hold. In this case, the misalignment in the diaphragm area is evident and 9-parameter registration could not correct for the diaphragm displacement. Note large differences in the axial field-of-view extent between CT and PET, which has not caused difficulties for the automated registration algorithm. Figure 4B shows an example of the linear registration in the case of both CT and PET acquired during normal breathing, where no remaining nonlinear differences are visible.

Results of registration in case of deep-inspiration CT acquisition registered with normal-breathing PET (A) and normal breathing during CT and PET acquisition (B). In both cases, only linear registration module was used without warping correction.
Examples of corresponding point pairs identified by the ray tracing module are presented in Figure 2A on selected orthogonal slices of segmented CT and segmented transmission data and are also shown in 3D as warp vectors in Figure 2B. The maximum size of these 3D warp vectors between the linearly registered CT and PET scans was found by the algorithm to be 75 mm in the Z direction (diaphragm motion) and 42 mm in the axial planes (chest motion).
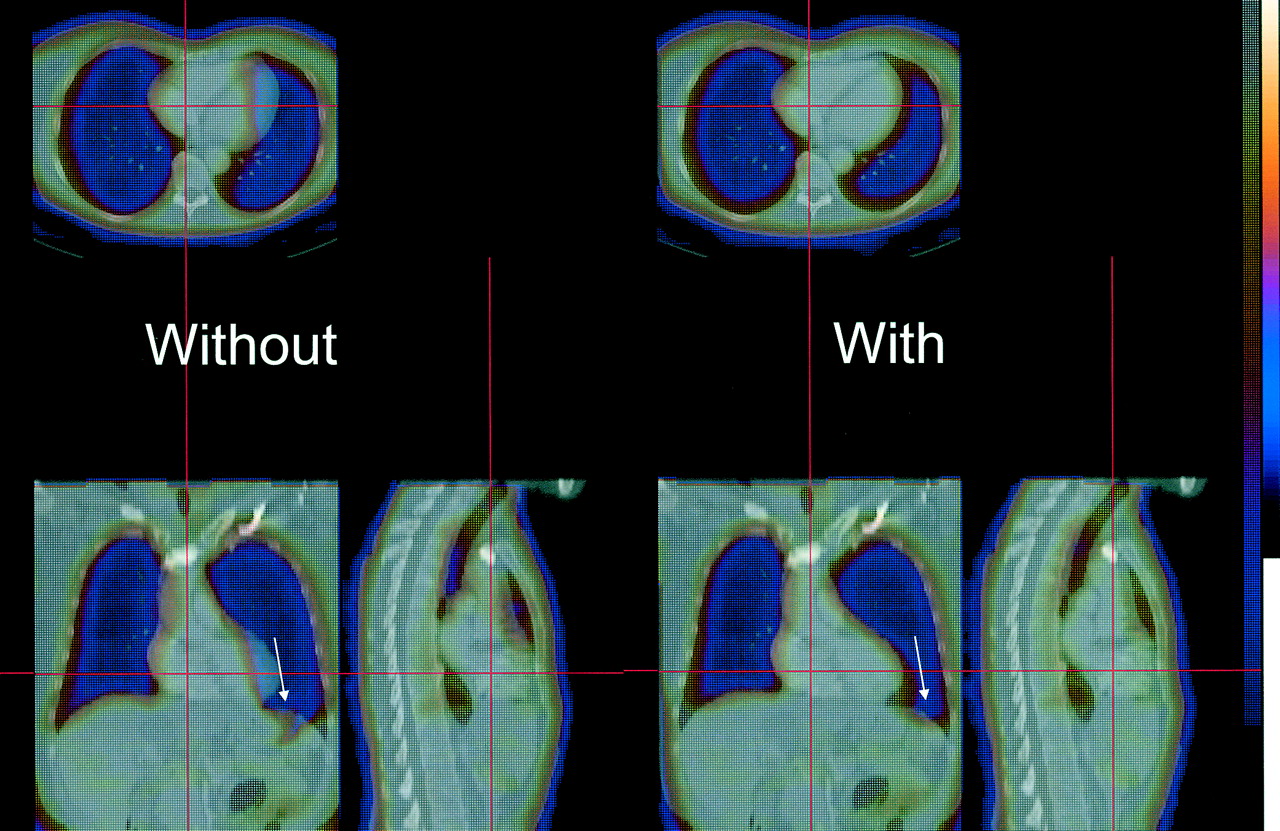
The median vector filtering technique eliminated the warping artifacts due to noncollinear warp vectors in close proximity to each other. Figure 5 illustrates the warping artifact before applying the median vector filtering (left) and the subsequent improvement of the alignment after the algorithm was applied (right). In addition to eliminating the artifacts, the filtering allowed reduction of the number of the point pairs, from the 270–400 range before filtering to the 225–365 range after filtering (on average, by 10%), which also resulted in the proportional decrease of the processing time. The nonlinear algorithm execution time is <30 s on a Pentium 2-GHz computer.

Example of warping artifact due to opposite displacement vectors in close proximity (left) and result of median filtering (right). Arrows indicate location of artifact.
The warping has been evaluated visually and judged successful in all 15 cases. In addition, lung volumes determined from segmented transmission and CT scans were calculated before and after the warp. Table 4 contains the transmission lung volume measurements compared with the CT lung volume measurements. The warped volumes match the CT volumes better, without a bias in the measurement, indicating correct selection of parameters for the lung segmentation.
Lung Volumes Measured on Segmented CT Scans, Original Transmission Scans, and Warped Transmission Scans
For each case, the MI values were evaluated before and after warping. After warping, the MI cost function between the CT and warped PET TR volumes increased for all cases. The average increase in the cost function calculated after data warping, as compared with only linear registration, was 12%. This indicates that the image warping improved the statistical dependence of the matched datasets over the best value obtained with the linear registration.
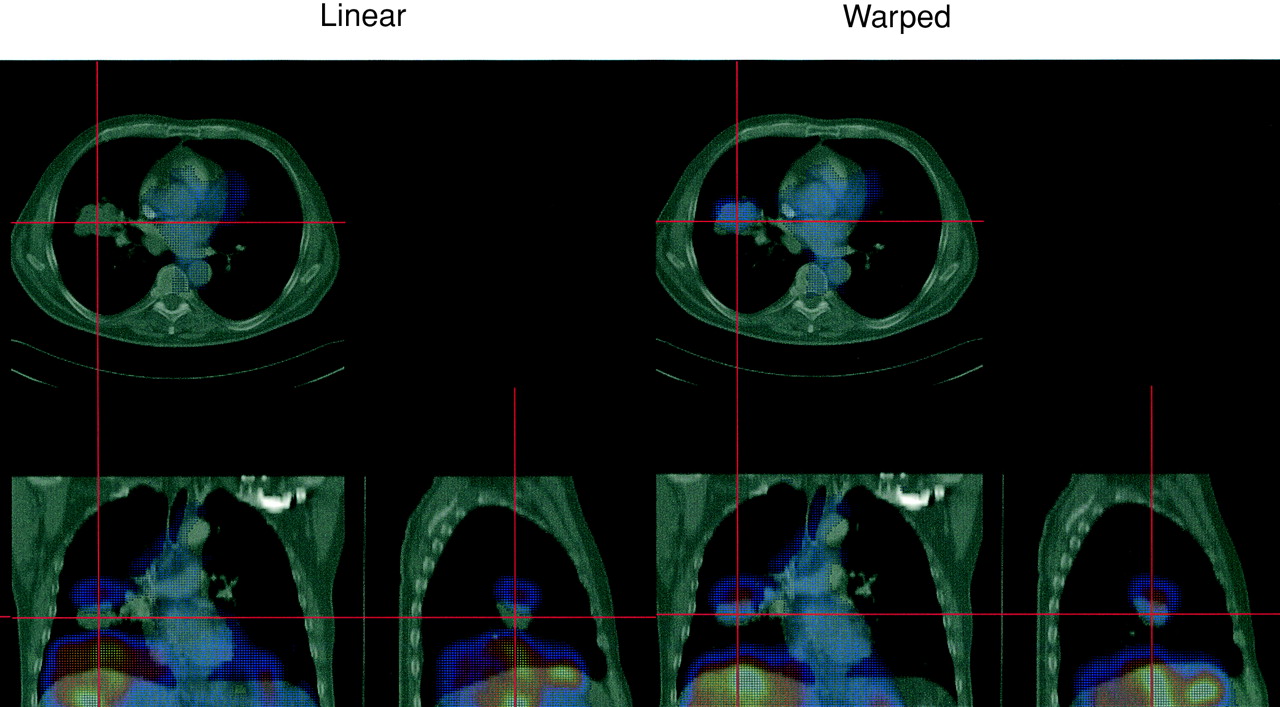
The results of the image registration before and after warping, for 2 typical cases, are shown in Figure 6 (CT/PET transmission overlay) and Figure 7 (CT/PET emission overlay). In these 2 cases, there is a large mismatch in the diaphragm area when only linear registration has been applied. The linear registration results in the PET emission liver activity being placed in the lung area after fusion (Fig. 7, left). The nonlinear correction corrects this effect, which is shown with the warped transmission map (Fig. 6B) and with warped emission data (Fig. 7, right).
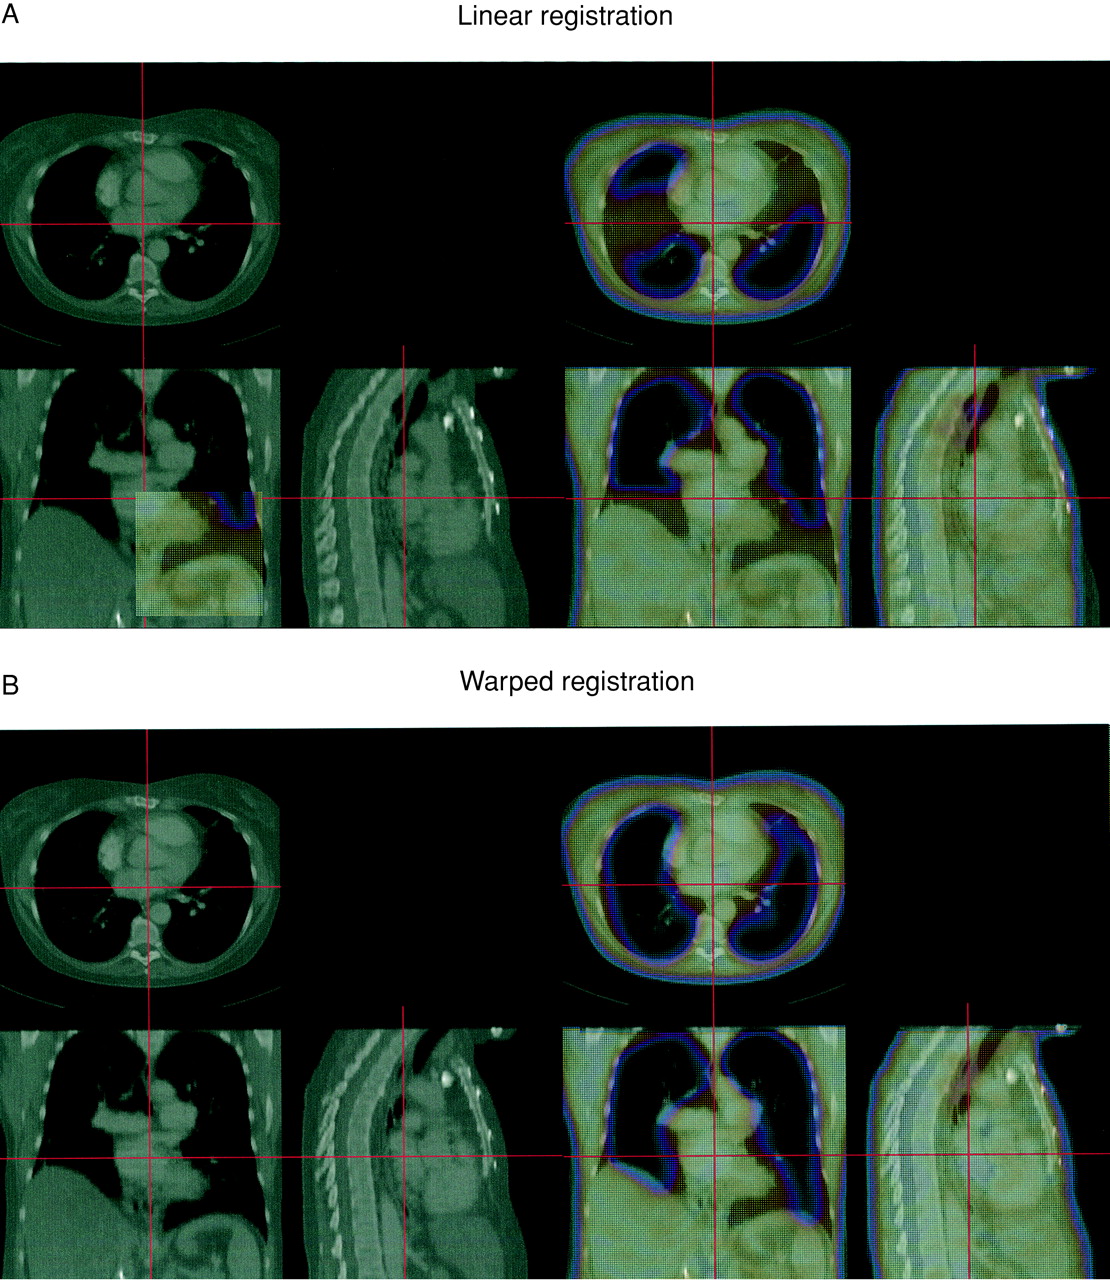
Final registration results in case of large diaphragmatic displacement shown on transmission–CT fusion images before warping (A) and after warping has been applied (B).
Final registration results in case shown on emission PET/CT fusion images before warping (left) and after warping applied (right).
DISCUSSION
Linear and nonlinear thoracic PET/CT registration has been attempted by some investigators previously. Yu et al. described a linear surface-based method using only the transmission scans (8). Nonlinear methods based on dividing the volume into several subvolumes have been proposed (11,13, 28). Our method is designed to perform with clinically acceptable speed, using accelerated techniques (multiresolution, accelerated warping). At the same time, the algorithm performs warping based on a large number of points, which allows a high degree of nonlinear deformations. In contrast to previous approaches, we use a 2-stage approach with clear distinction between the linear and nonlinear phase. The nonlinear phase could be an optional technique in case of breath-hold CT acquisition. In our protocol, both PET scans and CT scans were performed with arms elevated. In some PET protocols, the patient scan is performed with arms down along the body; this configuration would create additional deformation in the thorax as compared with CT, which could be possibly corrected by the warping technique. In our study, however, the main reason for the deformation was the position of the diaphragm. More studies would be needed to validate the use of our warping technique in such situations. The linear 9-parameter registration performed reasonably well in cases without large respiratory mismatch, which presumably would be the case when PET scans are to be registered to simulator CT data for radiation therapy planning, or if a fast low-dose, normal breathing CT would be performed in addition to the diagnostic CT for fusion purposes.
An alternative to the nonlinear image registration approach is to perform multiple iterative warps by iteratively maximizing MI because our results indicate it increases after a correct warp. This approach, however, would require a massive amount of computing time because the number of warping parameters in our technique is very large (hundreds) in comparison with a 9-parameter search for the linear transformation. Others attempted to maximize measures of MI with a smaller amount of nonlinear parameters (12), but this number would not allow the smooth local deformations needed in this application. At the same time, we wanted to ensure that warping with such large number of parameters does not introduce spurious local deformations due to the noise in the data; therefore, we smoothed the warp vectors, using local median filtering.
The novel use of combined emission and transmission datasets allows a high degree of initial convergence and full automation of the algorithm. However, the final warping transformation is based on the transmission data alone, ensuring the independence of the functional uptake of the radiopharmaceutical. Including functional emission image in the warp determination could lead to errors, for example, if a part of a lesion visualized on a CT scan is necrotic and does not exactly match the CT anatomic volume.
This study has been applied to thoracic PET/CT scans, in which the full lung coverage was present on both transmission and CT scans; alternative strategies have to be designed for warping of abdominal or head and neck scans because the deformation may be more complex in these areas. In addition, the axial sampling of the CT in this study was 5 mm, which reduces the accuracy of the diaphragm position determination due to possible artifacts in that area. Furthermore, the ray-tracing algorithm to model the lung expansion is to some extent arbitrary and may not truly reflect the mechanical properties of the lungs. Further work in this area is required to establish the best deformation method of the lung that would closely follow the individual respiratory cycles. We also investigated only a subset of possible breathing patterns—namely, breath-hold and a limited number of normal breathing scans. Our approach would need to be validated in other situations, such as imaging during normal expiration or maximum expiration (29). The acquisition of the respiratory gated CT datasets may be required to validate the improvements in the software warping methods.
The principal difficulty in validating the proposed approaches is the lack of a gold standard to determine the algorithm success. Only indirect, “ proxy” measures of the registration can be obtained—for example, the algorithm convergence, reproducibility, and visual assessment. Typically, image registration algorithms have been validated with external fiducial markers in the brain but, in the case of soft tissue and internal organs, this approach is not feasible. We are currently investigating a validation approach that would use the data from the hybrid PET/CT scanner as the gold standard, with PET volumes arbitrarily misaligned using computer software before the re-registration. The validation could then assume the original PET/CT position to be the gold standard. The errors in the intrinsically fused hybrid scanner PET and CT data alignment, however, have been reported to be up to 11 mm in the diaphragm area (30), despite being collected during a single imaging session without apparent patient motion. Therefore, the use of such imperfectly aligned PET/CT data as a reference for the registration algorithm may result in incorrect estimation of the registration errors.
The evaluation of the linear algorithm suggests that the combination of the emission and transmission data, coupled with the multiresolution strategy and MI optimization, is the most effective in this application. Although normalized MI has been suggested as the more optimal technique in brain registration applications (21), we have found that this criterion resulted in less exhaustive search and more failures, when coupled with the simplex minimization algorithm, at least for the type of data tested. The multiresolution strategy allows better convergence and allowed a 95% success rate of the linear component despite of large misalignments (up to 15 pixels); this is due to the fact that initially a more rapid search is performed, allowing more extensive search of the alignment parameters. Use of the multiresolution step reduces the effect of the local-minima entrapment and increases the overall speed of the algorithm and, therefore, it should be always used.
We found that combination of the emission and transmission data results in the best convergence. Most previous approaches have been using exclusively one of the scans (emission or transmission) for the registration. The improved convergence can be most likely attributed to additional information present in both images. For example, spine and kidney structures are well visualized on the emission scans but are not visible on the transmission scans. On the other hand, the external body outlines and lungs are well visualized on the transmission scans. Further improvement of this technique may involve use of the multivariate image registration approach (31) to separate the emission and transmission volumes during the evaluation of the cost function.
The nonlinear image registration is difficult to validate quantitatively without a gold standard. Therefore, we relied primarily on visual verification of the results. One objective measure of the nonlinear alignment is the value of MI after the warp because this measure was not directly used during the warping process. The MI value increased in all cases, indicating that the warping technique applied after linear registration, although based on lung and body surfaces, further improves the statistical dependence of the coregistered volumes. Another quantitative measurement of the warp performance is the comparison of the lung volumes before and after the warp, as performed in this study (Table 4), indicating that lung volumes are similar after warp.
In the light of the recent introduction of PET/CT hybrid scanners (1), the software approach can be viewed from 2 perspectives. On the one hand, it allows automated fusion of PET and CT when only stand-alone PET and CT scanners are available, which can be the case in many departmental configurations. On the other hand, it allows merging of the data irrespective of the time of the acquisition, which is potentially a great benefit for the PET or PET/CT systems for follow-up data comparisons and for the registration with other modalities and additional CT scans. Although the presented method was applied to register and warp transmission data to the CT data, conceivably we could apply a similar technique to the registration of serial CT scans (because the ray tracing was performed on the segmented CT data). In addition, there may be situations when breath-hold CT in the inspiration phase is required and then PET/CT data may be acquired with a second low-dose CT, which would then need to be coregistered to the high-quality inspiration-phase CT using our approach. A future improvement of the registration could be accomplished by the respiratory gated PET coregistered to the inspiration CT (32). Similar registration techniques have been suggested for CT/MRI registration (33) and, therefore, it is likely that such an approach could be used for the registration of PET images to MRI and other modalities.
The automatic PET/CT image registration has several clinical applications. As reported in PET/CT studies, the use of image fusion changed the disease management in 20%–30% of cancer patients (34,35). Coregistered data can also be used in radiation treatment planning applications. Recent reports suggest that planning of radiation therapy is significantly modified when coregistered data are used (36). Further applications of coregistered PET/CT imaging can be explored, such as CT/PET-guided biopsy or image-guided surgery.
CONCLUSION
We have developed a practical and fully automatic algorithm for image registration of thoracic CT and whole-body PET, which includes a nonlinear step for adjustment of normal-breathing PET to inspiration CT. This technique may be applied for automatic fusion of PET and CT acquired at different times on stand-alone scanners.
Acknowledgments
The authors thank Aaron So and Mahmoud Baddredine for the assistance in data analysis. Travel support for authors and image processing workstation was provided by Nuclear Diagnostics, AB (Stockholm, Sweden).
Footnotes
Received Nov. 18, 2002; revision accepted Mar. 14, 2003.
For correspondence or reprints contact: Piotr J. Slomka, PhD, Department of Imaging, Cedars-Sinai Medical Center, #A047 8700 Beverly Blvd., Los Angeles, CA 90048.
E-mail: Piotr.Slomka{at}cshs.org
REFERENCES
In this issue


Jump to section
Related Articles
Cited By...
- Automated Motion Correction for Myocardial Blood Flow Measurements and Diagnostic Performance of 82Rb PET Myocardial Perfusion Imaging
- Nonrigid Versus Rigid Registration of Thoracic 18F-FDG PET and CT in Patients with Lung Cancer: An Intraindividual Comparison of Different Breathing Maneuvers
- Quantitative Analysis of Myocardial Perfusion SPECT Anatomically Guided by Coregistered 64-Slice Coronary CT Angiography
- Motion-Frozen Myocardial Perfusion SPECT Improves Detection of Coronary Artery Disease in Obese Patients
- Dual-Modality Imaging: Combining Anatomy and Function
- Optimized Contrast-Enhanced CT Protocols for Diagnostic Whole-Body 18F-FDG PET/CT: Technical Aspects of Single-Phase Versus Multiphase CT Imaging
- Automated 3-Dimensional Elastic Registration of Whole-Body PET and CT from Separate or Combined Scanners
- Comparison Between 18F-FDG PET, In-Line PET/CT, and Software Fusion for Restaging of Recurrent Colorectal Cancer
- "Motion-Frozen" Display and Quantification of Myocardial Perfusion
- Software Approach to Merging Molecular with Anatomic Information
- PET/CT: Panacea, Redundancy, or Something in Between?