


Abstract
Gated myocadial perfusion SPECT (MPS) incorporates functional and perfusion information of the left ventricle (LV). To improve the image quality and accuracy of gated MPS we propose to eliminate the influence of cardiac LV motion in the display and quantification by a novel “motion-frozen” (MF) technique. Methods: Three-dimensional LV contours were identified on images of the individual time phases. Three-dimensional phase-to-phase motion vectors were derived by sampling of the epi- and endocardial surfaces. A nonlinear image warping (thin-plate spline) was applied to warp all image phases to fit the end-diastolic (ED) phase. Warped images were created to provide the LV image in the ED phase but containing counts from an arbitrary number of time intervals. MF quantification has been performed using the same phase-to-phase motion vectors. MF normal perfusion limits were created from 99mTc sestamibi gated MPS studies of 40 females and 40 males with low likelihood (<5%) of coronary artery disease. All MF processing was completely automated. In the initial evaluation, we assessed the display quality and quantification of stress images using MF processing in 51 consecutive patients with 16-frame electrocardiographic gating and available coronary angiography. Results: The display quality was significantly better for MF images as assessed visually. The MF images had the appearance of ED frames but were less noisy and of higher resolution than the summed images. MF images had higher maximum count values in the LV (116% ± 6%) and higher contrast (12.5 ± 7.7 vs. 9.5 ± 3.2) than the corresponding summed images. The area under the receiver operator characteristic curve for prediction of stenoses ≥ 70% by the MF method was 0.92 ± 0.04 versus 0.89 ± 0.04 by standard quantification (P = not significant). The computation time for automated MF quantification and warping was <25 s for each case. Conclusion: We have developed a novel technique for display and quantification of gated myocardial perfusion images, which retrospectively eliminates blur due to cardiac motion. Such processing of gated MPS appears to improve the effective resolution of images. Initial evaluation indicates that it may improve the accuracy of gated MPS in detection of coronary artery disease.
Myocardial perfusion images, which are used routinely for evaluation of the perfusion information, are blurred by cardiac motion, which could presumably lead to decreased image quality and consequently degraded diagnostic performance. Currently, most laboratories use gating for poststress data acquisition as recommended by the American Society of Nuclear Cardiology (1), since gating allows evaluation of cardiac function in addition to perfusion (2). In addition, gating provides the opportunity to remove the blurring of perfusion images caused by motion. Methods for normal limits-based quantification of myocardial perfusion SPECT (MPS) have been described by several investigators (3–7). All of these quantification methods, however, use ungated normal limits and derive perfusion information from summed images. In a previous report (8), investigators found that sensitivity of myocardial perfusion increased when using selected end-diastolic (ED) frames for the visual assessment of MPS in women, suggesting that the image blurring due to motion may have a significant effect on the results of quantification. The quantification of ED images, however, is not optimal, since only a fraction of the counts is used and image noise could be a limiting factor.
In this study, we present the design and initial evaluation of a novel “motion-frozen” (MF) display and quantification method for gated myocardial perfusion imaging, which eliminates blurring due to cardiac motion. In this method, gated MPS images are analyzed after cardiac motion tracking and 3-dimensional (3D) motion correction as reported in a preliminary communication (9). Such MF perfusion images have a visual appearance similar to the ED frames but they contain counts from all cardiac cycles. Image quantification scheme uses the motion information to derive cardiac “motion-corrected” polar maps.
MATERIALS AND METHODS
MF Method
“Motion-freezing” is accomplished by detection and subsequent motion tracking of the left ventricular (LV) endo- and epicardial borders. For display purposes, we apply nonlinear image warping of all, or selected, cardiac phases to the spatial position of the ED phase. Motion-frozen polar maps are created by deriving individual average polar map samples, as defined by the gated 3D contour, for each portion of the cardiac cycle. All software has been implemented in C++ language on a Microsoft Windows platform. Derivation of MF images and polar maps is performed in a fully automated fashion without human intervention.
Detection of LV.
Detection of epi- and endocardial surfaces on the gated SPECT images is performed using an algorithm developed previously at our laboratory (10) for the purposes of quantification of myocardial function. This method has been described and validated in detail previously (10–12). Both epi- and endocardial contour points are positioned on vectors (24 latitudinally, 32 longitudinally) normal to the midmyocardial surface represented by the ellipsoid, which is fitted to the segmented LV. The epi- and endocardial points are detected in each interval along these normal vectors using asymmetric gaussian fitting of count profiles (10). The valve plane is determined separately for each interval by plane-fitting to the surface points lying on the basal boundary. Points on one side of the valve plane are classified as belonging to the LV, whereas points on the opposite side of the valve plane are not used in the motion tracking. Torsion of the LV is not included in this model, as normal vectors retain their direction through the cardiac cycle.
Source points are selected by the algorithm on epi- and endocardial surfaces by intersecting them with vectors normal to these surfaces. Epi- and endocardial points placed on the same normal vector are used to form “displacement vectors” for each interval. Source points found on frames other than the ED frame are joined with the equivalent target points on the ED frame forming 3D displacement vectors (13) (Fig. 1). Such vectors are created separately for each pair of source-target images, where the target image is always the ED frame image and the source image is acquired in a phase other then ED. These displacement vectors are created separately for endocardial and epicardial surfaces allowing compensation for “wall thickening” during image warping. Typically, between 400 and 600 vectors are created for each of the 15 intervals; the exact number is dependent on the position of the valve plane. In Figure 2, we show an example of the motion between the ED and ES frames for the epicardial surface. Such motion vectors are subsequently used for the MF display and quantification.
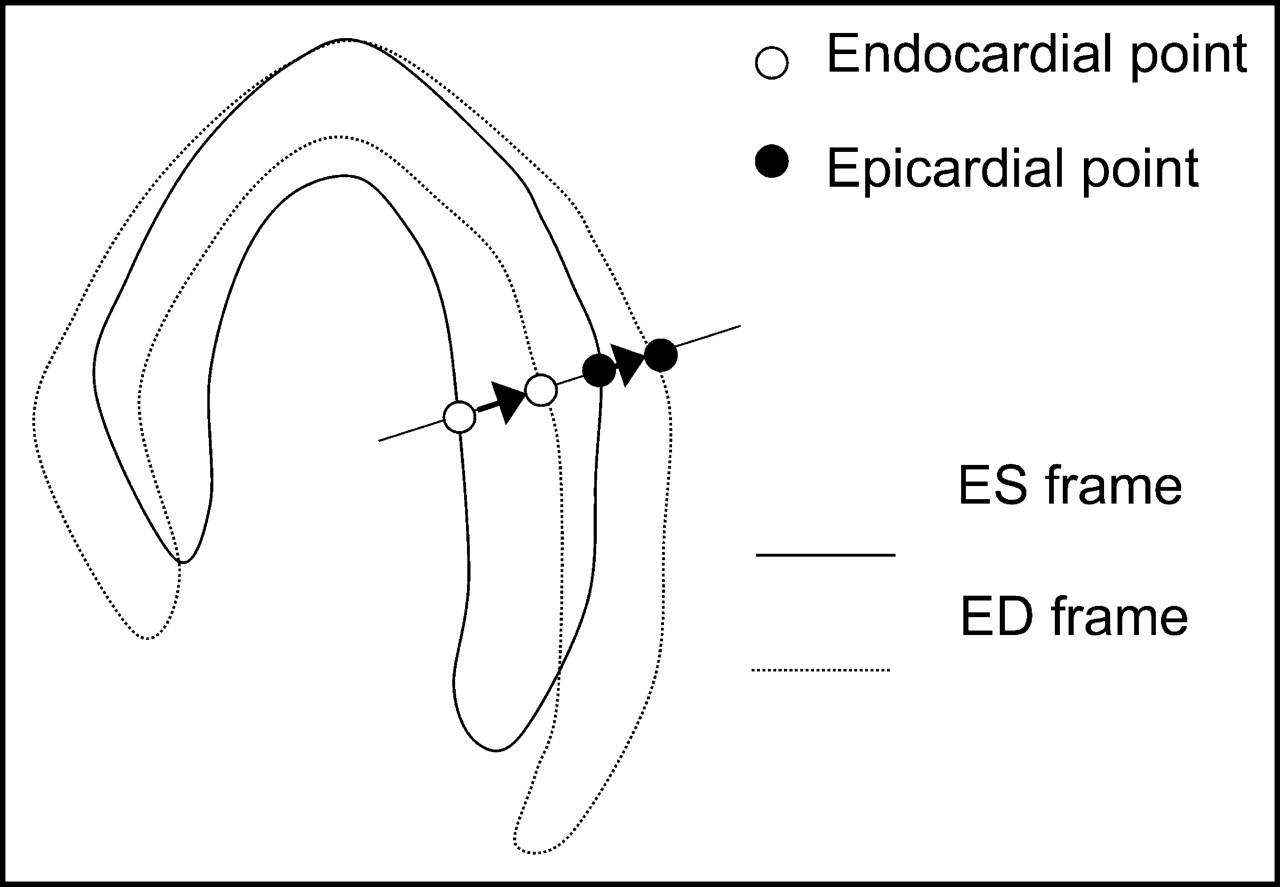
Diagram illustrating generation of source and target equivalent points. Both endo- and epicardial surfaces are used to create 2 displacement vectors for each normal profile.
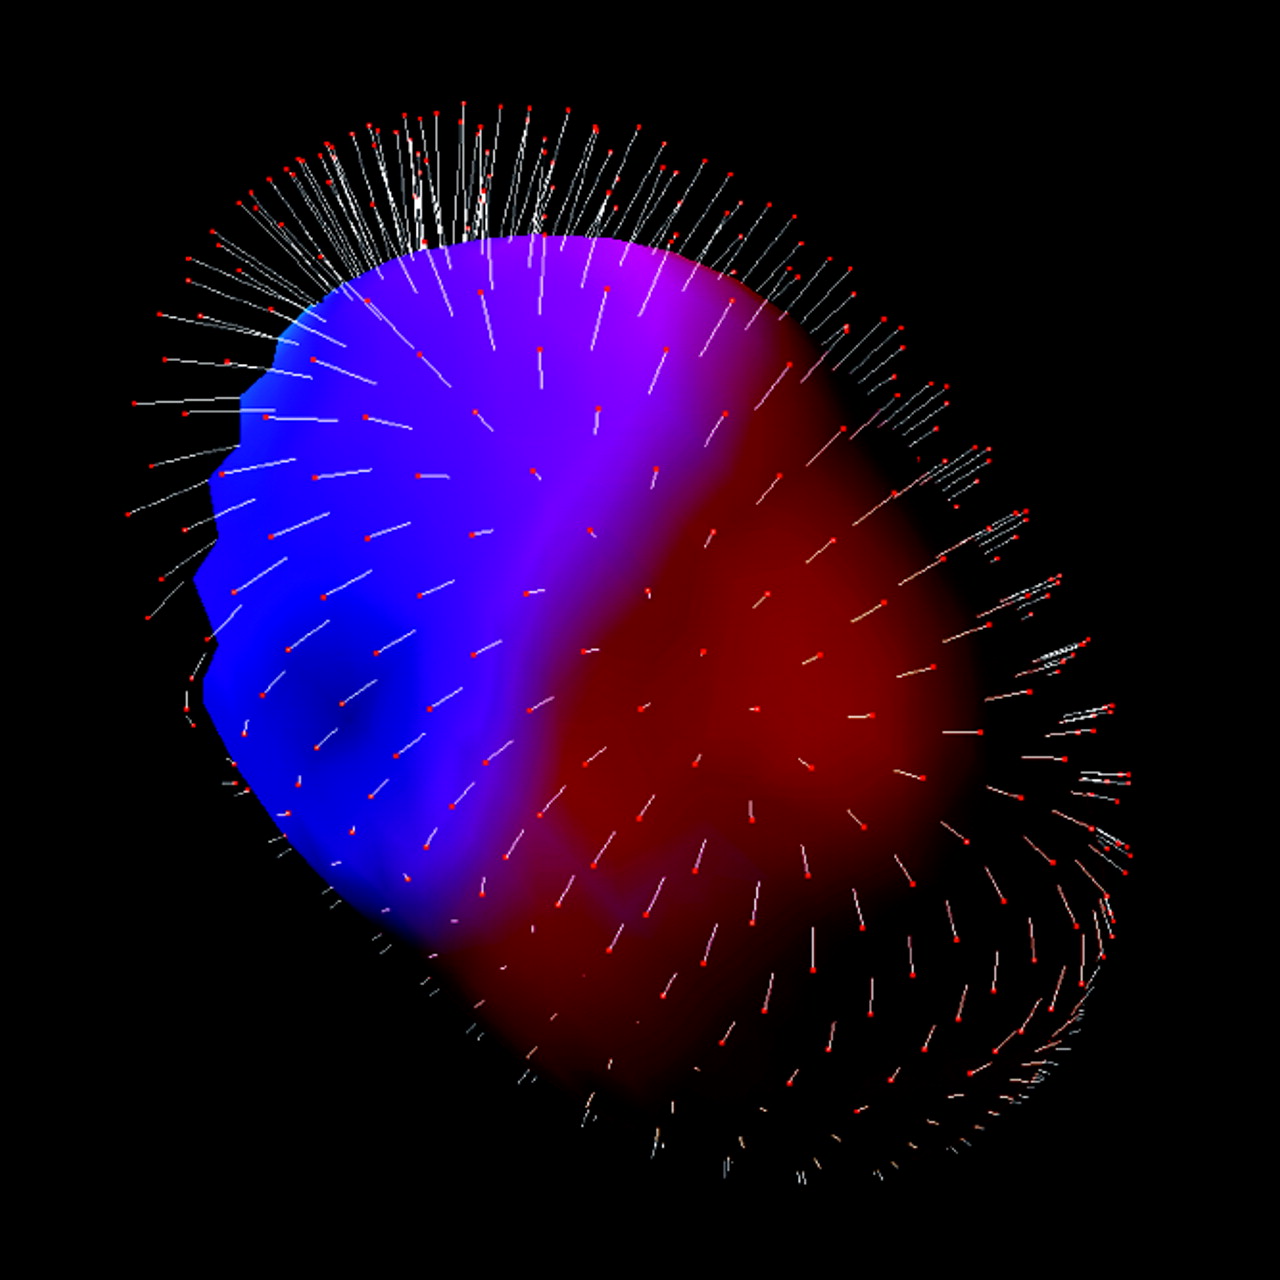
Illustration of displacement vectors used in image warping. End-systolic (ES) epicardial surface is shown with perfusion data represented in color. Displacement vectors (white) show local motion between ES and ED. ED position of epicardial surface is marked with red points.
MF Display.
We devised a MF image display technique to allow visual assessment of images, which contain counts from multiple time phases, spatially aligned to the ED phase. In this technique, derived LV contours are used in combination with a thin-plate spline (14) image warping algorithm.
The transformation of the selected image coordinates, specified by the source and target points, is explicitly defined. To achieve image warping of all image points, the transformation needs to be established for all voxel coordinates. In general, the nonlinear transform allows us to compute new positions (x′, y′, z′) for all voxels (x, y, z) according to some nonlinear function f (15):
 Eq. 1
Eq. 1
This function f is determined using all available source-target points (N) and computes the optimal transformation for each point, which minimizes the bending energy in the image (14). The thin-plate spline algorithm determines an affine transformation matrix A and a set of N weights (xw, yw, zw), proportional to the distance from the control points, which are used to compute the new coordinates for an arbitrary point in 3D in the following manner, using homogenous coordinates:
 Eq. 2 The full mathematic formulation of how the weights and the affine transformation matrix are obtained from the set of arbitrary landmarks is well described in the original reference (14). We have applied a linear radial basis function, which is appropriate for 3D (14). The endo- and epicardial contour surface on ED frames are defined as the target points for image warping. The homologous points in the remaining intervals (other than ED) have been considered as source points.
After computing the point transformation for all image voxels, a tricubic voxel interpolation is used to compute new voxel intensities for all voxels, which results in a warped volume. Warping is applied individually to each time phase, for all the selected phases. Such warped, “motion-corrected” image frames from various time bins are then summed together to provide a final MF perfusion image in the position equivalent to the ED phase. Thus, to obtain a MF image for 16-phase gated data, 15 image phases needed to be warped before summation.
MF Quantification.
After the LV contours were obtained (10), raw myocardial counts were extracted from profiles normal to the LV surfaces, and average count densities between epi- and endocardial surfaces were obtained for each profile and each time phase, individually. The number of profiles and the angular samples were standardized for all patients and were 20 and 36, respectively. This resulted in 720 samples for each of the 16 time phases. The normal database thus contained 11,520 individual samples for each patient. The number of perfusion samples for each test patient was equalized to the standard number of samples in the normal database. Thus, the individual patient perfusion data had the same number of perfusion samples as each of the patients in the normal file.
Selection of Time Intervals.
Gated perfusion samples from selected time intervals of the cardiac cycle were calculated. Such perfusion samples derived from the gated datasets could be compared with the normal limits. It was possible to select the time intervals included during the quantification for both gated studies and normal limits, without changing the normal limits file. For comparison, the quantification was performed using 38% (6/16 frames), 63% (10/16 frames), and 100% (16/16 frames) portions of the cardiac cycle (6/16, 10/16, and 16/16 MF quantification). The excluded frames were positioned symmetrically on both sides of the end-systolic (ES) frame. Subsequently, summing of the extracted motion-tracked samples from selected portions of the cycle was performed for both normal database data and patient data. Quantitative stress extent of the defect was subsequently defined as the global percentage of abnormal pixels in the polar map, created from an arbitrary number of gated frames. Abnormality threshold was set to 2.5 average deviation, which was determined to be approximately equivalent to 2.0 SD, as used in other quantitative approaches (16).
Patient Population and Acquisition Protocols
Test Patient Population.
In the initial evaluation of the MF technique, we used data available retrospectively from the nuclear cardiology database at our institution. Fifty-one consecutive patients (31 males, 20 females) with no known history of coronary artery disease (CAD) with acceptable technical quality of 16-frame gated stress 99mTc sestamibi MPS data (51/58 consecutive cases), who underwent coronary angiography within 3 mo of MPS, were considered (Table 1). Patients underwent either exercise or adenosine stress protocols as previously described (17). The definition of the “acceptable technical quality” was the following: absence of moderate or significant patient motion on projection images and no adjacent hot spots on reconstructed images that might have affected contouring of the LV. Exclusion criteria were the following: (a) prior myocardial infarction, (b) prior coronary revascularization, (c) nonischemic cardiomyopathy or valvular heart disease, and (d) change in symptoms between MPS and angiography.
Patient Characteristics and Angiographic Data (n = 51)
Normal Database Population.
Normal limits were obtained retrospectively from an additional group of 80 patients (40 females, 40 males) with very low likelihood of CAD (<5%), who had no history of CAD, no diabetes, no symptoms of typical angina or shortness of breath, normal resting electrocardiogram (ECG) and nonischemic stress ECG response, and normal stress and rest 16-frame gated MPS images. Stress acquisition was performed with either exercise or adenosine stress. Separate male and female normal limits were created.
Acquisition and Reconstruction Protocols.
MPS acquisitions were performed with noncircular orbits. Sixty-four projections at 25 s per projection for 99mTc sestamibi and 35 s per projection for 201Tl images were obtained (18). All images were subject to quality control measures. No attenuation or scatter correction was used. After filtered backprojection, image reconstruction was performed with a Butterworth filter (cutoff, 0.83 cycle/cm; order, 5), and short-axis slices were automatically generated (19).
Coronary Angiography.
Coronary angiography was performed with the standard Judkins approach, and all coronary angiograms were interpreted visually by 2 experienced physicians who were unaware of MPS results.
Standard Perfusion Quantification.
For comparison with the new technique, standard quantitative perfusion information was derived automatically from summed MPS data by the current Cedars-Sinai software (3). Normal limits from the low-likelihood patient data and the criteria for abnormality were the same as those described previously (7). Quantitative stress extent of the defect was defined as the global percentage of abnormal pixels in the polar map.
Evaluation Methods
The MF technique was assessed by visual analysis for display quality. In addition, the accuracy of detecting CAD by the motion-frozen quantification was compared with the existing quantitative technique and visual scoring. The results of the quality for the stress contour detection for all cases were evaluated by 2 expert observers, and the results were reported on a scale of 1–3 (1, excellent fit; 2, satisfactory fit; 3, failure of the fit).
Evaluation of MF Display Quality.
Three image datasets of each patient were assessed by a consensus of 2 expert observers. All images (summed, 10/16 MF, and 16/16 MF) were displayed side by side on the computer screen. Image quality was scored on a 4-point scale (4 = excellent, 3 = good, 2 = fair, and 1 = poor) in aspects of resolution, contrast, uniformity, and statistics. Observers were unaware of the type of the images. In addition, we compared the LV maximum counts in summed and motion-frozen images as well as a quantitative measure of contrast defined as the ratio of LV maximum counts in the LV to the counts in the center of the LV cavity.
Visual Perfusion Analysis.
Visual interpretation of MPS images used short-axis and vertical long-axis tomograms divided into 20 segments for each patient (18). Each segment was scored by consensus of 2 expert observers using a 5-point scoring system (0 = normal, 4 = absence of segmental uptake). By adding the 20 segment stress scores, Summed Stress Scores (SSS) were calculated as previously described by our group (20). Visual analysis was performed only for standard images as a reference method.
Evaluation of MF Quantification.
To evaluate the performance of this new technique, we compared it with the standard ungated MPS quantification and visual scoring of ungated data (18) using coronary angiography with an ≥70% stenosis cutoff as the gold standard. The receiver operator characteristic (ROC) analysis was performed, modifying the sensitivity and specificity for predicting CAD by changing the threshold for the defect extent.
Statistical Analysis
All continuous variables are expressed as a mean ± 1 SD. P < 0.05 was considered significant. For all statistical analysis tasks, we used the Analyze-It software, version 1.71 (Analyze-It Software, Ltd.). The nonparametric method for constructing ROC curves was used as described by Beck and Shultz (21). The Hanley and McNeil method (22) was used for comparing curves, since all tests are performed on the same subjects. The Analyze-It software generated the ROC curves with 40–50 threshold points depending on the data. Optimal sensitivity and specificity were defined as those yielding the minimal value for (1 − sensitivity)2 + 0.95 × (1 − specificity)2 (23). The Bonferroni correction was applied for multiple comparisons in the statistical analysis.
RESULTS
No manual intervention was performed in the derivation of the MF results. The average total processing time was 5 s for gated MF image quantification and 20 s for MF image warping and display. The contour definition was judged to be excellent in 47 of 51 cases and satisfactory in 4 of 51 cases. No failures of the contour detection were observed. The cardiac motion ranges derived from the contours, and defined as the maximum lengths of the ED-to-ES displacement vectors for each patient, are reported in Table 2. The maximum local cardiac motion range was found to be 23 mm for a male patient and 18 mm for a female patient.
Endocardial and Epicardial Cardiac Motion Ranges
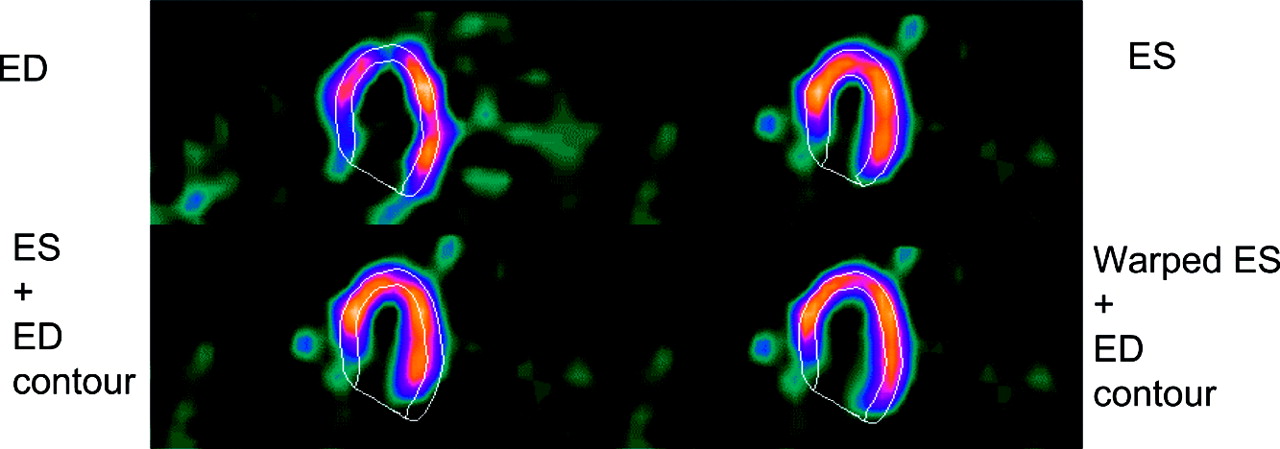
Figure 3 shows the results of MF image warping applied to the ES frame compared with the diastolic frame. The motion-corrected ES frame matches the ED contours after image warping. Such correction is applied individually to all phases of the cardiac cycle, except the ED phase.

Example of image warping applied to ES frame. ED frame is shown with ED contour (top left); ES frame is shown with ES contour (top right). ES frame is shown with ED contour (bottom left); warped ES frame is shown with ED contour (bottom right).
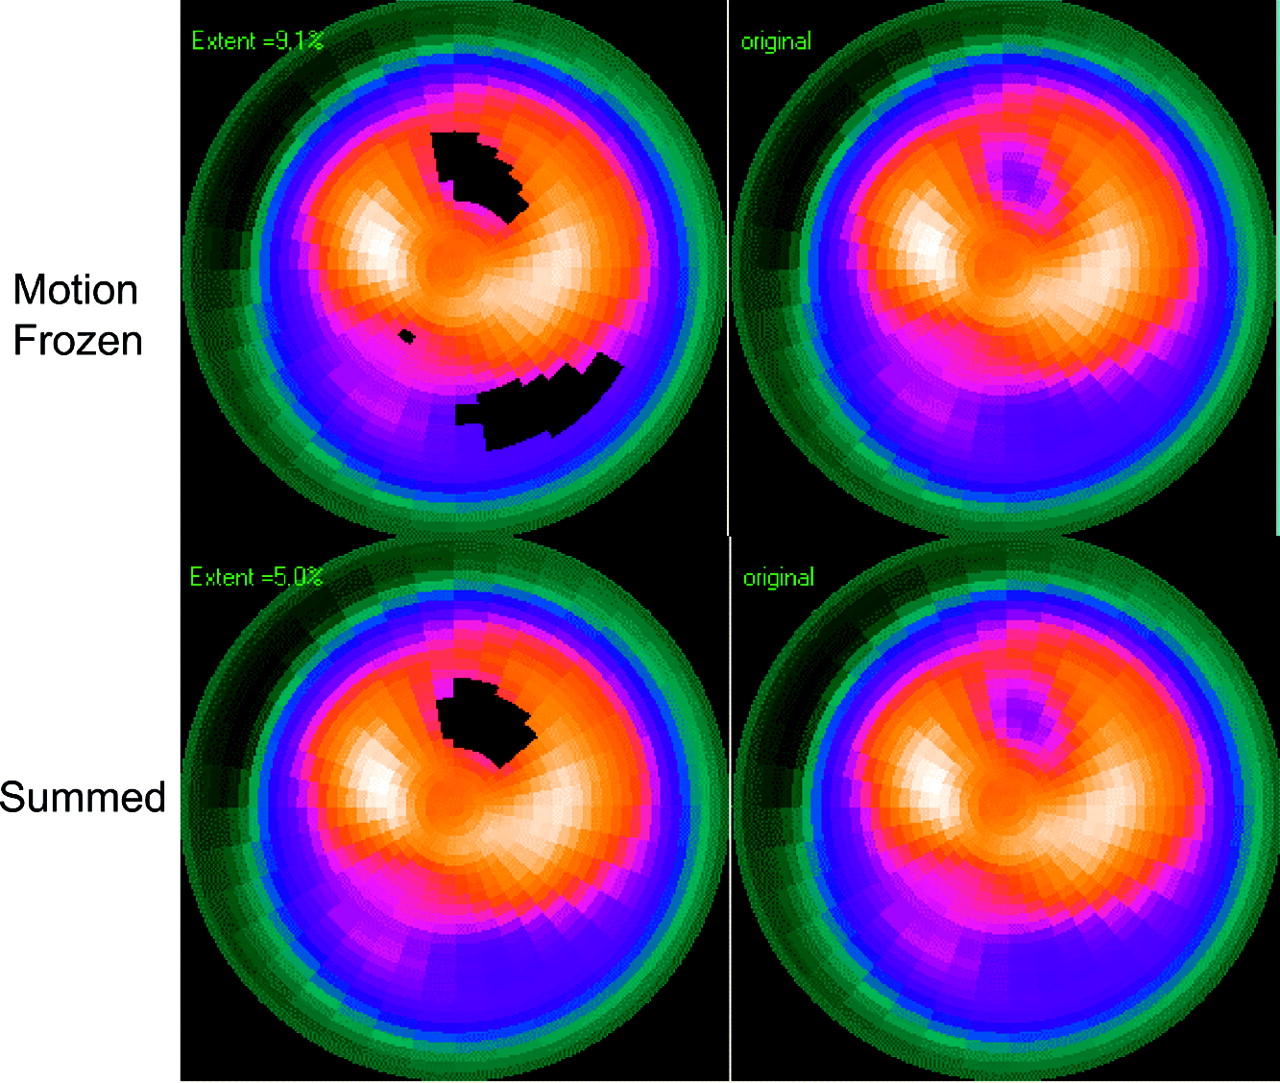
Figure 4 shows an example of the MF image warping, demonstrating the improvement in quality of the MF images, which allows better definition of subtle defects, especially in the regions with large cardiac motion such as the lateral wall. The MF images appear in the position equivalent of the ED phase but do not suffer from the noise due to the insufficient count density in the ED images. The quantification results of MF and ungated method are shown in the same patient, using polar map display (Fig. 5). One additional lesion is identified by the MF quantification. The patient underwent cardiac catheterization, which revealed 2 lesions: a complete occlusion of the diagonal branch of the left anterior descending coronary artery and 80% stenosis in the proximal portion of dominant left circumflex coronary artery.
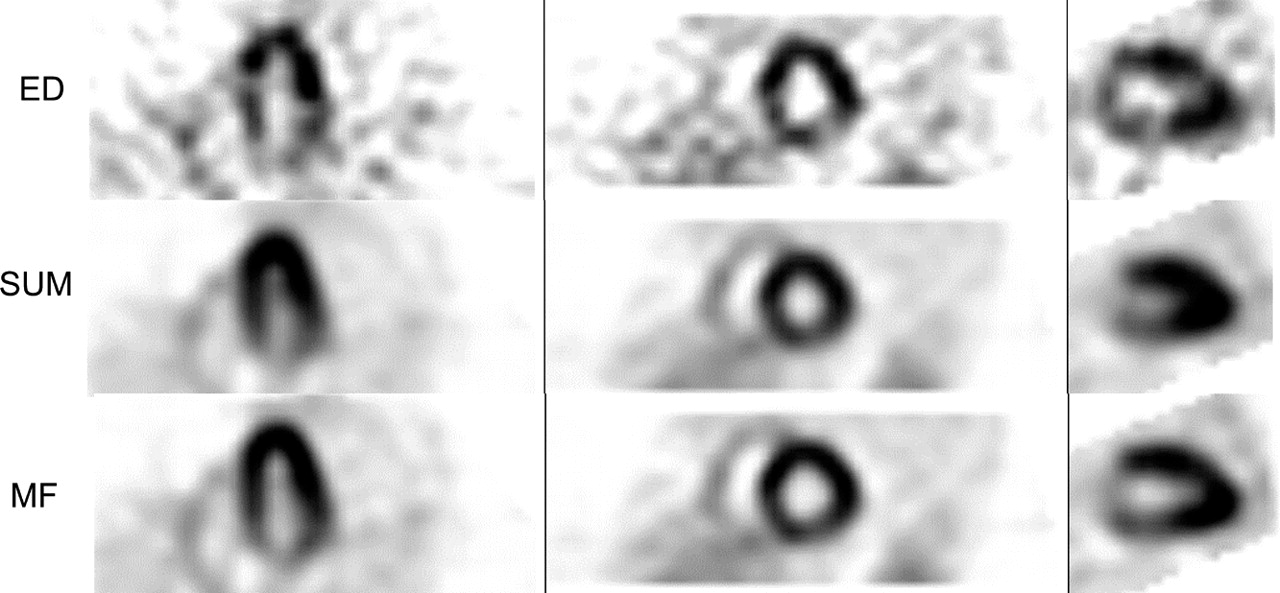
MF perfusion images compared with summed perfusion images in case of double-vessel disease confirmed by angiography (100% left anterior descending artery [LAD] occlusion and 80% left circumflex artery [LCx] occlusion). Both standard quantification technique and visual analysis of summed data identified only the LAD lesion; the additional LCx lesion was identified only by MF quantification.

Results of polar map quantification using both MF technique and standard ungated technique in case presented in Figure 4. Blackout maps (left) and raw perfusion maps (right) for MF technique and standard summed quantification (Summed) are shown.
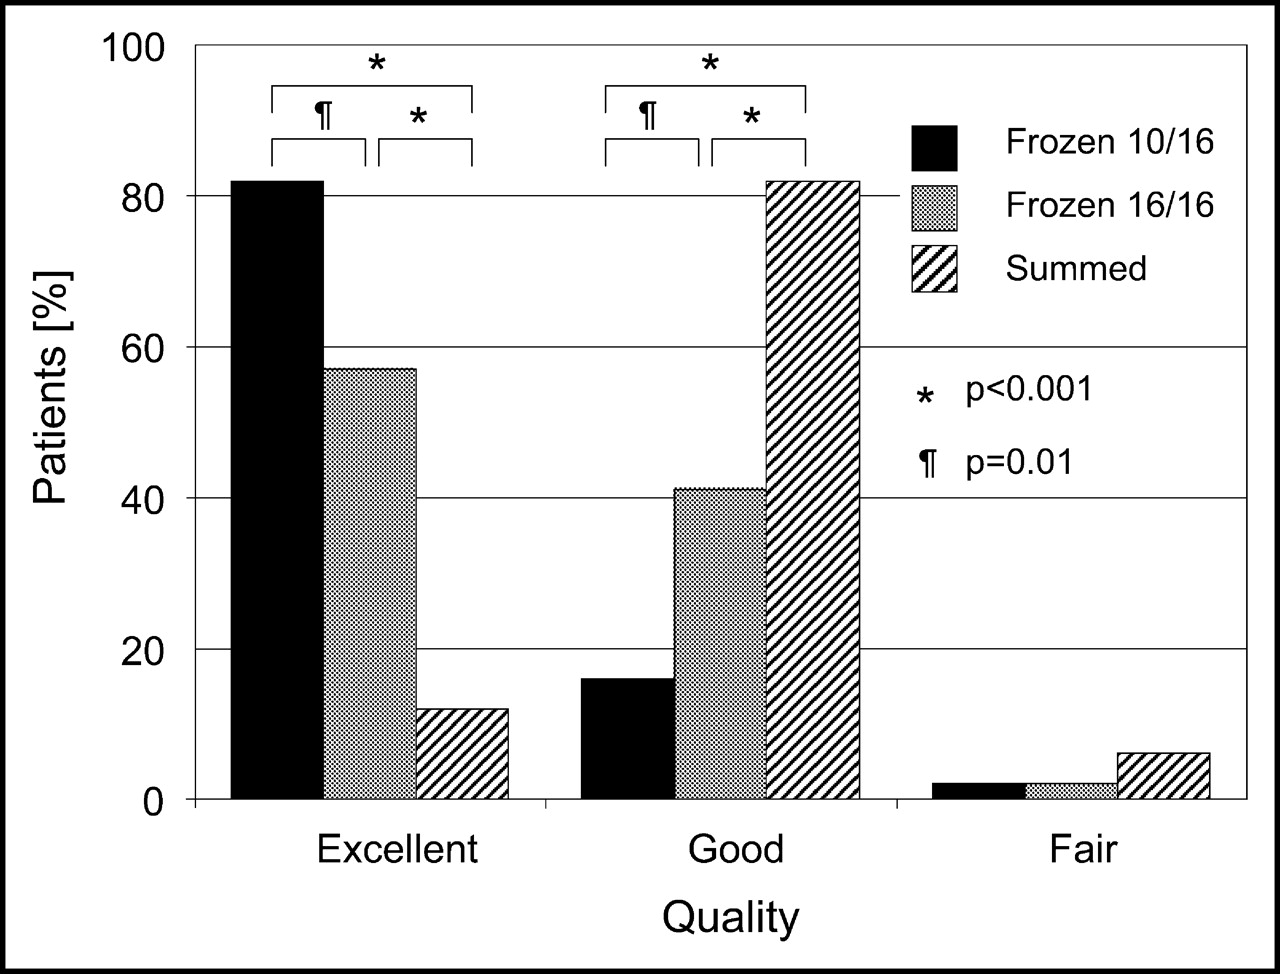
All images had at least fair quality in all datasets as evaluated by the visual observers. The 10 of 16 MF, 16 of 16 MF, and summed image datasets had ratings of 82%, 57%, and 12% as excellent; 16%, 41%, and 82% as good; and 2%, 2%, and 6% as poor quality, respectively (Fig. 6). The left ventricular cavity appeared larger on the MF images. The total counts in the MF images were proportional to the portion of the cycle used. No artifacts due to image warping were observed. The 16 of 16 MF images had almost the same total counts as the summed images (<1% difference). Small differences could be expected due to the tricubic interpolation approximations. The maximum counts were increased in the MF images due to the “deblurring” effect. The average ratio of the maximum counts in the 16 of 16 MF images using all time intervals to the maximum counts in the summed images was 116% ± 6% (largest value, 146%) and 72% ± 3% (up to 85%) for the 10 of 16 MF images. The image contrast has improved from 9.5 ± 3.2 to 12.5 ± 7.7 (P = 0.002) for the 16 of 16 motion frozen images and to 14.3 ± 7.2 (P < 0.0001) for the 10 of 16 MF images.

Comparison of visually assessed image quality for 10 of 16 motion-frozen, 16 of 16 motion-frozen, and summed images.
In Table 3, diagnostic performance is reported for the motion-frozen quantification with respect to the number of intervals used. A trend of decreased diagnostic performance is observed (defined by the area under the ROC curves), when fewer intervals are used. The decreased area under the ROC curve was mainly due to the loss of specificity. The diagnostic performance was significantly worse (P < 0.05) for 6 of 16 MF as compared with 16 of 16 MF. The area under the ROC curve for the MF technique was 0.92 ± 0.04 as compared with 0.89 ± 0.04 for the standard technique, but this difference was not statistically significant in this relatively small group of patients. These ROC curves are shown in Figure 7. Note that all points of the MF ROC curve are equal or higher to that of the standard ROC curve. One possible operating point on the ROC curve was determined as previously described (23). At that threshold the MF technique had a sensitivity of 85% and a specificity of 94% (1/17 false-positive and 5/34 false-negative). This operating point was obtained for the defect-extent threshold of 8%. The visual scoring for these patients, using SSS ≥ 4 as a cutoff, yielded a sensitivity of 85% and a specificity of 82% (3/17 false-positive and 5/34 false-negative). The sensitivity and specificity numbers are reported only for the purpose of initial comparison with the visual scoring. The visual analysis was performed with a full review of the raw projection data, gated function, and prone images and with knowledge of the patient history.

ROC curves for detection of CAD using defect extent for 16 of 16 motion-frozen and standard quantification in 51 patients.
Areas Under ROC Curve for Detection of Coronary Stenosis (≥70%) by MF Technique
DISCUSSION
In this study, we have described a new method for the display and extraction of perfusion information from gated MPS, which attempts to recover image resolution lost due to cardiac motion. The image quality was judged better on the motion-frozen images than that of the standard images. The image quality was judged best when selected ES intervals were removed. This is most likely because the systolic images have blurred appearance due to the smaller size of the ventricle and the motion-correction is not able to compensate for this. Initial results of the quantification, however, seem to indicate that the use of all intervals may be most appropriate. The overall results presented in Figure 6 show that our approach is at least equivalent to the standard quantitative and visual methods with a slightly higher performance than the standard approach, although not statistically significant in this small group of patients. It should be noted that the improvement in the identification of additional lesions (Figs. 4 and 5) is not reflected by this ROC analysis. The operating point determined to report sensitivity and specificity is arbitrary, since the reader may choose a different threshold to operate at a different level of sensitivity and specificity. Therefore, the performance of these techniques is best compared by the ROC curve analysis. The sensitivity and specificity measures need to be validated, since in this study we evaluated a small pilot group. Further evaluation of this technique should be performed in a larger group of patients.
The MF warped images (Fig. 4) were not used during the quantification process. Instead, we tracked the LV surfaces through the cardiac cycle and extracted individual, phase-specific perfusion samples. This approach is computationally more efficient and, at the same time, avoids possible pitfalls in quantification of images warped in a nonlinear fashion. Since we are summing the individual interval perfusion samples for both the normal limits and the patient data before the comparison, rather than comparing them interval by interval, this quantification scheme is not affected by possible irregularities of the cardiac cycle. Related image warping techniques have been applied previously to the simulated data and in a small number of clinical cardiac PET images (24), but without image quantification. Since PET images have higher resolution (4–5 mm), application of the MF technique might result in a larger relative improvement. Considering the amount of cardiac motion found in this study (range, 13–23 mm), which is in agreement with previous studies (25), SPECT images can also benefit from MF corrections.
In previous studies, investigators have proposed planar diastolic imaging to avoid the limitations of summed perfusion imaging (26). In one study, diastolic SPECT images were quantified (27) and a high agreement with ungated imaging was established, but without correlating coronary angiographic data. In a previous study, Taileffer et al. (8) reported increased sensitivity for detection of CAD in a group of 53 female patients when analyzing diastolic images only and using subjective visual analysis. The authors indicated, however, that the specificity of their method could be compromised due to low counts in the ED images (3/16 frames). This may be also indicated by the lower diagnostic performance of quantification with fewer time intervals as shown in our study (Table 3). The MF approach addresses this concern by “motion-correcting” the frames rather than eliminating them.
It has been suggested that spurious perfusion defects, not visible on gated images, could occur on ungated images due to abnormal contraction (28) or wall thickening. Therefore, the use of diastolic imaging was proposed for patients with left bundle branch block to reduce the false-positive rate (29–31). Our MF quantification technique, which avoids pitfalls of ED image interpretation only (low counts, artifacts) and accounts for cardiac motion, could potentially be used to eliminate false-positive defects due to abnormal count shifts. However, it may not be effective if perfusion defects are caused by reduction in wall thickening and consequent decrease of dynamic count range (29). Application of our technique to the population with left bundle branch block may warrant a further study.
All tested datasets have been divided into 16 phases of the cardiac cycle. Similarly, the normal file was also created with the data acquired using the 16-frame protocol. A potential complication would be the need to analyze the 8-frame data using the 16-frame normal database. To be able to analyze the 8-frame data, the number of frames in the database could perhaps be increased to 16 by interpolation in the time domain.
In clinical settings, many laboratories perform gating of stress images only. Therefore, the most practical use of the MF technique might be for the evaluation of stress images. Although it is a potential limitation, in a recent study, we have found that the assessment of differences between stress and rest images can be performed by a direct comparison of the 2 scans without normal databases (18). A combination of such direct ischemia estimation from stress–rest differences with the MF stress quantification would have an advantage of using a stress-only database.
The main limitation of the proposed technique is that it depends on the correct contour definition. Errors in the contour definition will produce incorrect quantification results and incorrect MF display. If systolic image resolution is lost due to the small size of the heart and partial-volume effects, our technique will not help. The MF technique requires the correct definition of ES contours and subsequently adjusts the images based on that contour information. It will not compensate for the loss of resolution on the ES frames. Therefore, in very small hearts the technique may not be as effective as could be intuitively expected due to the limited resolution of SPECT. Perhaps with future improvements in SPECT resolution, the relative importance of MF correction may increase.
CONCLUSION
We have developed a practical and fully automatic algorithm for quantification and display of gated MPS corrected for cardiac motion. We eliminated the image blurring caused by cardiac motion without sacrificing the count density. Initial results show an improvement in image quality and good diagnostic performance by quantitative analysis. This processing technique can be implemented retrospectively and is applicable to most current clinical protocols, since gated acquisition of stress perfusion images is routinely performed for the assessment of cardiac function. Initial results warrant further evaluation.
Acknowledgments
We thank Jim Gerlach for his assistance in image data analysis.
Footnotes
Received Sep. 23, 2003; revision accepted Apr. 12, 2003.
For correspondence or reprints contact: Piotr J. Slomka, PhD, Department of Imaging, Cedars-Sinai Medical Center, #A047 8700 Beverly Blvd., Los Angeles, CA 90048.
E-mail: Piotr.Slomka{at}cshs.org
REFERENCES
In this issue


Jump to section
Related Articles
Cited By...
- Motion Correction of 18F-NaF PET for Imaging Coronary Atherosclerotic Plaques
- Dual-Gated Motion-Frozen Cardiac PET with Flurpiridaz F 18
- Evaluating the Role of Routine Prone Acquisition on Visual Evaluation of SPECT Images
- Achieving Very-Low-Dose Radiation Exposure in Cardiac Computed Tomography, Single-Photon Emission Computed Tomography, and Positron Emission Tomography
- Quantitative Analysis of Myocardial Perfusion SPECT Anatomically Guided by Coregistered 64-Slice Coronary CT Angiography
- Automated Quality Control for Segmentation of Myocardial Perfusion SPECT
- Motion-Frozen Myocardial Perfusion SPECT Improves Detection of Coronary Artery Disease in Obese Patients
- High-Speed Myocardial Perfusion Imaging: Initial Clinical Comparison With Conventional Dual Detector Anger Camera Imaging
- Non-rigid image registration: theory and practice