


Abstract
The aim of this study was to compare PET with 18F-FDG PET, in-line PET/CT, and software fusion of independently acquired CT and PET scans for staging of recurrent colorectal cancer (CRC). Methods: Fifty-one patients with suspected recurrent CRC were studied with in-line PET/CT. Thirty-four of these patients underwent an additional CT scan of the chest or abdomen within 4 wk of PET/CT. Software fusion of PET and CT was performed using a fully automated, intensity-based algorithm. The accuracy of the coregistration of PET and CT scans was evaluated by measuring the distance between landmarks visible in the PET and CT images. Histologic evaluation and follow-up for 6 mo served as the gold standard for the presence or absence of recurrent CRC. Results: On a patient basis, the accuracy of staging was significantly higher for in-line PET/CT than for PET (88% vs. 71%, P = 0.01). Software fusion of the independently acquired PET and CT images was unsuccessful in 8 patients (24%). In the remaining patients, the mean distance between 62 landmarks visible in PET and CT was 12.9 ± 7.9 mm, whereas it was only 7.7 ± 4.7 mm for in-line PET/CT (P < 0.001). Conclusion: In patients with suspected recurrent CRC, in-line PET/CT significantly improves staging compared with PET alone. Due to its high failure rate, software fusion of independently acquired PET and CT studies cannot be considered to represent an alternative to in-line PET/CT.
In recent years PET with 18F-FDG has become an established test for detection and staging of recurrent colorectal cancer (CRC). Numerous studies have shown that 18F-FDG PET provides a significantly higher accuracy than morphologic imaging techniques for differentiation of scar tissue and recurrent disease as well as for detection of liver and extrahepatic metastases (1–8).
Nevertheless, the lack of detailed anatomic information represents a significant limitation for imaging recurrent CRC by 18F-FDG PET. Surgical resection is the treatment of choice for local recurrence and metastatic disease if the whole tumor mass can be completely removed (9). For surgical planning, the exact anatomic location of the tumor and its relationship to normal organs is required. Because this information cannot be obtained from PET images, 18F-FDG PET generally has to be used in combination with CT or MRI if surgical treatment of recurrent CRC is considered. In patients with suspected unresectable recurrence, histologic confirmation is frequently required before initiation of chemotherapy or radiotherapy. Since scar tissue and tumor recurrence frequently coexist, the exact anatomic localization of abnormalities in 18F-FDG PET is again required to maximize the diagnostic yield of biopsies.
For these reasons the use of in-line PET/CT (10) appears to be particularly attractive for detection and staging of recurrent CRC. In addition to facilitating the clinical work-up of patients, in-line PET/CT may also show improved diagnostic accuracy compared with PET. For example, the morphologic information obtained from CT may help to avoid false-positive findings caused by unspecific intestinal tracer uptake or inflammatory pulmonary infiltrates. In non–small cell lung cancer, lymphoma, and head and neck cancer, in-line PET/CT has already been shown to increase the diagnostic accuracy for tumor staging compared with PET alone or separately acquired PET and CT studies (11–13).
Another approach to integrate functional and morphologic imaging data is the use of software algorithms to coregister separately acquired PET and CT datasets (“software image fusion”) (14). This approach has been extensively used for brain imaging (15). However, in other anatomic regions, coregistration is considerably more complex. Due to respiratory motion and different filling of hollow organs, the location and shape of thoracic and abdominal structures may vary considerably in PET and CT datasets. Nevertheless, software fusion algorithms that include nonrigid transformations of the PET dataset to account for these differences have greatly improved in computational speed and can now routinely be applied to clinical PET and CT studies (14). However, there are only very limited data on the accuracy of software fusion of PET and CT outside the area of the brain. Furthermore, no systematic comparison of the diagnostic accuracy of PET, in-line PET/CT, and software fusion for staging recurrent CRC has been published so far. Thus, the aim of the present study was to compare 18F-FDG PET, in-line PET/CT, and software fusion of PET and CT for restaging of CRC and to compare the accuracy of coregistration of PET and CT achieved by in-line PET/CT and software fusion.
MATERIALS AND METHODS
Patients
This is a retrospective analysis of patients with suspected or biopsy-proven recurrent CRC imaged at our institution with in-line PET/CT between July 2002 and October 2003. Inclusion criteria were biopsy-proven recurrent CRC or suspected disease recurrence on the basis of other imaging tests, tumor markers, or clinical symptoms. Patients were excluded when they had received chemotherapy or radiotherapy within 4 wk before the PET/CT scan. Patients with <6-mo follow-up after the PET/CT scan were also excluded. Using these criteria, 51 of the total 135 patients with suspected or biopsy-proven recurrent CRC were included in the study. In 34 of these patients, the image data of CT scans of the abdomen or chest acquired within 4 wk of the PET/CT study were available. The PET and CT images of these patients were coregistered using a fully automated algorithm as described below and then analyzed independently from the in-line PET/CT studies. Twelve patients underwent PET/CT to stage an already known recurrence and 39 patients were evaluated for detection of recurrent CRC. Patient characteristics are summarized in Table 1.
Patient Characteristics
In-Line PET/CT Image Acquisition and Reconstruction
Dual-modality PET/CT was performed using a Reveal RT (CPS Innovations, CTI). This system consists of an ECAT ACCEL PET system (CPS Innovations, CTI), using the lutetium silica oxide technology and 3-dimensional imaging acquisition protocols without septa and transmission sources, and a Somatom Emotion duo CT system (Siemens Medical Systems). After determining the imaging field with an initial scout CT scan, an 80- to 110-s whole-body CT acquisition was performed using the following parameters: 130 kVp, 120 mA, 1-s tube rotation, 4-mm collimation, and a bed speed of 10 mm/s (pitch = 1.25). Nine-hundred milliliters of 2.1% barium sulfate were administered as an oral contrast agent; no intravenous contrast agents were used.
The PET component of the imaging system has an axial field of view of 15.5 cm with an in-plane spatial resolution (full width at half maximum [FWHM]) of 4.6 mm at the center of the field of view. PET images were acquired 60 min after intravenous injection of 7.77 MBq/kg (0.21 mCi/kg) of 18F-FDG covering the same field of view as the CT. Six to 8 bed positions were imaged per patient, resulting in whole-body PET emission scan durations ranging from 18 to 34 min. The acquisition time of PET (1–4 min per bed position) was adapted according to the patient’s weight (16). Patients were instructed to use shallow breathing during the PET and CT part of the study since this has been shown to minimize misregistrations and attenuation artifacts between PET and CT images.
The CT images were used for attenuation correction by applying an algorithm developed at the University of Pittsburgh (17). In this approach, the Hounsfield units in the CT images are scaled to attenuation coefficients at 511 keV. PET images were scatter corrected and reconstructed using an iterative algorithm (ordered-subset maximization expectation: 2 iterations, 8 subsets) with a final image resolution of 8.8 mm at FWHM. The mechanical registration between the PET and CT gantry was performed according to the manufacturer’s recommendation. The calibration involves a PET/CT scan of two 68Ge line sources that are oriented at different angles relative the axis of the 2 gantries. To check the alignment, a phantom with spheres filled with a mixture of 18F and iodine contrast is scanned. The centers of spheres are determined from the PET and CT images by calculating the center of mass for each sphere. According to this method, the alignment between the 2 gantries is within 1.5 mm.
Software Image Fusion of PET and CT
The CT scans used for the software fusion of PET and CT were acquired with a General Electric Lightspeed spiral CT scanner using routine clinical parameters after administration of intravenous contrast agents. For CT scans of the abdomen/pelvis, oral contrast was additionally used. Slice thickness of the reconstructed images was 5–7 mm. The chest CT scans usually covered the area from the base of the neck to the upper abdomen. The CT scans of the abdomen/pelvis included the area from the dome of the liver to the pelvic floor. Software image fusion was performed using the Mirada workstation (Mirada Solutions). This software is based on the mutual information algorithm (18). The estimation of the parameters of transformation is performed through a multidimensional optimization process as described by Rueckert et al. (19). This approach does not use geometric landmarks but searches for intensity similarities of voxels instead. After loading the PET and CT datasets, a rigid translation and rotation was applied to the PET data using this algorithm. Thereafter, a nonrigid transformation of the PET data (“warping”) was applied. The whole fusion procedure was performed automatically without any manual adjustments. The time required for fusion of a PET and CT dataset was 2–3 min. The software fusion was applied to the PET images and the independently acquired dedicated CT studies in 34 patients. This included 25 CT scans of the abdomen and 30 CT scans of the chest.
Image Interpretation
All studies were interpreted independently by 3 experienced nuclear medicine physicians. All observers were unaware of all clinical data except the fact that the patient underwent the PET/CT study for detection or staging of recurrent CRC. To eliminate a potential “recall bias” each observer evaluated every patient only once (either PET alone, in-line PET/CT, or software fusion of PET and CT). To minimize the influence of interobserver variability on the interpretation of the studies, each of the 3 observers interpreted approximately one third of the PET, one third of the in-line PET/CT, and one third of the software fusion images. Each observer recorded the location of all abnormalities noted in a study on a standardized report form. The report form included drawings of the lung and liver segments, the major abdominal vessels, and the skeleton. The certainty of lesion location was scored on a 3-point scale (1 = uncertain localization, 2 = probable localization, 3 = definite localization). Each lesion identified was then characterized using a 5-point scale: 1 = definitely benign, 2 = probably benign, 3 = equivocal, 4 = probably malignant, 5 = definitely malignant (20). Abnormalities in CT without correspondingly increased 18F-FDG uptake were generally considered as benign. However, multiple pulmonary nodules in CT with a diameter of <1 cm were considered as malignant even in the absence of increased 18F-FDG uptake. Furthermore, all sclerotic bone lesions, which did not demonstrate typical features of degenerative changes in CT, were also considered as malignant. These criteria were used to account for the low sensitivity of 18F-FDG PET for detection of small pulmonary and sclerotic bone metastases (21,22).
To compare the accuracy of coregistration between PET and CT for in-line PET/CT and software fusion, landmarks were identified in the PET and CT images of each patient by one observer. The landmarks included the following normal anatomic structures: the lower pole of the left and right kidneys and the lower pole of the spleen. If corresponding lesions were clearly identified in PET and CT (e.g., lung metastases, thoracic, abdominal, or pelvic lymph node metastases), up to 2 of these lesions per patient were additionally analyzed. The distance between the landmarks in PET and CT was measured in the x- (left–right), y- (ventral–dorsal), and z- (cranio–caudal) direction, and the overall distance between the landmarks (D) was calculated using the formula:
 where Δx, Δy, and Δz are the distances between the corresponding landmarks in the x-, y-, and z-direction. Software fusion of PET and CT was considered as unsuccessful when D was >2 cm for any of the landmarks. This threshold value of 2 cm was chosen because it indicates a misregistration of >2 times the resolution of the PET images. Software fusion was also classified as unsuccessful when PET images were distorted so much by software fusion that the anatomic landmarks could not longer be reliably identified.
Standard of Reference
Both histology and clinical–radiologic follow-up served as the standard of reference. Absence of recurrence was considered to be proven if no evidence of disease progression was present for at least 6 mo after the in-line PET/CT study. The follow-up examination was comprised of all clinical information available after the PET/CT study, including clinical examinations, laboratory tests, and radiographic follow-up examinations (PET/CT, CT, MRI). Disease recurrence was either proven histologically or by growth of a lesion over a 6-mo period. The data of the reference standard were collected by a physician who was unaware of the interpretation of the PET or CT scans in this study.
Data Analysis
A true-positive result was defined by the correct diagnosis and localization of disease recurrence. A true-negative result was defined by a negative scan interpretation, which was confirmed by follow-up imaging. For this purpose, disease location was classified as intrahepatic, intraabdominal extrahepatic, and extraabdominal as previously described (4,20). Understaging and overstaging according to these anatomic regions were considered as false-negative and false-positive, respectively. The diagnostic accuracy of PET and in-line PET/CT to detect disease recurrence on a region basis was evaluated by receiver-operating-characteristic (ROC) analysis (23). Differences in the diagnostic accuracy of the imaging procedures were statistically tested by comparing the areas under the ROC curves (Rockit 0.9.1; Charles E. Metz, University of Chicago). In addition, sensitivity, specificity, and accuracy were calculated at the optimum threshold value for diagnosis of disease recurrence. This threshold was defined as the point of the ROC curve with the minimum distance from the 0% false-positive and the 100% true-positive rate. The 95% confidence intervals of sensitivity, specificity, and accuracy were calculated by using standard formulas and differences between these parameters were tested with the McNemar test. A P value < 0.05 was considered significant. The intraobserver variability for the definition of landmarks in PET and CT was evaluated by the intraclass correlation coefficient.
RESULTS
Standard of Reference
Recurrent CRC was confirmed by histopathology or follow-up examinations in 24 of the 51 patients (47%). On a regional basis, the liver was the site of recurrence in 15 patients, the abdomen in 11 patients, and other sites in 9 patients (3 bone and 6 lung metastases). Seven patients were diagnosed with metastases in >1 region. No standard of reference could be established for 10 regions (7%) in 6 patients (3 liver, 2 abdominal, and 5 other regions). In these 6 patients, a histologic diagnosis of metastases was made by biopsy or surgery. Because of the lack of therapeutic consequences, no further systematic follow-up imaging was performed and metastases in other regions of the body could neither be confirmed nor excluded. Thus, there were a total of 143 evaluable regions, of which 108 were negative and 35 were positive for tumor tissue. Histologic evaluation was evaluable for 33 regions.
Diagnostic Accuracy of PET and In-Line PET/CT
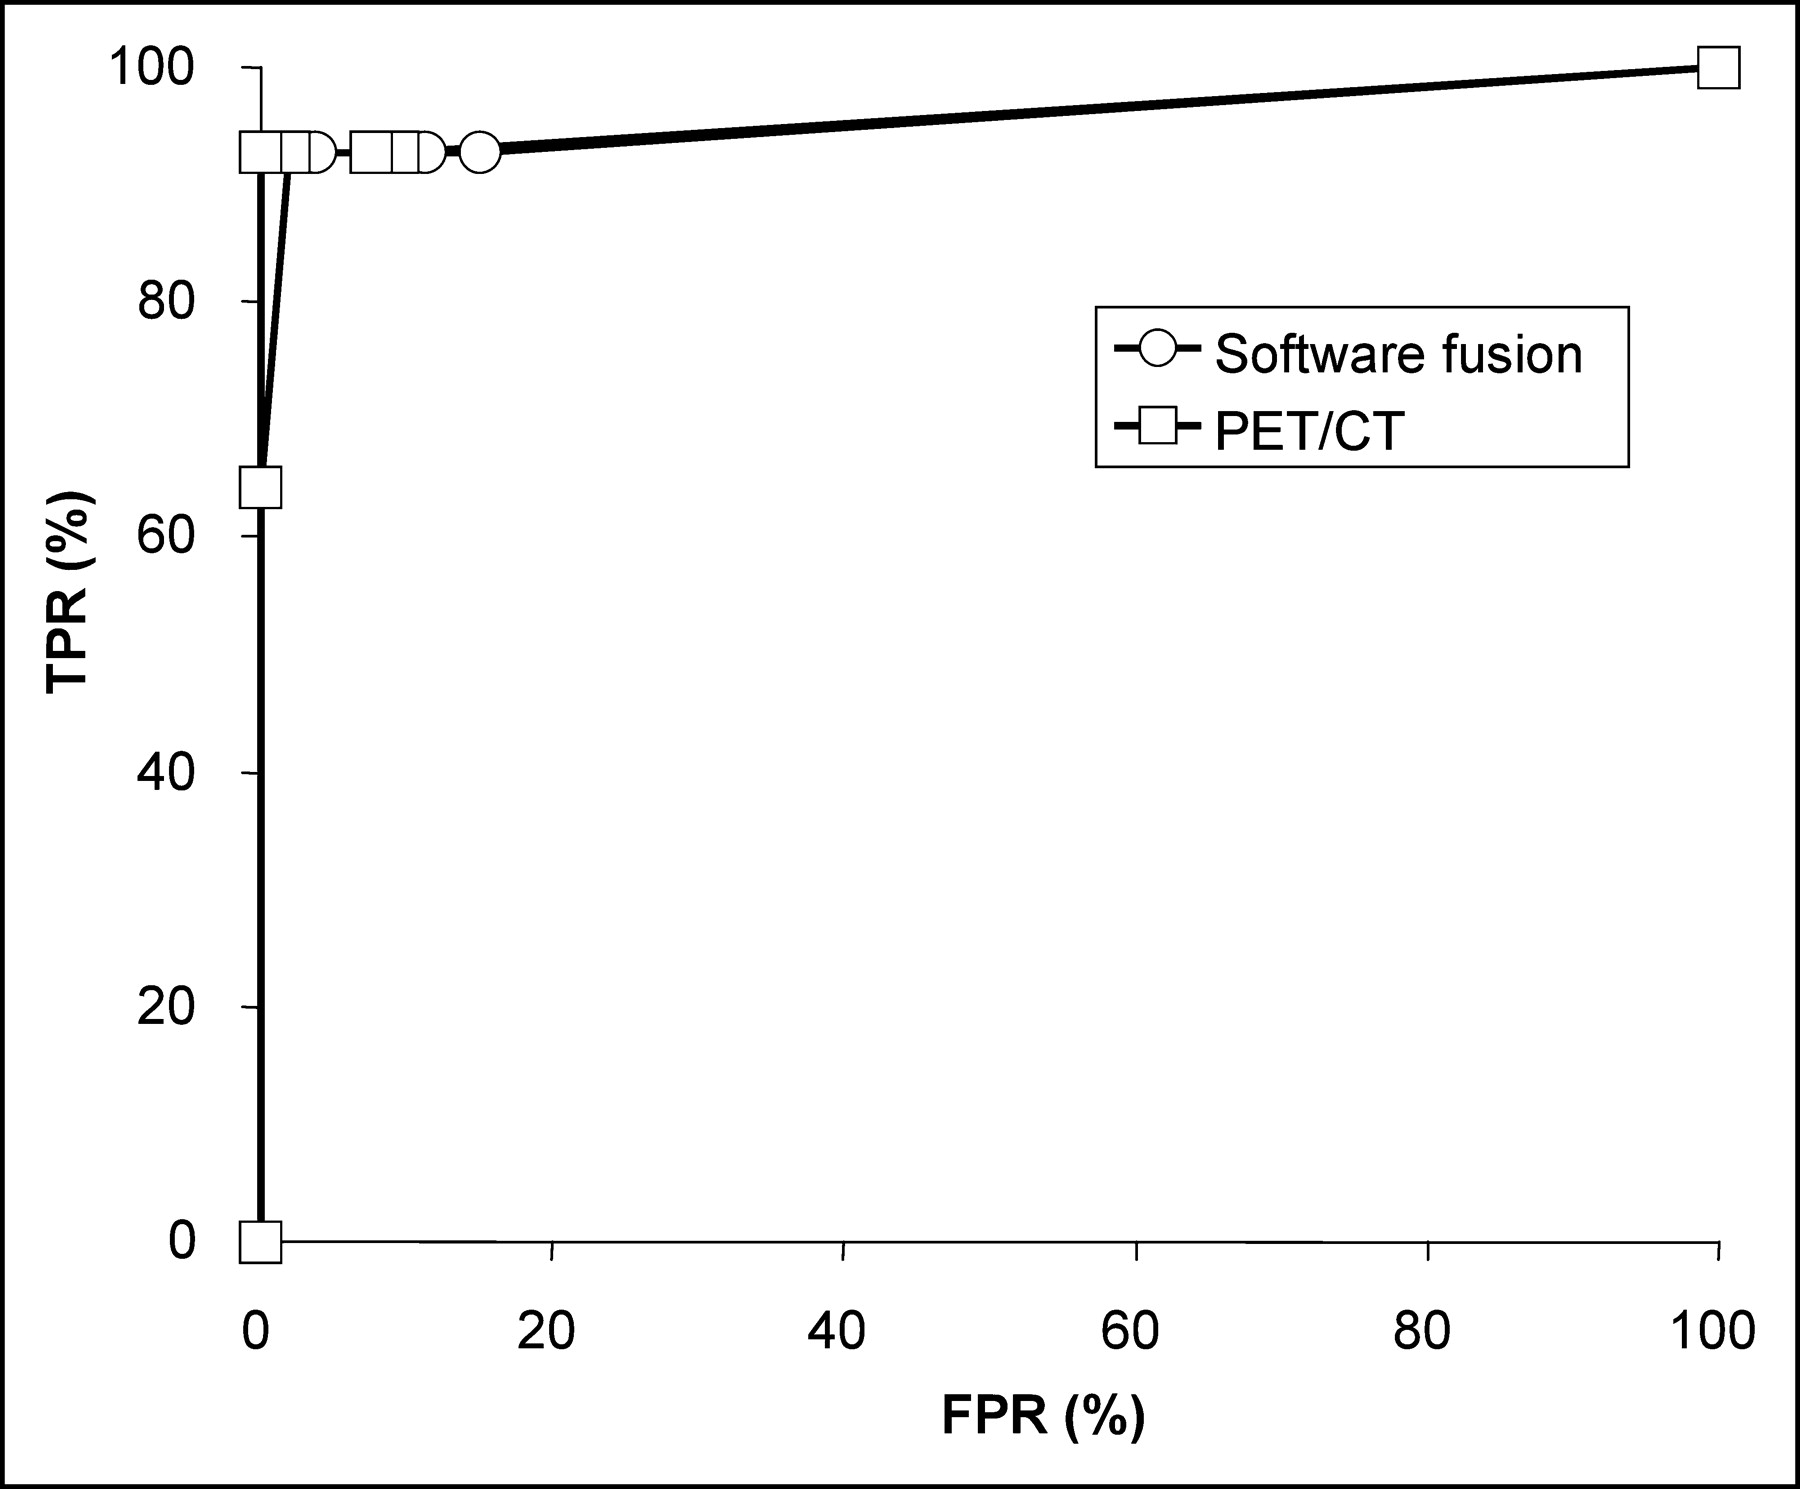
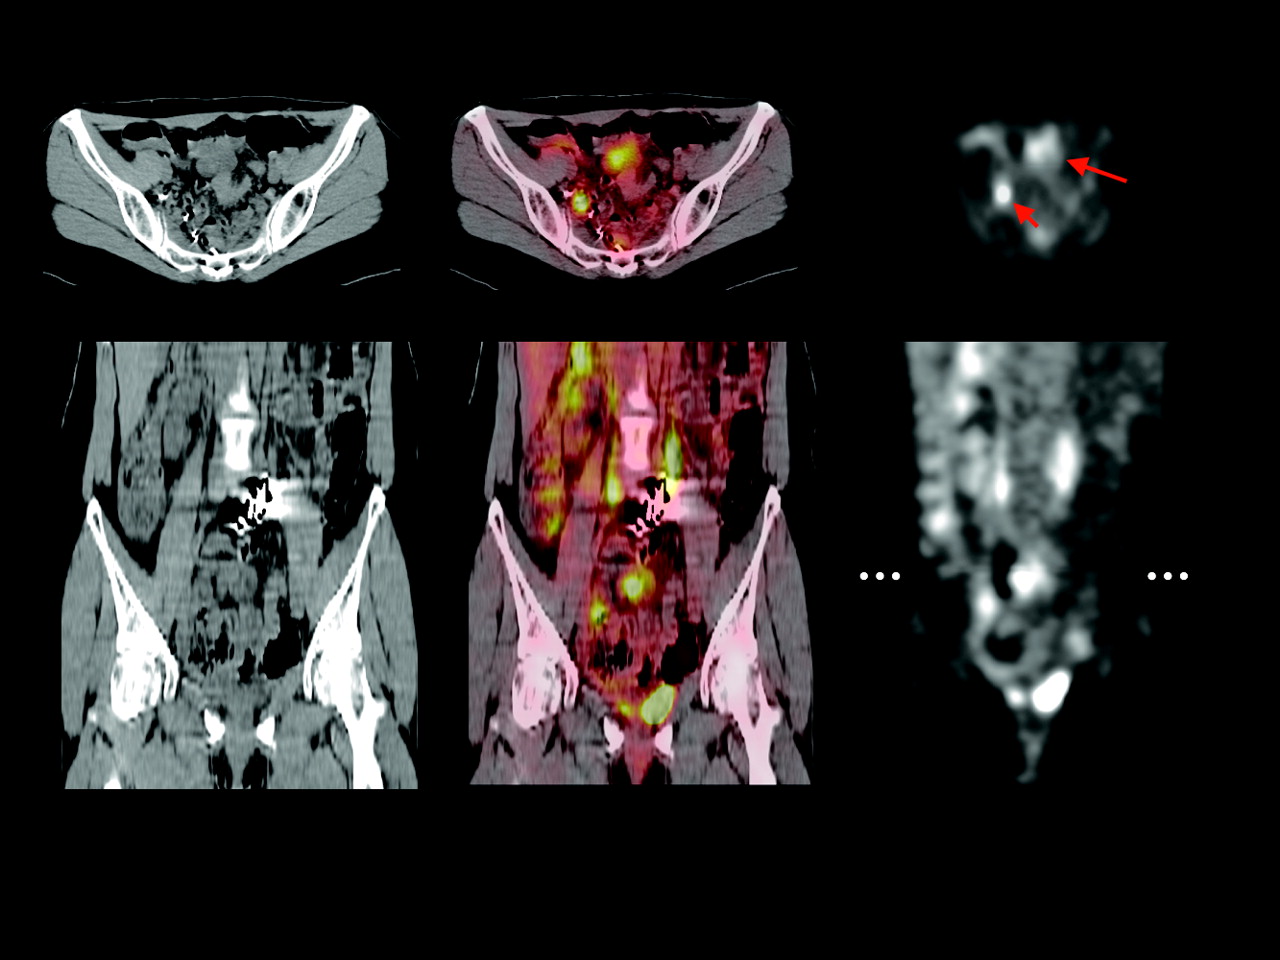
Figure 1 shows the ROC curves for detection of recurrent CRC on a region basis for PET and in-line PET/CT. The area under the ROC curve was 0.82 for PET and 0.95 for PET/CT (P = 0.01). Applying a score of 3 or more as a criterion for the presence of tumor tissue resulted in the best accuracy for detection of disease recurrence for all 3 imaging modalities. At this threshold value, the accuracy of PET and in-line PET/CT was 88% and 96%, respectively (P = 0.01). This increase in diagnostic accuracy was due to the additional identification of metastases in 5 regions and the correct exclusion of metastases in 7 regions (Table 2). Metastases detected with PET/CT only included peritoneal lesions, which were considered to represent unspecific bowel uptake in PET (Fig. 2; Table 2, patient 5), small pulmonary metastases (Fig. 3; Table 2, patient 16), and a sclerotic bone metastasis (Table 2, patient 17). False-positive findings were mainly avoided by better anatomic localization of increased 18F-FDG uptake (e.g., 18F-FDG uptake by normal bowel or thyroid).
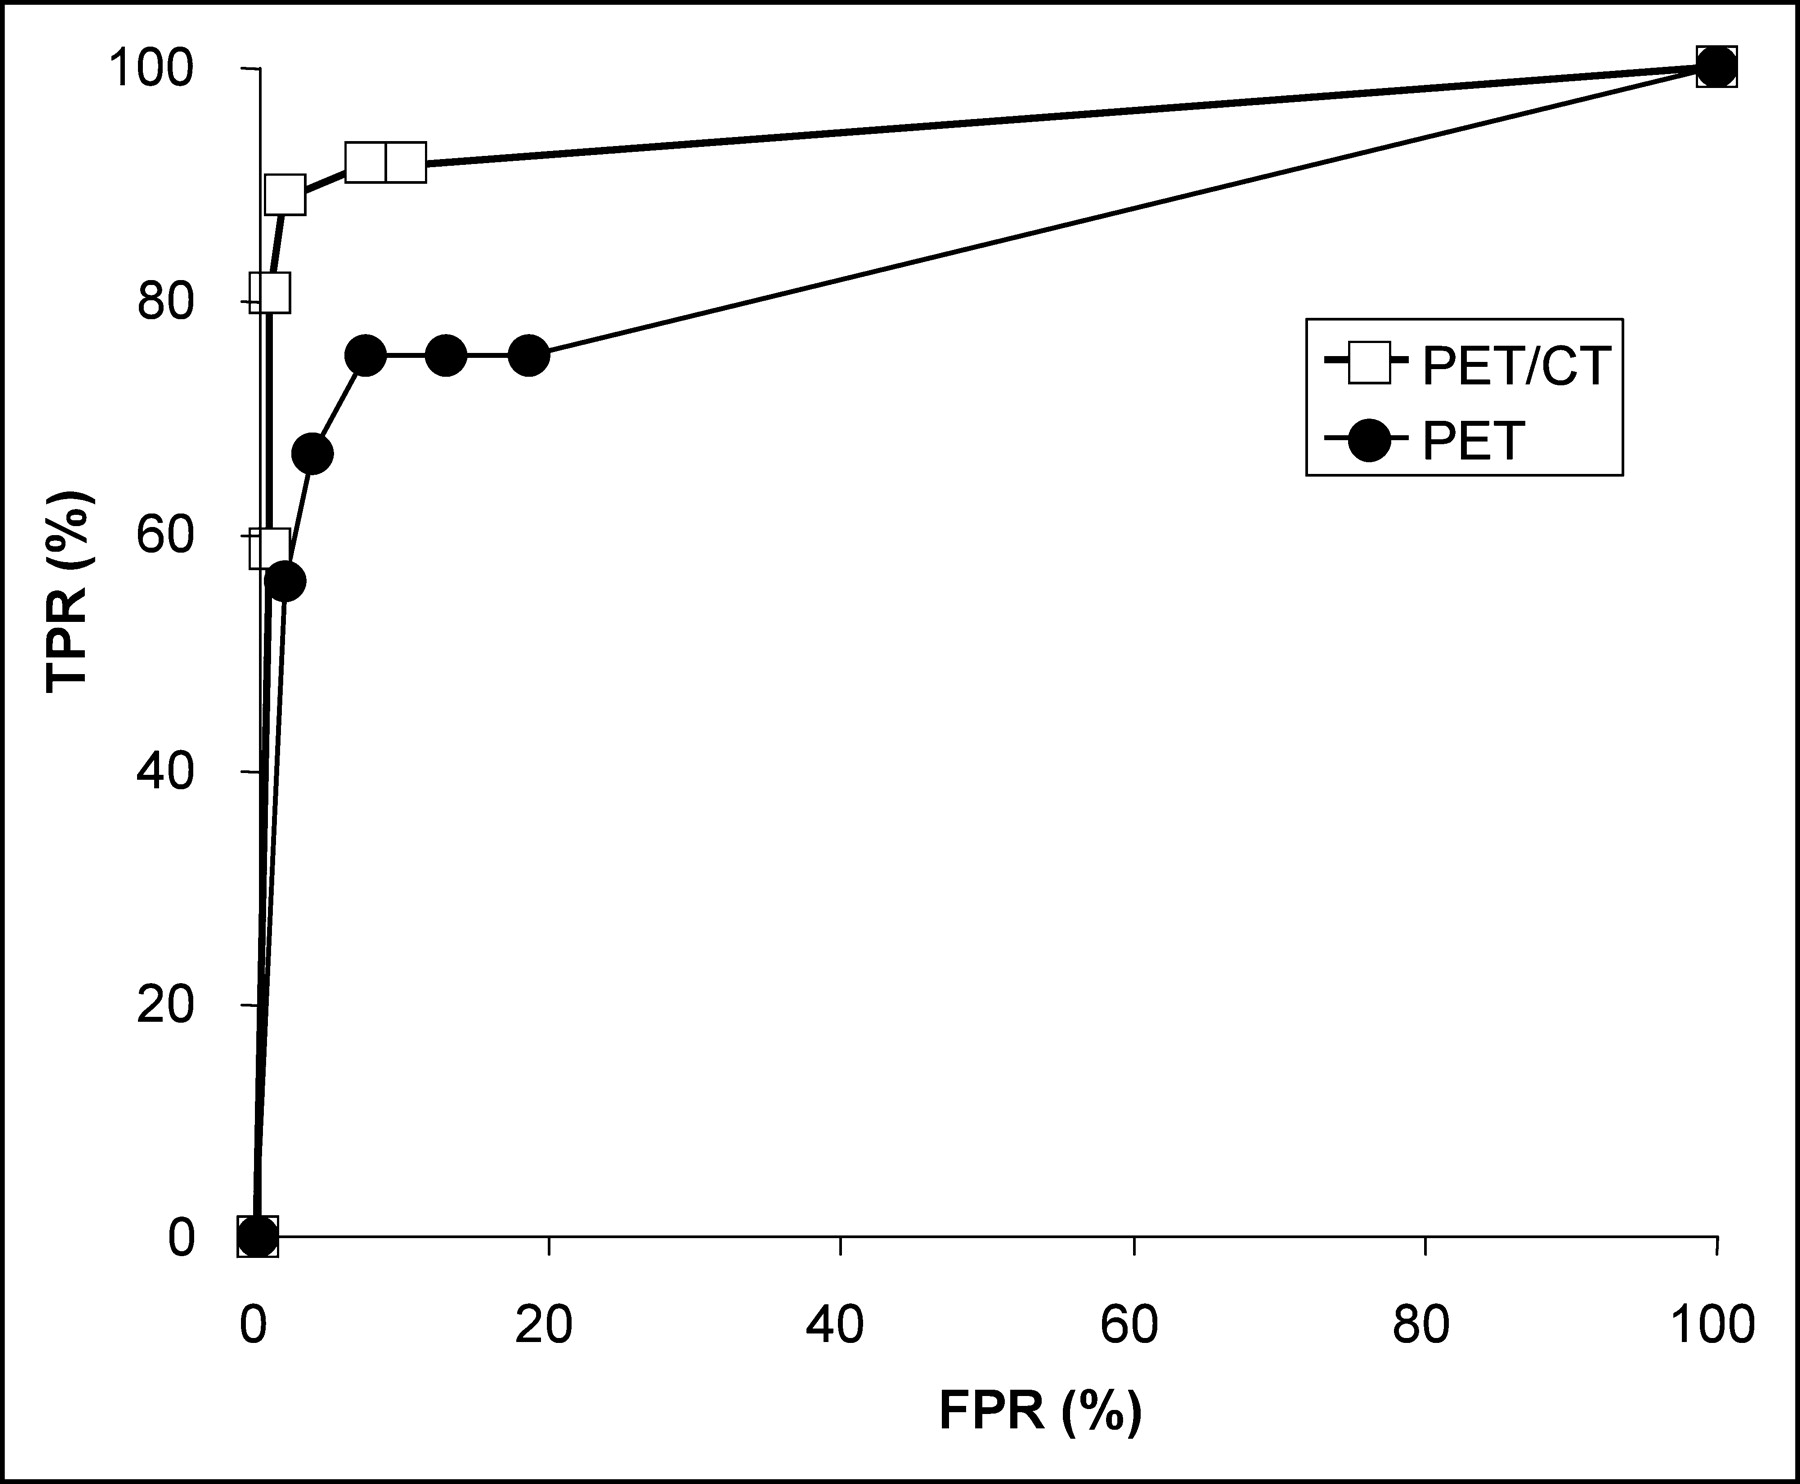
ROC curves for detection of recurrent CRC by PET, in-line PET/CT, and software fusion of PET and CT in region-based analysis. Analysis was based on 143 evaluable regions in a total study population of 51 patients. According to the reference standard, 35 regions were positive and 108 regions were negative for tumor tissue. Area under the curve is 0.82 for PET and 0.95 for in-line PET/CT (P = 0.01). TPR = true-positive rate; FPR = false-positive rate.

PET/CT scan of patient with peritoneal carcinomatosis. Transaxial (top) and coronal (bottom) images show biopsy-proven tumor deposit in lower abdomen (large arrow). This lesion demonstrated increased 18F-FDG uptake but was read as unspecific bowel uptake when PET scans were evaluated independently from CT scans. Small arrow marks right ureter and dotted line in coronal image indicates position of transaxial section.
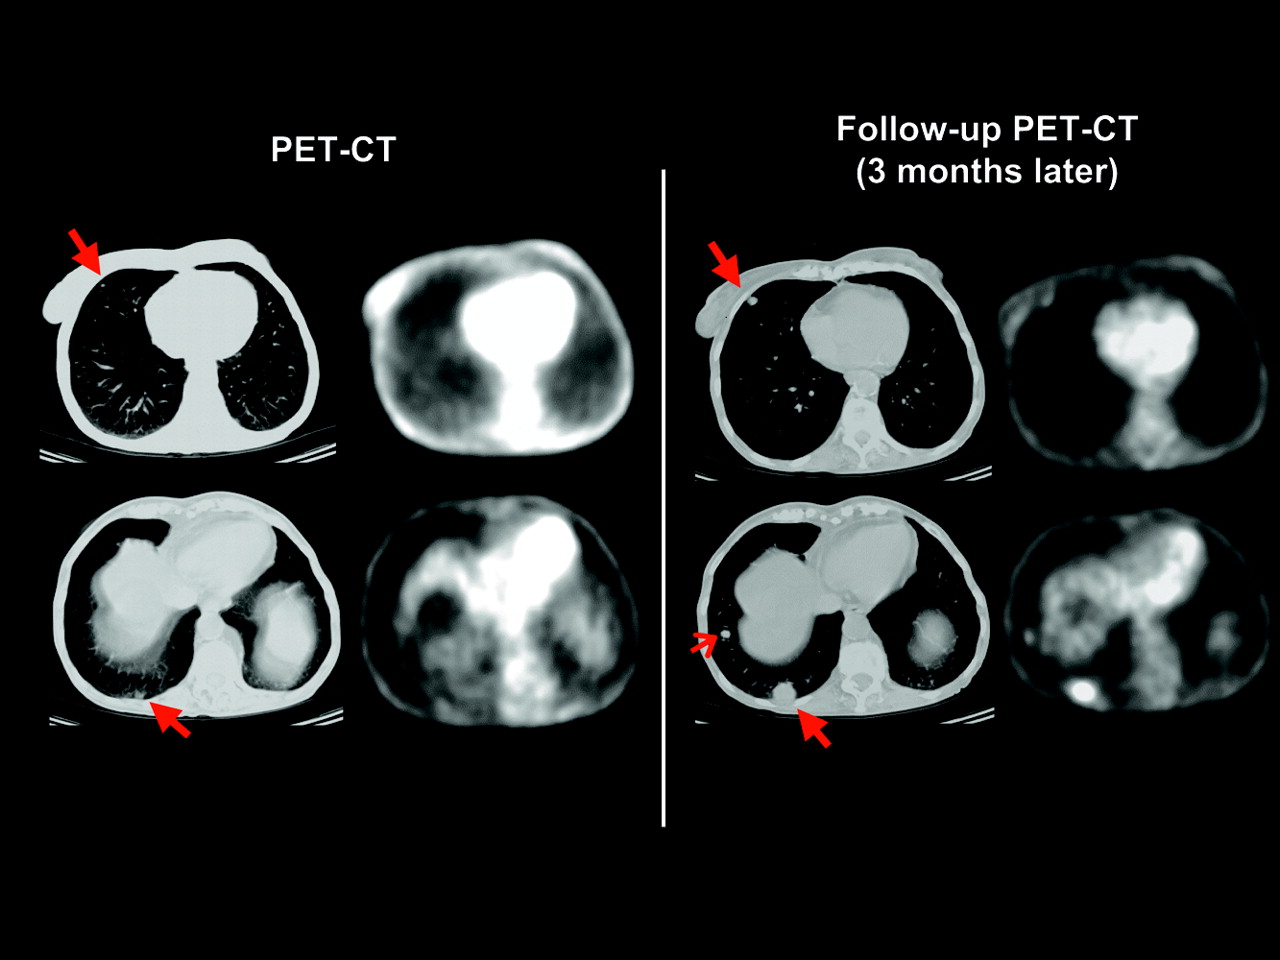
PET/CT scan of patient with pulmonary metastases of rectal cancer. Top row shows images evaluated as part of this study. At this time, CT scan demonstrated 5 small pulmonary nodules in both lungs, which were considered as suspicious for metastatic disease. CT images of 2 representative nodules are shown on left image (long arrows). All nodules were not visible in corresponding PET images. A follow-up study performed 3 mo later showed marked increase in size of nodules (long arrows) as well as a new nodule (short arrow) and confirmed presence of metastatic disease.
Incorrect Findings in PET, In-Line PET/CT, and Software Fusion
There was only one lesion that was false-positive in in-line PET/CT but was true-negative in PET. This patient had received preoperative radiotherapy for locally advanced distal rectal cancer (Table 2, patient 11). Three months after surgical resection and radiotherapy, CT demonstrated diffuse thickening of the sigmoid colon, adjacent to the anastomosis. In the PET scan this area demonstrated moderately increased 18F-FDG uptake. This finding was interpreted as unspecific bowel uptake in the PET studies but was read as suspicious for recurrence in the PET/CT study. In follow-up studies, these changes resolved without specific therapy, suggesting the diagnosis of postradiation inflammation. Table 2 summarizes the findings in PET and in-line PET/CT for the discrepantly evaluated regions.
Both PET and PET/CT were false-negative for liver metastases in 2 patients. These metastases were confirmed by biopsy and follow-up imaging, respectively. In addition, both PET and PET/CT were false-negative in 2 patients with retroperitoneal lymph node metastases (detected by CT 3 mo later) and peritoneal carcinomatosis (biopsy proven). PET and PET/CT were both false-positive in a patient with postoperative changes after resection of a lung metastasis (normal follow-up CT 6 mo later). The sensitivity, specificity, accuracy, positive predictive value, and negative predictive value of PET and in-line PET/CT are shown in Table 3.
Diagnostic Performance for Detection of Recurrent CRC (143 Regions in 51 Patients)
Staging Accuracy of PET and In-Line PET/CT on a Patient Basis
On a patient basis, in-line PET/CT provided a significantly higher staging accuracy than PET alone (88% vs. 71%, P = 0.01; Table 4). This was due to a reduction in overstaging as well as understaging (Table 4). No patient-based analysis was performed for software fusion of PET and CT because the available CT scans were generally not whole-body studies. Therefore, a complete staging of the patient was not possible by using the software fusion of PET and CT. The ROC curves for PET and PET/CT for detection of recurrent CRC on a patient basis are shown in Figure 4. In this analysis, already known sites of disease recurrence are excluded for the 12 patients who underwent PET/CT for staging of previously diagnosed recurrent CRC.
ROC curves for detection of recurrent CRC on a patient basis. Analysis was based on total study population of 51 patients. According to the reference standard, recurrent CRC (in addition to already known sites in patients referred for tumor staging) was present in 16 patients. Area under the curve is 0.82 for PET and 0.90 for in-line PET/CT (P = 0.09). TPR = true-positive rate; FPR = false-positive rate.
Staging Accuracy on Patient Basis (n = 51)
Software Fusion of Independently Acquired PET and CT Scans
Software fusion of independently acquired PET and CT scans failed in 8 patients (24%). This included 3 (12%) of the abdominal and 8 (27%) of the thoracic CT scans. In all cases, the misregistration of PET and CT was obvious and was considerably larger than 2 cm (Fig. 5). In the remaining 26 patients, the mean distance between the landmarks defined in the PET and CT images was 12.9 ± 7.9 mm, thus being significantly larger than for in-line PET/CT (7.7 ± 4.7 mm, P = 0.0001). The misregistration between PET and CT was largest in the z-direction (Table 5).
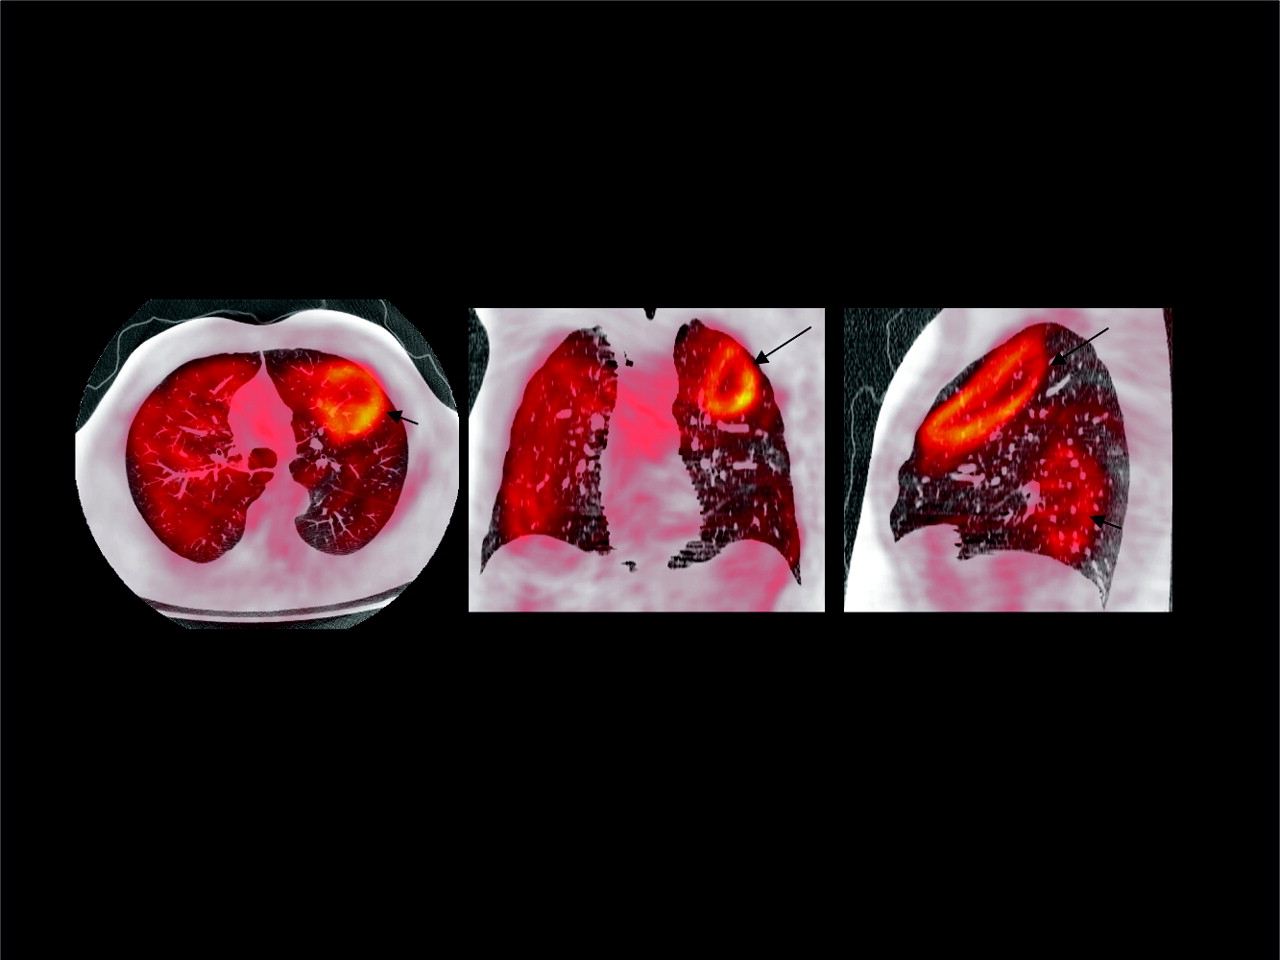
Example of a failure of software fusion of independently acquired PET and CT scans (transaxial, coronal, and axial slices). Heart (large arrow) and kidney (small arrow) of PET study are deformed and completely misregistered.
Distances (mm) Between Landmarks in PET and CT Images for In-Line PET/CT and Software Fusion of PET and CT
The distance measurements did not show a systematic bias since the mean differences between the x-, y-, and z-coordinates of the landmarks in PET and CT were not significantly different from zero for in-line PET/CT or software fusion of PET and CT (P > 0.3 in 1-sample t tests). The intraobserver variability of the distance measurements was evaluated for 30 randomly selected landmarks. The intraclass correlation coefficient for these 2 measurements was 0.88 and the mean difference between the 2 measurements was 0.3 ± 1.6 mm. The scores for certainty of lesion localization also reflected the lower accuracy of coregistration of the software fusion of PET and CT. The mean score was 2.1 ± 1.4 for in-line PET/CT but was only 1.6 ± 1.3 for software fusion of PET and CT (P < 0.001).
In the 26 patients with successful software fusion, the diagnostic accuracy of in-line PET/CT and software fusion of PET and CT was compared for 67 regions. According to the reference standard, 14 of these regions were positive for tumor tissue and 53 regions were negative. The overall accuracy of software fusion was 95% at a sensitivity of 93% and a specificity of 96% (Table 6). Thus, the diagnostic accuracy was comparable to in-line PET/CT (Table 6; Fig. 6). However, when all patients with software fusion were analyzed in an “intention-to-diagnose” analysis, the overall accuracy of software fusion decreased to 45%.
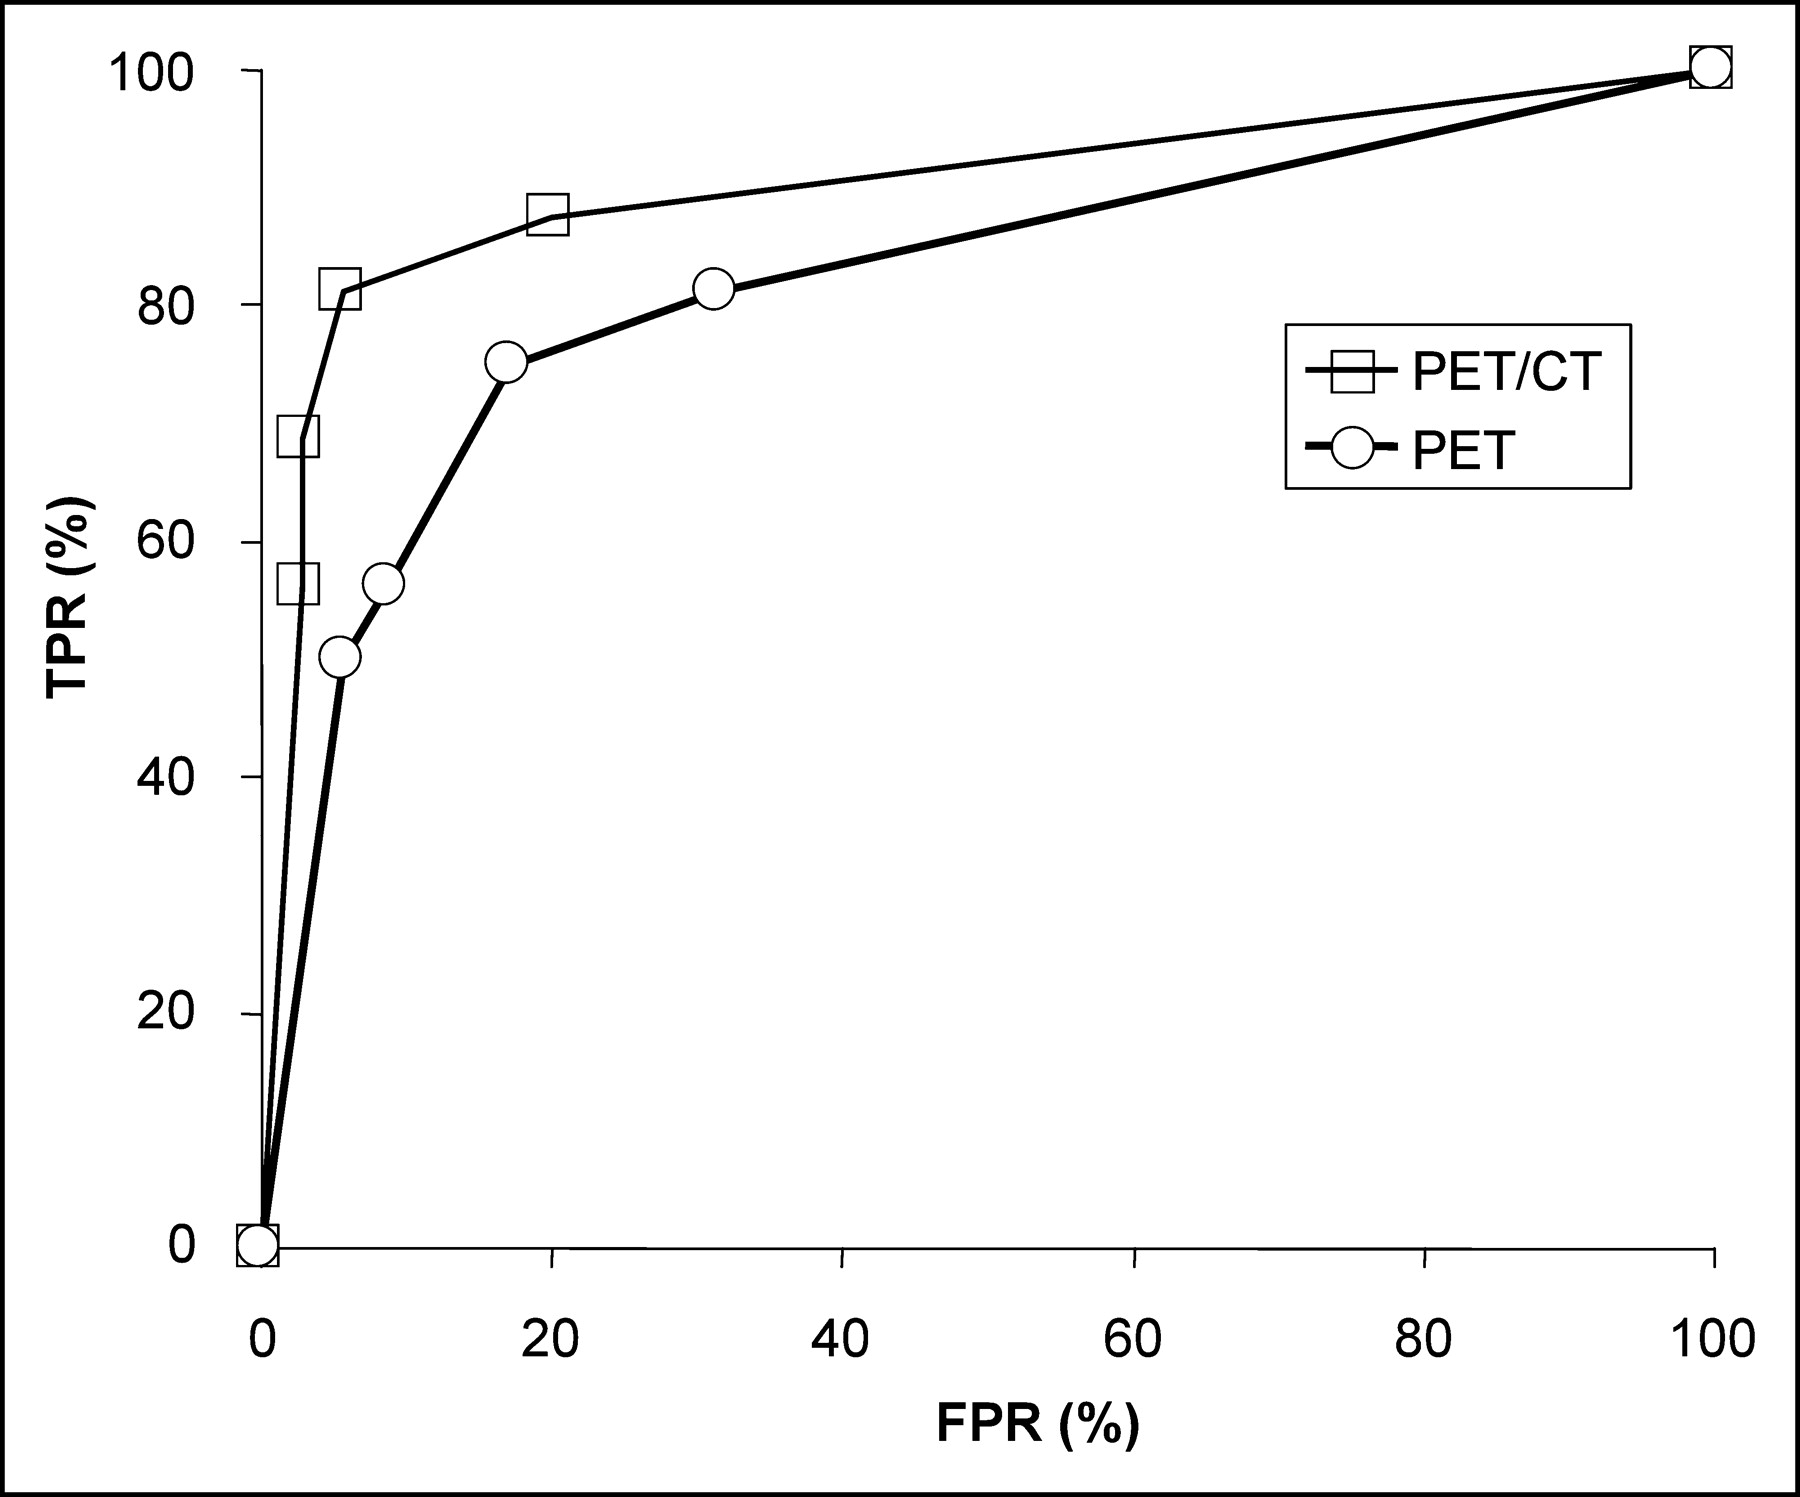
ROC curves for detection of recurrent CRC on a region basis for in-line PET/CT and software fusion of PET and CT. Analysis included 67 regions in the subgroup of 26 patients with successful fusion of PET and CT. According to the reference standard, recurrent CRC was present in 14 regions. Area under the curve is 0.96 for both in-line PET/CT and software fusion of PET and CT. TPR = true-positive rate; FPR = false-positive rate.
Diagnostic Performance for Detection of Recurrent CRC (67 Regions in 26 Patients)
DISCUSSION
The present study indicates that in-line PET/CT significantly improves the staging of recurrent CRC compared with PET alone. In-line PET/CT demonstrated a lower rate of overstaging as well as understaging, resulting in an increase of overall staging accuracy from 71% to 88%. An automated software fusion of independently acquired PET and CT studies failed in 24% of the patients. In the remaining cases, the misregistration between PET and CT was almost twice as large as that for in-line PET/CT.
To our knowledge, only one study has been published so far that compares in-line PET/CT and PET for staging of colorectal cancer. Cohade et al. (20) examined 45 patients with CRC with a PET/CT scanner. PET and PET/CT studies were analyzed by a “moderately experienced observer.” Staging and restaging accuracy for PET was 78% and increased to 89% for PET/CT. This increase is comparable to the present study. However, in the study by Cohade et al., follow-up data for at least 6 mo were available in only 25 patients (56%). Seven patients who did not have verification of the findings in PET/CT were excluded from the analysis of the diagnostic accuracy.
Selection of a gold standard for staging of malignant tumors is a complex issue if the accuracy of imaging tests for detection of distant metastases is to be determined. Frequently it is not possible to verify all suspicious lesions histologically; thus, the specificity of the test may be biased. Furthermore, histologic verification of distant metastases can generally be obtained only for lesions detected by at least one imaging modality. This so-called “verification-bias” may result in a falsely high sensitivity for the studied imaging test because metastases that were not apparent in any imaging modality are not considered (24,25).
To minimize these potential biases of sensitivity and specificity, we used normal follow-up imaging for at least 6 mo to exclude metastatic disease. Disease recurrence was confirmed by histologic examinations or progression of lesion size in follow-up studies. One may argue that, because of this definition of the gold standard, some of the false-negative findings in our study were in fact due to disease progression and not due to the failure to detect established metastases. However, this distinction is mainly a matter of definition of what constitutes a “metastasis.” In addition to avoiding a statistical bias, our approach to define the absence of disease is also of clinical relevance: the high sensitivity (89%) and negative predictive value (96%) of PET/CT in our study demonstrate that a negative PET/CT study can ensure the patient and the referring physician that disease progression is very unlikely during the next 6 mo. Such a conclusion can only be made if follow-up data are used as the gold standard to exclude metastatic disease.
In our study PET, PET/CT, and software fusion of PET and CT were interpreted separately by independent observers. We used this approach to eliminate any influence of “recall bias” on the interpretation of the PET and CT studies. However, reading of the studies by independent observers may confound the results by interobserver variability in scan interpretation. Interobserver variability may result in more “random” variation in scan interpretation and, thereby, obscure differences in the diagnostic accuracy of the studied tests. However, in the present study there was only one discrepant finding that is explained by interobserver variability. In this patient, focally increased 18F-FDG uptake in the left parotid gland was considered as equivocal for malignancy in the software fusion of PET and CT but as probably benign in PET and PET/CT. In this case, the observers evaluating PET and PET/CT, respectively, considered a metastasis to the parotid gland as very unlikely and correctly attributed the uptake to a benign Wharthin’s tumor (Table 2, patient 14) (26). In contrast, the observer evaluating the software fusion of PET/CT was more cautious in his scan interpretation and decided that the lesion was equivocal for malignancy. Interobserver variability may also introduce a systematic bias if, for example, one observer reads all PET studies and another observer reads all PET/CT studies. In our study, therefore, each of the 3 observers read only one third of the PET, in-line PET/CT, and software fusion scans.
The improvement of diagnostic accuracy by in-line PET/CT compared with PET was mainly due to improved anatomic localization of hypermetabolic lesions (9/11 regions, 82%). In most of these cases, focal 18F-FDG uptake in retroperitoneal or peritoneal lesions was better differentiated from physiologic 18F-FDG uptake in the bowel (Table 2) (27,28). However, there were also 2 cases in which abnormalities were only visible in the CT images (small pulmonary metastases, sclerotic bone metastasis). This indicates that, for staging of recurrent CRC, the CT part of the PET/CT study should be thoroughly evaluated for signs of metastatic disease and not used only for anatomic localization of abnormalities identified in the PET study.
Software fusion of independently acquired PET and CT scans was not successful in 24% of the patients (20% of the scans). This failure rate is in accordance with a recently published study evaluating a system from a different company (29). Software fusion failed more often for chest than for abdominal scans (12% vs. 27%). Most likely this is due to the fact that the CT scans of thorax were acquired during maximal inspiration, resulting in large differences between the configuration of the chest in the PET and CT images (29). Future studies are required to identify additional factors explaining the failure of software fusion in certain patients. Based on the results of such studies, it may be feasible to further optimize the implementation of the mutual information algorithm for coregistration of PET and CT scans.
In cases of successful software fusion, its diagnostic accuracy was comparable to in-line PET/CT in the present study. However, the coregistration of PET and CT scans was significantly less accurate. Therefore, it is likely that the diagnostic performance of software fusion is actually lower than that of in-line PET/CT. These differences might not be apparent in the present study due to the relatively low number of scans with successful software fusion.
The following limitations of this study should be mentioned. The accuracy of coregistration between independently acquired PET and CT studies can be improved, when the data from the transmission scan of the PET study are used as additional parameters for the software fusion (29,30). However, we could not test this approach in our study because the PET/CT scanner we used is not equipped with transmission sources. In addition, the success of software fusion of PET and CT may be improved by first performing a manual coregistration of the images and then using the automated software fusion. However, we did not evaluate this approach because it is both operator dependent and time consuming and, therefore, in our opinion not suitable for routine clinical use.
Software fusion of whole-body PET scans with dedicated CT scans of the chest or abdomen/pelvis was evaluated in the present study. Further studies are required to determine whether the success rate of software fusion is higher when PET and CT scans cover the same anatomic area (software fusion of whole-body PET with whole-body CT). However, CT scans of the chest and abdomen/pelvis are frequently acquired as separate studies to optimize the respiratory phase and contrast enhancement for detection of pulmonary and liver metastases. Therefore, we believe that our study provides a realistic estimate for the performance of software fusion in routine clinical practice.
The CT scans of the in-line PET/CT study were acquired without intravenous contrast. Anatomic localization of lesions in PET may be further improved by contrast-enhanced CT studies. Furthermore, the sensitivity of CT for detection of hypovascular liver metastases is improved in contrast-enhanced studies acquired during the portal-dominant phase (31). Thus, the use of intravenous contrast may further improve the diagnostic accuracy of in-line PET/CT, and this approach should be evaluated in future studies.
No attempt was made to determine whether simple side-by-side analysis of independently acquired PET and CT scans would yield an accuracy comparable to that of in-line PET/CT or software fusion of PET and CT. However, previous studies in non–small cell lung cancer have already suggested that in-line PET/CT is superior to a side-by-side analysis of PET and CT scans (11). Therefore, we focused our studies on techniques that use coregistered PET and CT datasets.
CONCLUSION
In-line PET/CT provides a high accuracy for staging of recurrent CRC that is significantly higher than that of PET alone. Because in-line PET/CT also has the potential to reduce the time required for the diagnostic work-up, it is likely to become the new standard for the staging of patients with recurrent CRC. Compared with PET alone, software fusion of independently acquired PET and CT studies also improved the accuracy of staging. However, because of its high failure rate, software fusion currently cannot be considered to represent a valid alternative to in-line PET/CT.
Footnotes
Received May 14, 2004; revision accepted Dec. 8, 2004.
For correspondence or reprints contact: Wolfgang A. Weber, MD, Nuclear Medicine, UCLA School of Medicine, 10833 Le Conte Ave., Los Angeles, CA 90095-6942.
E-mail: wweber{at}mednet.ucla.edu
REFERENCES
In this issue


Jump to section
Related Articles
Cited By...
- Software Fusion: An Option Never Fully Explored
- Dual-Modality Imaging: Combining Anatomy and Function
- Recommendations on the Use of 18F-FDG PET in Oncology
- Significant Benefit of Multimodal Imaging: PET/CT Compared with PET Alone in Staging and Follow-up of Patients with Ewing Tumors
- Evaluation of Image Registration in PET/CT of the Liver and Recommendations for Optimized Imaging
- Value of contrast-enhanced multiphase CT in combined PET/CT protocols for oncological imaging
- PET-Based Treatment Planning in Radiotherapy: A New Standard?
- Screening for Cancer with PET and PET/CT: Potential and Limitations
- Improvements in Cancer Staging with PET/CT: Literature-Based Evidence as of September 2006
- Early Detection of Cancer Recurrence: 18F-FDG PET/CT Can Make a Difference in Diagnosis and Patient Care
- Forced Diuresis Improves the Diagnostic Accuracy of 18F-FDG PET in Abdominopelvic Malignancies