


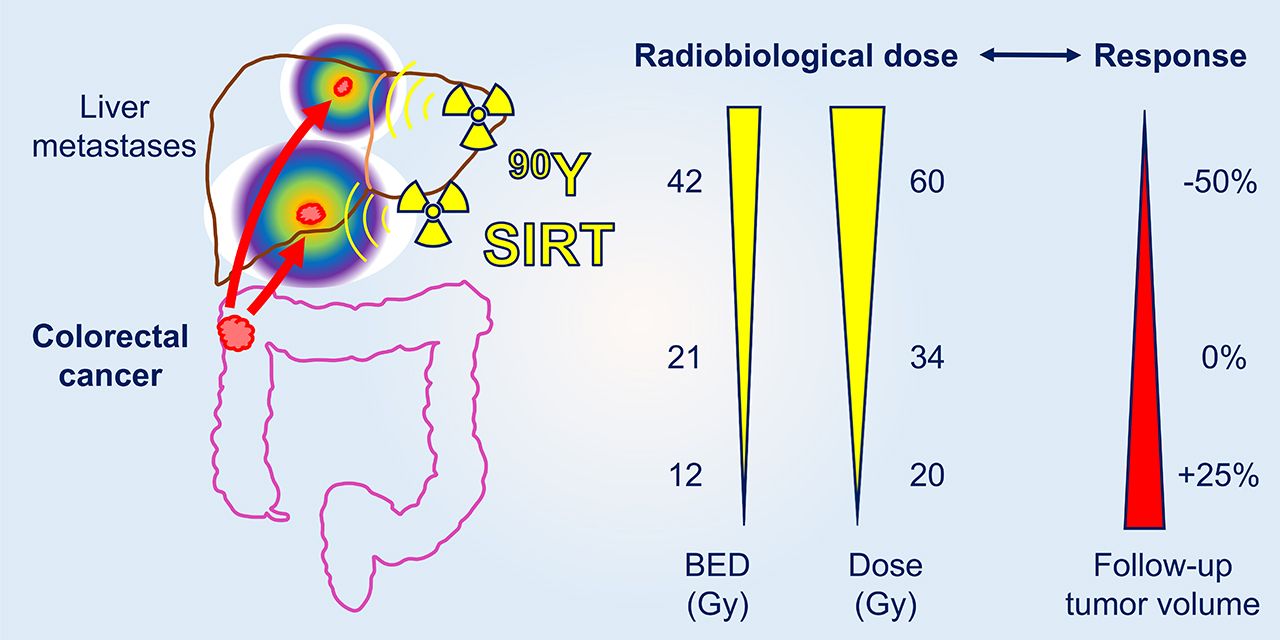
Visual Abstract
Abstract
The purpose of this study was to establish the dose–response relationship of selective internal radiation therapy (SIRT) in patients with metastatic colorectal cancer (mCRC), when informed by radiobiological sensitivity parameters derived from mCRC cell lines exposed to 90Y. Methods: Twenty-three mCRC patients with liver metastases refractory to chemotherapy were included. 90Y bremsstrahlung SPECT images were transformed into dose maps assuming the local dose deposition method. Baseline and follow-up CT scans were segmented to derive liver and tumor volumes. Mean, median, and D70 (minimum dose to 70% of tumor volume) values determined from dose maps were correlated with change in tumor volume and volumetric RECIST response using linear and logistic regression, respectively. Radiosensitivity parameters determined by clonogenic assays of mCRC cell lines HT-29 and DLD-1 after exposure to 90Y or external beam radiotherapy (EBRT; 6 MV photons) were used in biologically effective dose (BED) calculations. Results: Mean administered radioactivity was 1,469 ± 428 MBq (range, 847–2,185 MBq), achieving a mean absorbed radiation dose to tumor of 35.5 ± 9.4 Gy and mean normal liver dose of 26.4 ± 6.8 Gy. A 1.0 Gy increase in mean, median, and D70 absorbed dose was associated with a reduction in tumor volume of 1.8%, 1.8%, and 1.5%, respectively, and an increased probability of a volumetric RECIST response (odds ratio, 1.09, 1.09, and 1.10, respectively). Threshold mean, median and D70 doses for response were 48.3, 48.8, and 41.8 Gy, respectively. EBRT-equivalent BEDs for 90Y are up to 50% smaller than those calculated by applying protraction-corrected radiobiological parameters derived from EBRT alone. Conclusion: Dosimetric studies have assumed equivalence between 90Y SIRT and EBRT, leading to inflation of BED for SIRT and possible undertreatment. Radiobiological parameters for 90Y were applied to a BED model, providing a calculation method that has the potential to improve assessment of tumor control.
A multimodal approach to the control of liver-limited disease is important in the management of metastatic colorectal cancer (mCRC). Combination treatment incorporating external beam radiotherapy (EBRT) can be challenging because dose is constrained by hepatic radiosensitivity. An alternative is selective internal radiation therapy (SIRT), where 90Y-radiolabeled microspheres are injected into the hepatic artery, lodge in abnormal tumor vessels, and deliver β-radiation. Phase 3 trials (FOXFIRE, SIRFLOX, and FOXFIRE-Global) in patients with unresectable, chemorefractory, liver-limited mCRC have shown that SIRT plus chemotherapy improves control of liver disease but not overall survival (1). Except for first-line therapy, consensus guidelines recommend SIRT in combination with anticancer agents for mCRC liver tumors (2).
Current practice does not mandate personalized dose prescriptions for SIRT (3). Instead, the amount of administered radioactivity is usually based on body weight and height, ignoring variability in the accumulation of 90Y and dose to individual tumors. A growing body of evidence shows that a dose–response relationship exists for SIRT. For example, the radiation dose delivered via SIRT correlates with change in total lesion glycolysis based on 18F-FDG PET (4–6) and with tumor response defined by RECIST (7,8) or volumetric RECIST (vRECIST) criteria (7,9). Studies of 99mTc-macroaggregated albumin imaging are inconsistent, with some showing that it is predictive of 90Y dose deposition and others not (10). Omission of individualized dosimetry may render the absorbed radiation dose to tumor suboptimal and reduce the chance of response. This may be compounded if it is assumed that the biological response to 90Y is like that of high-energy photons. Given the difference in the dose rate (90Y, 2–8 Gy/d; EBRT, 1–5 Gy/min) and quality of these 2 types of radiation, and the nonuniformity of dose distribution with SIRT, this assumption is unfounded (11).
Several investigators have argued for patient-specific SIRT dosimetry (12). Cremonesi et al. applied radiobiological metrics derived from EBRT to inform SIRT treatment, recommending administration of higher amounts of radioactivity than given previously (13). Strigari et al. also drew on experience with the radiobiological effects of EBRT to predict the tumor control probability of radionuclide therapy (14,15). Few studies have explored differences in the biological response to 90Y SIRT compared with EBRT and the implications for treatment (16,17). We compared the radiobiological effects of 90Y and high-energy photons in colorectal cancer (CRC) cell lines using clonogenic assays (16). This comparison highlighted that 90Y and EBRT have markedly different effects that can be ascribed mainly to the continuous low dose rate of 90Y radiation.
A tumor-by-tumor dosimetric analysis after SIRT in patients with mCRC to establish a radiobiological dose–response relationship is presented in this article. Dose metrics were derived for each tumor: mean and median doses, D70 (minimum dose to 70% of tumor volume), and the relative standard deviation (SD) (RSD), a measure of dose heterogeneity. Statistical associations between these parameters and changes in tumor volume and vRECIST were explored. A dosimetric analysis that incorporated radiobiological parameters for 90Y was undertaken and the clinical implications reviewed.
MATERIALS AND METHODS
Patient Selection
A review of 23 patients with CRC treated with 90Y resin microspheres (SIR-Spheres; Sirtex) at the Oxford Cancer Centre between November 2014 and October 2015 was conducted. Patients with inoperable chemorefractory liver metastases (96 tumors), no bone metastases, no previous SIRT, stable liver enzymes, no contraindications to angiography, and a World Health Organization performance status of 0 to 2 were included. Patient characteristics are shown in Table 1. Informed written consent, Institutional Review Board approval (Oxford University, PID12277), and Health Research Authority ethical approval (IRAS214611) were obtained.
Patient Characteristics
SIRT Treatment
99mTc-macroaggregated albumin was used as a surrogate for 90Y-microspheres to evaluate distribution and lung shunt but not as the basis for dosimetry. Angiography was performed to map vessels, and if there was extrahepatic shunting, coil embolization was used to redirect flow. 90Y resin microspheres were injected through catheterization of the hepatic artery under fluoroscopic visualization. Administered 90Y activity (847–2,185 MBq; mean, 1,469 ± 428 MBq) was prescribed according to the method used in the FOXFIRE trial based on body surface area, lung shunt, and percentage tumor involvement (1).
Image Analysis
Triple-phase contrast-enhancement CT (GE Healthcare LightSpeed VCT) and T2-weighted fat-saturated MR images (GE Healthcare Signa 3T) were acquired 11–48 d before treatment (baseline), SPECT/CT images were acquired 1 d after treatment, and follow-up CT and MR images were acquired 8–12 wk later. Manual registration of baseline CT and MR images to SPECT/CT was performed using HybridViewer software (version 2.6F; Hermes). SPECT/CT scans were acquired on a dual-head γ-camera (GE Healthcare Discovery D670) by imaging bremsstrahlung radiation with an energy window of 50–150 keV using a medium-energy general-purpose collimator, a 128 × 128 matrix, 90 views, and 20 s per view. The GE Healthcare default settings were used for SPECT/CT data reconstruction (scatter correction off, resolution recovery on, and attenuation correction on). Images were processed using Xeleris (version 3.0; GE Healthcare) with the default ordered-subset expectation maximization settings (2 iterations and 10 subsets).
Voxel-based gross tumor volumes were determined by cross-referencing CT sections with MR images to localize tumor boundaries and guide CT segmentation at baseline and at the 2 to 3 mo follow-up. To assess outcome, response was based on vRECIST, comparing relative change in tumor volume, defined as the ratio of the difference between tumor volume at baseline and after treatment to the baseline volume  . Response criteria (complete response [CR], partial response [PR], stable disease, and progressive disease [PD]) were as previously defined (9).
Dosimetry
Liver and tumor segmentation was performed on baseline and follow-up contrast-enhanced CT and on treatment CT (from SPECT/CT) images. A cumulated activity matrix was derived by scaling the total attenuation-corrected SPECT signal in the liver voxels plus the lung-shunt percentage to equal the cumulated administered activity assuming physical decay only. Absorbed dose for each voxel  was calculated for each voxel
  in the cumulated activity matrix using the local deposition method (Eq. 1) (18).
 Eq. 1The dose per unit cumulated activity, S (6.22 Gy MBq−1 h−1), was taken as a constant assuming that all the dose from 90Y was absorbed within the SPECT voxel (4.42 mm water cube). Radiation spectra of 90Y were from the unabridged decay data of the MIRD tabulation (MIRD-RADTABS, version 2.2). Voxelized dose maps gave a distribution of doses in each tumor, which was summarized using dose–volume histograms by applying an in-house MATLAB code validated against replicated analysis with MIM SurePlan LiverY90 (MIM Software) when SPECT counts were cumulated in the liver (3.6% larger S-value).
Radiobiological Models
The radiosensitivity parameters, α and β, which are the linear and quadratic terms of the linear-quadratic model, were previously determined for 2 CRC cell lines, DLD-1 and HT-29, exposed to up to 30 Gy from 90Y or 6 MV photons (Table 2) (16). An α/β-ratio was established for a combined model of the 2 cell lines representing a range of CRC radiosensitivities. These experimentally derived radiobiological parameters were used to determine biologically effective dose (BED), which allows comparison between different fractionation schedules or treatment modalities with specific α/β ratios (19).
α, β (Corrected for Indefinite Exposure) and α/β Values for DLD-1 and HT-29 Cell Lines Adopted from Lee et al. (16) Compared with a Mixed Model After Exposure to 6 MV Photons (EBRT) or 90Y
To compare the biological response of 90Y versus EBRT, BEDs were calculated for 90Y using radiosensitivity parameters from EBRT applying either the conventional or a modified method proposed previously (16). The modified method (Eq. 2), denoted  , accounts for linear energy transfer and dose-rate effects of 90Y radiation.
 Eq. 2where the cumulative dose of 90Y radiation is
  , the maximum relative biological effectiveness (RBE) =
 , and G is the Lea–Catcheside dose-protraction factor, estimated for a fully decayed radiation source as
 Eq. 3
Eq. 3
Trep is the sublethal damage repair half-time and Tphys is the radionuclide decay half-life. The radiobiological fitting parameters are summarized in Supplemental Table 1 (supplemental materials are available at http://jnm.snmjournals.org) (16). The conventional method, denoted  , uses α/β ratios of EBRT adjusted only by the dose protraction factor (
 , Eq. 3) while assuming that maximum RBE = 1. Voxelized liver BED maps of 90Y were determined by converting the physical mean absorbed dose of each voxel to
  , using the α/β-ratio for the 90Y mixed model.
Statistics
The R software package (version 3.3.3; R Core Team) was used. Dose metrics (mean, SD, median, D70, and RSD of mean dose) were derived for each tumor from dose maps and used as explanatory variables in the regression analysis. Thresholds for each dose metric were based on the cutoff for decrease in tumor size. Linear regression was used to assess the relationship between dose and change in tumor volume. Logistic regression was used to assess the relationship between dose and response. Regressions were fitted using generalized estimating equations to account for tumors belonging to the same patient. Odds ratios are provided for the association between response and dose metrics. Tumors smaller than 1 cm3 were not considered because of the spatial resolution limitations of SPECT. α/β-ratios were derived from a linear mixed-effects model from experimental data. Calculated BED values were used in the regressions. Analyses were repeated with patients as the unit of analysis, with tumors grouped by patient.
RESULTS
Patients
Patient baseline characteristics are summarized in Table 1. Median overall survival was 10.5 mo (1 patient was alive at time of analysis). One patient experienced pain and nausea. No patient experienced liver decompensation.
Tumor Response and Absorbed Dose
Dosimetric information is shown for representative patients with partial and mixed responses (Figs. 1 and 2) and for patients who did not respond or progressed (Supplemental Figs. 1 and 2). Mean and median normal liver doses were 26.4 ± 6.8 Gy (range, 15.4–41.3 Gy) and 24.9 Gy (interquartile range, 22.3–30.6 Gy), respectively. Mean and median tumor doses were 35.5 ± 9.4 Gy (range, 2.2–84.8 Gy) and 32.9 Gy (interquartile range, 23.3–46.8 Gy), respectively.

Patient 2 (75 y, 1.78 m2 body surface area): rectal cancer with pulmonary and liver metastases, treated by hepatic resection and chemotherapy. (A) Baseline imaging acquired 15 d before SIRT. 99mTc-macroaggregated albumin, angiography, and coil embolization were performed, achieving 16.8% lung shunt. 90Y microspheres (1,562 MBq) were administered. (B) SPECT/CT 1 d after SIRT, demonstrating favorable distribution of 90Y in tumor. (C) CT image 80 d after SIRT, revealing PR, but significant extrahepatic disease remained. (D) Dose–volume histogram of absorbed doses in normal liver and tumor. (E) Volumetric analysis indicating tumor response.

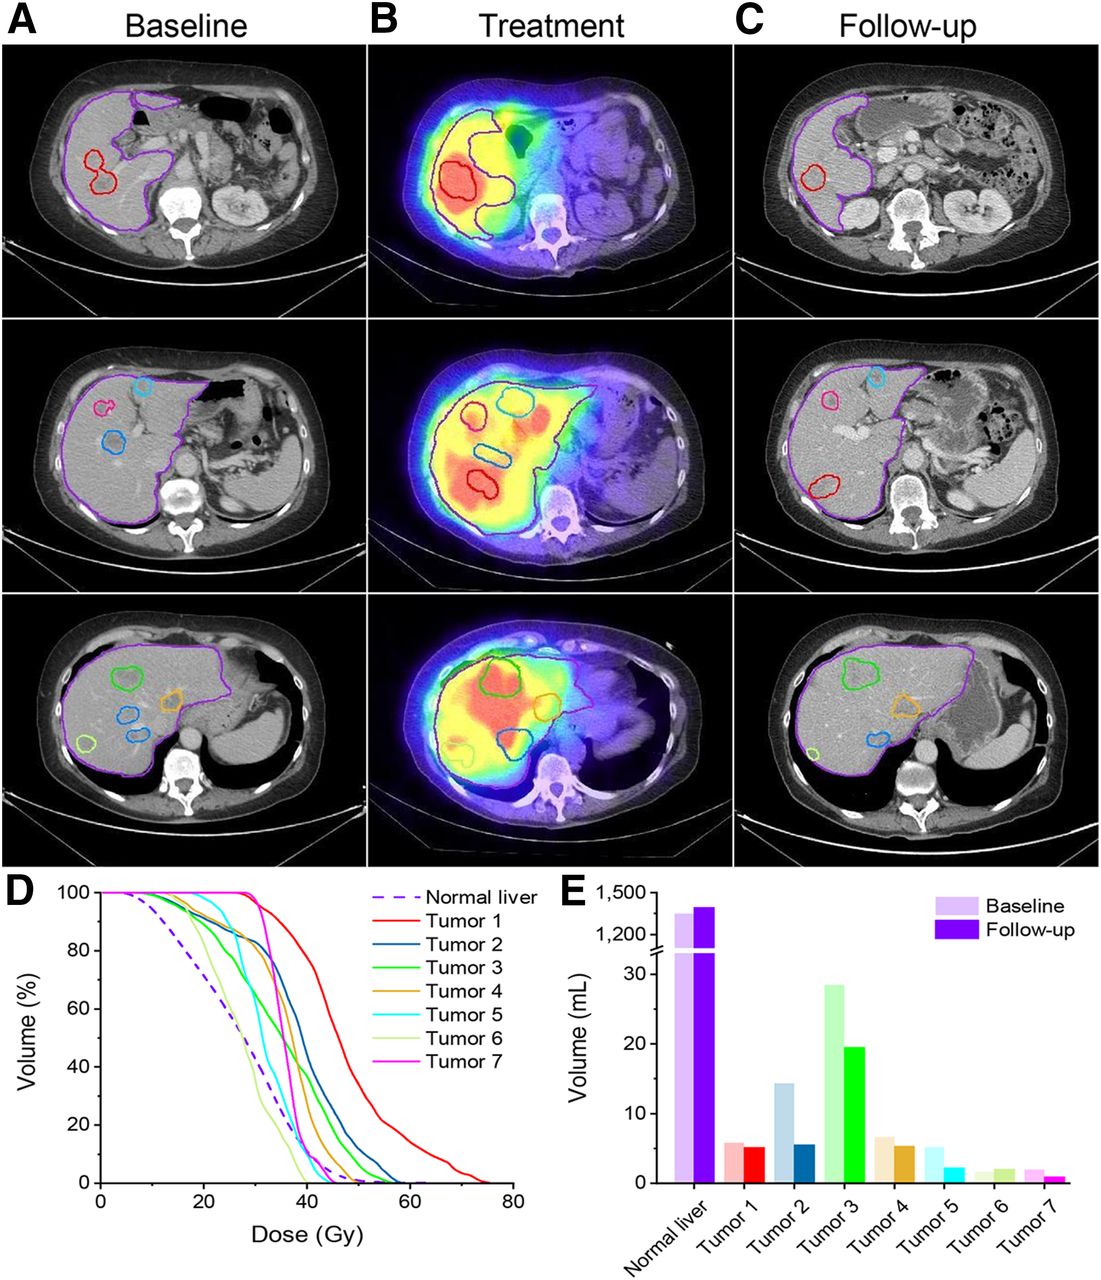
Patient 14 (66 y, 1.70 m2 body surface area): liver, ovarian, and pulmonary metastases, treated by resection of descending/sigmoid colon adenocarcinoma and 3 courses of chemotherapy. (A) Baseline CT acquired 27 d before SIRT. 99mTc-macroaggregated albumin, angiography, and coil embolization were performed, achieving 0% lung shunt. 90Y microspheres were administered in 2 injections of 939 MBq. (B) SPECT/CT 1 d after SIRT, demonstrating variable accumulation in tumors. (C) CT at 74 d, revealing PR in some lesions. (D) Dose–volume histogram of liver and tumor absorbed doses, reflecting variable uptake in tumor. (E) Volumetric analysis indicating variable tumor response.
Linear regression analysis showed that mean, median, and D70 dose values statistically significantly correlated with a reduction in tumor volume of 1.8%/Gy (P < 0.005), 1.8%/Gy, (P < 0.005), and 1.5%/Gy (P < 0.01), respectively (Fig. 3). No tumor increased in volume after receiving mean, median, and D70 doses greater than 48.3, 48.8, and 41.8 Gy, respectively. The RSD of the voxelized-dose distribution did not significantly correlate with tumor volume change (P > 0.5). Exclusion of 47 small tumors (<10 cm3) did not change the analysis; mean dose values significantly correlated (P < 0.001) with reduction in tumor volume (1.9%/Gy). Mean dose for tumors larger than 10 cm3 also significantly correlated (P = 0.044) with reduction in tumor volume (1.8%/Gy). Large (>100 cm3) and small (<10 cm3) tumors were equally likely to respond to therapy. Linear regression analysis showed no appreciable correlation between baseline and follow-up tumor volume (Supplemental Fig. 3).
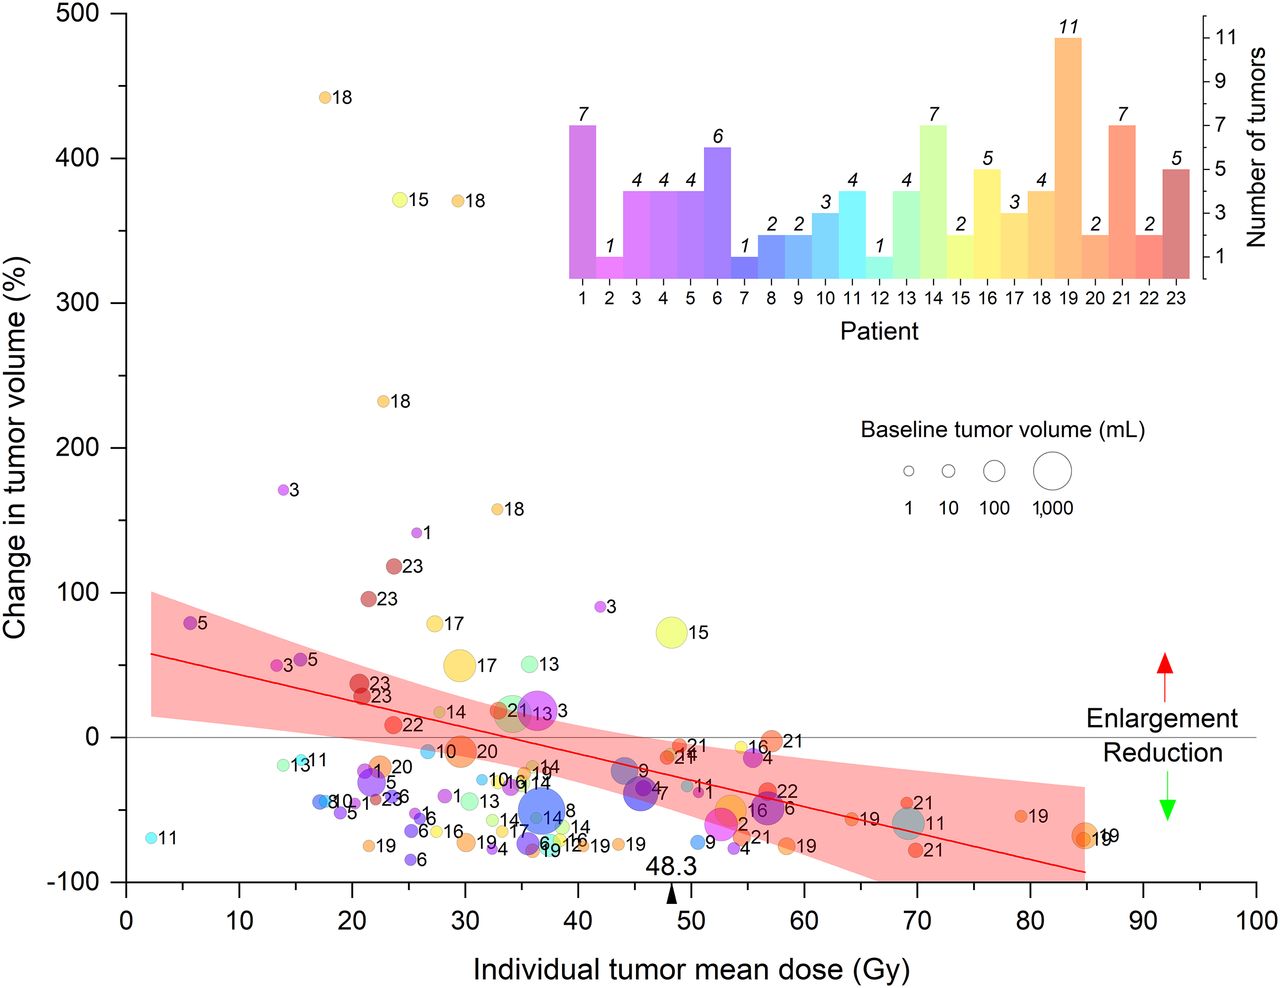
Relationship between change in tumor volume and mean dose. Tumors of each patient are depicted in same color and numbered. Data points above horizontal gray line indicate tumor growth at follow-up; points below denote tumor shrinkage. Linear regression analysis (red line, 95% confidence interval of best fit) shows reduction in tumor volume of 1.8% per 1.0 Gy of absorbed dose (95% confidence interval, 0.7%–3.0%; P < 0.005; R2 = 0.10). All tumors that received at least 48.3 Gy reduced in size.
vRECIST response after 90Y SIRT for each tumor is shown in Figure 4. PR was achieved in 14% of tumors, stable disease was achieved in 63%, and 23% showed PD. Although there was a mixed response of tumors in individual patients, 2 (patients 15 and 18) did not respond to treatment, irrespective of tumor volume at baseline or dose. When PR was evaluated as a measure of response against stable disease and PD, the mean, median, and D70 tumor doses significantly correlated with vRECIST response (P < 0.05, P < 0.01, and P < 0.0001, respectively), with odds ratios of 1.09, 1.09, and 1.10, respectively. RSD did not significantly correlate with response (P > 0.5).

vRECIST response as function of dose for each tumor. No tumors showed CR. All tumors that showed reduction in volume of at least 65% were PR. Tumors that grew by at least 73% were termed PD. Tumors not meeting these criteria were designated as stable disease (SD).
Radiobiological Models
Radiosensitivity parameters are summarized in Table 2. A mixed model, taking the mean of the α/β ratio of 2 CRC cell lines (to represent variation in radiosensitivity in CRC), gave values of 8.02 and 226 Gy for EBRT and 90Y, respectively. BEDs were calculated on a voxel-by-voxel basis for each tumor using the mixed model for 90Y. For the 96 tumors, the values of mean  , median
  , and D70
  were 21.0 Gy (range, 1.24–67.7 Gy), 20.9 Gy (range, 1.22–65.3 Gy), and 17.4 Gy (range, 1.13–55.5 Gy), respectively. Taking each tumor as the unit of analysis, the
  metrics (mean, median, and D70) correlated statistically significantly with change in tumor volume using linear regression analysis (P < 0.01, P < 0.005, and P < 0.01, respectively). With the patient as the unit of analysis, and when evaluating PR and stable disease versus PD, the mean, median, and D70
  metrics significantly correlated with vRECIST response (P < 0.01, P < 0.01, and P < 0.0001 and with odds ratios of 1.10, 1.10, and 1.09, respectively). RSD did not significantly correlate with response (P > 0.5).
The relationship between 90Y absorbed dose and BED for the conventional method  was compared with the modified method (
 ) (16). Figure 5 illustrates how misunderstandings can arise unless the differences in the radiobiological effects of the 2 types of radiation are considered. For example, a physical dose from 90Y irradiation of 48.3 Gy gives the same BED (
 ) as 32.5 Gy of 90Y-equivalent EBRT. When EBRT α/β ratios were used correcting for dose protraction only, a 90Y physical dose of 48.3 Gy was shown to be equivalent to a BED (
 of 54.9 Gy.

Relationship between physical 90Y dose and BED. BED was calculated using experimentally derived parameters for DLD-1 and HT-29 cell lines and the mixed model of both cell lines (Supplemental Table 1). BED, as given in Equation 2 (y-axis), was compared to BED calculated using conventional assumption that RBE_max=1 (top x-axis).
DISCUSSION
The success of EBRT is attributable to an understanding of the absorbed dose–response relationship, encapsulated by the linear-quadratic model. This relationship has been adopted for radionuclide therapy without the support of experimental data to illuminate the specific biological effects of radioisotopes. Differences in biological effects result in variable RBE, despite the same amount of energy absorbed per unit mass. For this reason, the modified BED equation (Eq. 2) that accounts for dose rate and linear energy transfer was used. Cell repopulation effects play a role in BED modeling because of the time scale of the treatment, but limited data exist for 90Y SIRT. Because cell doubling times would be extrapolated from EBRT, repopulation was excluded from the BED model here.
There are no standard methods for 90Y SIRT dosimetry reporting. The best practice is to follow published guidelines and report the protocols followed to enable critical evaluation of data (20). Such a practice allows compilation of dose–effect relationships in the absence of large multicenter trials and informs future studies focusing on delivering tumoricidal radiation doses.
In this study, the spatial dose distribution was consolidated into a dose–volume histogram and tumors were considered individually. A caveat is that spatial information is lost, and so the mean absorbed dose of a tumor does not always reflect intratumoral dose heterogeneity. Therefore, we also examined the association between change in tumor volume and median and D70 values (Fig. 3). Threshold mean, median, and D70 doses of 48.3, 48.8, and 41.8 Gy, respectively, are reasonably consistent with the mean dose of 29.8 Gy and D70 of 42.3 Gy reported by Fowler et al. (7), the average dose of about 50 Gy reported by Willowson et al. (21), an average dose greater than 66 Gy (95% CI, 32–159 Gy) noted by Flamen et al. (4), and results from a prospective study (6) that reported a dose of 51 ± 28 Gy as the minimum tumor absorbed dose needed to reduce total lesion glycolysis by more than 50%. Levillain et al. noted that a significantly longer overall survival was observed in patients with lesions achieving a mean dose of more than 39 Gy (5). However, direct comparison with these studies is limited because, unlike the current study, they used 99mTc-macroaggregated albumin SPECT or 90Y PET imaging. As reported by others, efficacy in patients receiving glass microspheres or EBRT resulted in tumor α-values that were at least an order of magnitude smaller than found in clonogenic experiments (≈0.2 Gy−1) (22). These unexpectedly low values were attributed to “effective radiosensitivity” and considered to be pragmatic input figures for radiobiological modeling (22). Notably, an effective maximum RBE of 0.4 was reported, which agrees with 0.56 in the mixed model presented here.
Despite use of the same activity calculation scheme, the median overall survival for the combined FOXFIRE, SIRFLOX, and FOXFIRE-Global analysis was 12.1 mo longer than this patient group. The combined-analysis patients achieved 68% CR plus PR, whereas in the current group no patient had CR and 14% had PR, suggesting they had more advanced disease. Indeed, the combined-analysis patients had a lower rate of extrahepatic metastases and no prior chemotherapy. If a response threshold appears to be strongly dependent on tumor size, it could indicate that target tumor absorbed dose may be modified to increase response or, if dose heterogeneity is a prognostic factor, EBRT could be considered to boost low-dose regions. Bhooshan et al. found that pretreatment volume was a significant predictor of stable disease or PR using volumetric response criteria (23). Therefore, we evaluated baseline tumor volume as a predictor of tumor response but found there was no statistically significant correlation between baseline and change in tumor volume. It is documented that absorbed dose heterogeneity in tumors leads to a lack of response (21). We evaluated RSD as a measure of dose heterogeneity. Linear regression analysis showed no correlation between RSD and change in volume. Absorbed dose heterogeneity at the microscopic level would suggest that more cells received overdosing or underdosing than could be captured by a SPECT voxel and would broaden the dose–volume histogram. The differences in response noted in individual patients could be the result of microscopic dose heterogeneity, phenotype, or molecular pathologic differences between tumors.
Image reconstruction settings affect these results. Because the bremsstrahlung SPECT reconstruction was performed without scatter correction, the images had depreciated contrast that likely underestimated tumor doses while overestimating non-tumor doses. Scatter correction strategies should be applied to 90Y SPECT imaging. Phantom studies on the same type of SPECT scanner as used here indicated that ordered-subset expectation maximization (5 iterations and 15 subsets) with Monte Carlo collimator modeling improved contrast recovery (24). This software was unavailable for this study. Porter et al. showed that a 14.1 mL sphere had about 20% smaller contrast recovery than a 33.5 mL sphere. Because recovery correction was not performed and varies with size, smaller tumors would be biased to have artificially lower doses. Partial volume corrections were not included in this cohort. Low-contrast recovery has been observed in spheres smaller than 4.2 mL (20-mm diameter) (21,24), and the partial volume effect has been shown to result in activity recovery of about 20% for small lesions (25,26). For this reason, tumors smaller than 10 cm3 were analyzed separately. When small tumors were omitted, overall correlations were unchanged.
To achieve tumoricidal doses, understanding the biological effect of dose is necessary. Radiobiological models such as BED can be used to plan retreatments or additional treatments such as EBRT to undertreated tumors. BED calculations using 90Y SIRT patient data have not previously been performed using radiosensitivity parameters determined experimentally from CRC cell lines. It is usually assumed that the α/β ratios of 90Y and EBRT are related and simply adjusted for the protracted delivery of dose with 90Y (8,14). This assumption has been shown to not be the case (Table 2), and a formula relating the BED of different radiation modalities was derived (16).
Toxicity was modest in this cohort, consistent with a recent study showing no evidence of radiation-induced hepatitis after SIRT (27). The FOXFIRE, SIRFLOX, and FOXFIRE-Global clinical trials found that 90Y SIRT improved local control but did not improve overall survival (28). This result could be due to dose heterogeneity (3,8,11,12) or low dose rate (13,15). However, our results indicate that there was no statistically significant correlation between change in tumor volume and bremsstrahlung SPECT-based dose heterogeneity. Although we cannot discount the effect of low dose rate, the main finding when applying experimentally determined α/β ratios is that the achieved physical 90Y doses (40–60 Gy in tumor) are biologically equivalent to EBRT doses that are 20%–30% lower. If an EBRT BED of approximately 70 Gy is required for liver lesions, a BED of about 50 Gy delivered by 90Y SIRT would be less effective.
CONCLUSION
Dosimetry provides patient-specific information for optimal treatment. Radiobiological models can aid in delivering an efficacious dose to tumor while limiting dose to healthy tissue. BED calculations based on measured CRC radiosensitivity are lower than conventionally calculated BEDs. Conventionally calculated 90Y doses may sometimes be insufficient to achieve tumor control.
DISCLOSURE
This research was supported by grants from Cancer Research U.K. (C5255/A15935) and the Medical Research Council (MC-PC-12004). No other potential conflict of interest relevant to this article was reported.
KEY POINTS
QUESTION: Does the inclusion of radiobiological parameters specific to a therapeutic radionuclide affect the dose prescription?
PERTINENT FINDINGS: Mean, median, and D70 dose values correlated with change in tumor volume and vRECIST response. BEDs for 90Y were up to 50% smaller than those conventionally calculated by radiobiological parameters derived from EBRT adjusted for protraction effects only.
IMPLICATIONS FOR PATIENT CARE: Conventionally calculated 90Y doses may sometimes be insufficient to achieve tumor control.
Acknowledgments
We thank Drs. Glenn Flux and Allison Craig for discussions regarding dosimetry.
Footnotes
↵* Contributed equally to this work.
Published online May 1, 2020.
- © 2020 by the Society of Nuclear Medicine and Molecular Imaging.
REFERENCES
- Received for publication July 10, 2019.
- Accepted for publication March 16, 2020.


Jump to section
Related Articles
Cited By...
- No citing articles found.