


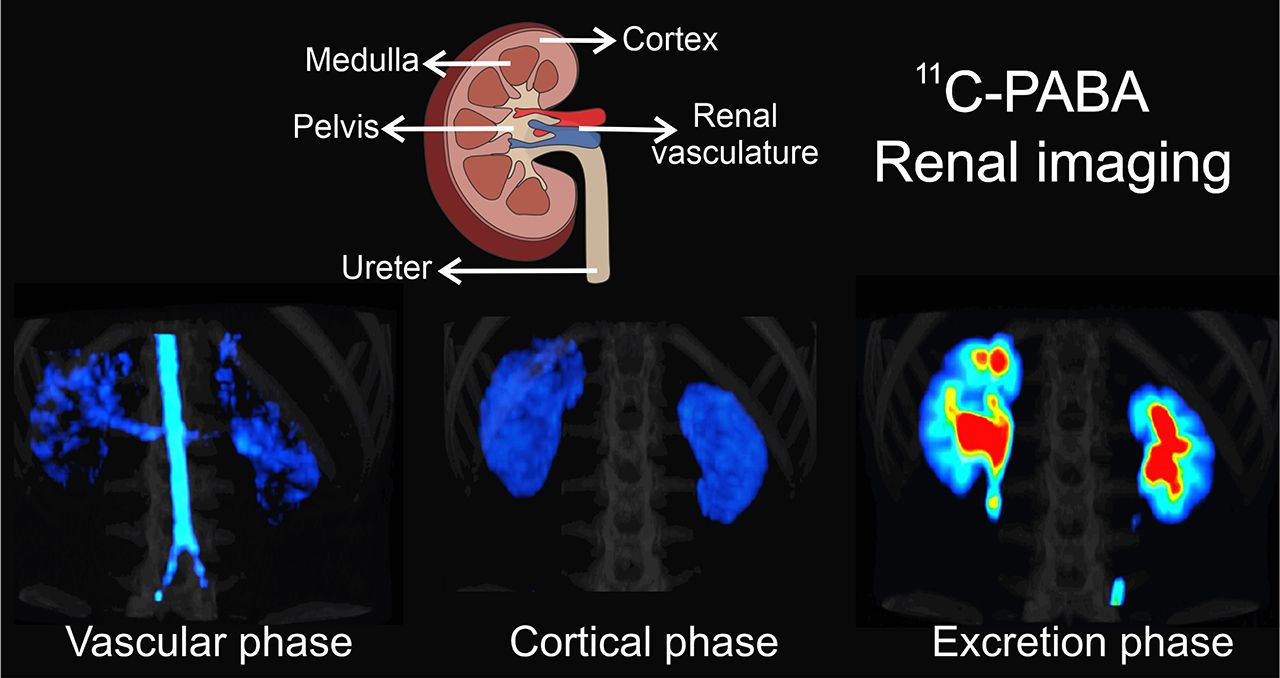
Visual Abstract
Abstract
para-Aminobenzoic acid (PABA) has been previously used as an exogenous marker to verify completion of 24-h urine sampling. Therefore, we hypothesized that PABA radiolabeled with 11C might allow high-quality dynamic PET of the kidneys with less radiation exposure than other agents because of its shorter biologic and physical half-life. We evaluated if 11C-PABA can visualize renal anatomy and quantify function in healthy rats and rabbits and in a first-in-humans study on healthy volunteers. Methods: Healthy rats and rabbits were injected with 11C-PABA intravenously. Subsequently, dynamic PET was performed, followed by postmortem tissue-biodistribution studies. 11C-PABA PET was directly compared with the current standard, 99mTc-mercaptoacetyltriglycin, in rats. Three healthy human subjects also underwent dynamic PET after intravenous injection of 11C-PABA. Results: In healthy rats and rabbits, dynamic PET demonstrated a rapid accumulation of 11C-PABA in the renal cortex, followed by rapid excretion through the pelvicalyceal system. In humans, 11C-PABA PET was safe and well tolerated. There were no adverse or clinically detectable pharmacologic effects in any subject. The cortex was delineated on PET, and the activity gradually transited to the medulla and then pelvis with high spatiotemporal resolution. Conclusion: 11C-PABA demonstrated fast renal excretion with a very low background signal in animals and humans. These results suggest that 11C-PABA might be used as a novel radiotracer for functional renal imaging, providing high-quality spatiotemporal images with low radiation exposure.
The use of molecular imaging to evaluate renal function is a field that has been an evolving for many decades (1). The initial approaches were based on radiolabeled agents with high renal clearance, focusing on 99mTc-radiopharmaceuticals (e.g., 99mTc-mercaptoacetyltriglycin [99mTc-MAG3]) and planar γ-cameras. Although these techniques are still widely used in clinical practice, they have some major limitations in that they provide only 2-dimensional information, with a concomitant lack of accurate anatomic correlation, low spatial resolution, and low signal-to-background ratio. The soft tissue attenuation may also reduce diagnostic accuracy and limit reliable quantification (2). Implementation of SPECT for renal imaging led to improvements in image contrast and spatial resolution. However, in recent years there has been a shift toward the development of PET renal imaging agents. PET offers multiple advantages such as 3-dimensional dynamic visualization of the kidneys without organ overlap, a higher sensitivity and signal-to-background ratio, and absolute camera-based quantification with higher counts. PET allows administration of much lower doses of radioactivity and provides higher-accuracy measurements of regional radiopharmaceutical tissue concentrations (2–4). Novel agents for PET renal imaging that have shown promise include ethylenediaminetetraacetic acid labeled with 68Ga, fluorodeoxysorbitol labeled with 18F, nonpeptide angiotensin 1 antagonist labeled with 11C, 11C-acetate, para-18F-aminohippurate, and Re(CO)3-N-(18F-fluoroethyl)iminodiacetic acid, which reflects tubular function (2–8).
para-Aminobenzoic acid (PABA) is a nontoxic B-complex vitamin with fast renal excretion that has been used since the 1980s as an exogenous marker to verify the completion of 24-h urine sampling (9,10). Although PABA undergoes hepatic metabolism by phase II conjugation via N-acetyltransferase 1 and glycine conjugation, all its metabolites are renally excreted (11,12). By targeting the incorporation of PABA into the folate synthesis of bacteria, with low uptake in mammalian tissues and rapid renal elimination, investigators are developing radiolabeled analogs of PABA for bacteria-specific imaging (13–15). We hypothesized that the high renal concentration, excretion, and performance of 11C-PABA, as well as the potential for low radiation exposure, would be valuable characteristics for a renal imaging agent. In this article, we describe 11C-PABA PET renal imaging in 2 healthy animal species and a first-in-humans study on healthy volunteers.
MATERIALS AND METHODS
All animal protocols were approved by the Johns Hopkins University Biosafety, Radiation Safety, and Animal Care and Use Committees. Human studies were approved by the Johns Hopkins Institutional Review Board and performed under the auspices of the Radioactive Drug Research Committee program.
Synthesis of 11C-PABA
11C-PABA was synthesized as a sterile, pyrogen-free solution with high radiochemical purity and high specific activity (163.7 ± 40.9 GBq/μmol) using current good manufacturing practices at the Johns Hopkins Hospital PET center (16).
Animal Studies
Healthy Wistar rats (Charles River Laboratories) weighing 301.5 ± 33.2 g (3 females, 1 male) were injected with 22.3 ± 3.9 MBq of 11C-PABA through a tail-vein catheter, and dynamic PET was performed immediately afterward using a nanoScan PET/CT device (Mediso). The acquisition parameters were fifteen 1-min and six 5-min frames, for a total acquisition of 45 min. Healthy New Zealand White rabbits (Charles River Laboratories) weighing 3.0 ± 0.2 kg (2 females) were intravenously injected with 51.9 ± 3.9 MBq of 11C-PABA, followed by a 40-min dynamic PET scan using the nanoScan PET/CT device. The acquisition parameters were fifteen 1-min and five 6-min frames, for a total acquisition of 40 min. A CT scan for anatomic coregistration was also acquired for all animals. Quantitative analysis was performed by placing 7 volumes of interest using the CT images as a reference within the kidneys: outer layer (corresponding to renal cortex), inner layer (corresponding to renal pelvis), intermediate layer (corresponding to renal medulla), and bladder (only in rats). (The analyses for all the remaining volumes of interest are mentioned and plotted on Supplemental Fig. 1.) Renal perfusion was observed by visual assessment of 11C-PABA transit through the abdominal aorta after the injection. The images were analyzed using VivoQuant, version 4.0 (Invicro), and visualized using Amide, version 1.0.4. Maximal parenchymal uptake is represented as Tmax, which is the time from injection to peak activity on the renogram. The half-life is represented as T1/2, which is the time from Tmax to a 50% decrease. The relative renal uptake of the right and left kidneys is expressed as the percentage of the total uptake.
Postmortem Tissue Biodistribution
Four additional healthy female Wistar rats (weighing 235.1 ± 28.9 g) were given a simultaneous intravenous injection of 26.5 ± 1.5 MBq of 11C-PABA and 18.1 ± 0.6 MBq of 99mTc-MAG3 (Cardinal Health). The animals were sacrificed 30 min afterward, the tissues were harvested, and the associated radioactivity was quantified using an automated γ-counter (1282 Compugamma γ-Counter CS; LKB Wallac). The measurements for 99mTc-MAG3 were performed 2 h after those for 11C-PABA. The tissue biodistribution data are presented as percentage injected dose per gram of tissue.
Dosimetry
Four healthy mice (CBA/j; Jackson Laboratory) were injected with 47.73 ± 2.59 MBq of 11C-PABA through a tail-vein catheter, and dynamic PET was performed immediately afterward over 85 min as described in the “Animal Studies” section. The activity concentrations from the 4 mice were determined and used to calculate human organ-absorbed doses and time-integrated activity coefficients using the MIRD S-value methodology as implemented in the OLINDA/EXM software package (17–20).
The PET images were first coregistered to the CT images. Partial regions of interest were drawn on the CT images of a selection of mouse organs (brain, heart, lungs, liver, muscle, large intestine, and bone marrow) to obtain the activity concentration at 18 measured time-points after injection (0, 5, 10, 15, 20, 25, 30, 35, 40, 45, 50, 55, 60, 65, 70, 75, 80, and 85 min). Whole-organ contours were drawn to measure the activity in the kidneys and bladder. The mean activity concentration (Bq/mL) and activity (Bq) were recorded for each mouse. The measured activity was decay-corrected to the time at the start of the acquisition (T0).
To account for physical decay of 11C as needed for dosimetry calculations, the effective activity concentration was obtained as follows:
where the physical λ of 11C is calculated as ln(2)/T1/2 (T1/2 is 20.33 h for 11C).
The effective activity concentrations were divided by the injected activities in each mouse to obtain the fraction of injected activity per cubic centimeter. From the data for the 4 mice, this fraction was calculated, multiplied by the mouse organ volume based on the 4-dimensional mouse whole-body phantom (19), and then divided by the mouse organ mass for the 25-g reference mouse model (19) to obtain the average fraction of injected activity per gram for each organ.
The following equation was used to convert mouse activity data to human activity data:
where FIA is the fraction of injected activity (activity inside the syringe before injection), FID is the fraction of injected dose (effective dose administered), OMH is the human organ mass (using organ masses from OLINDA EXM), TBMM is the mouse total-body mass (set to 19.7 g), and TBMH is the human total-body mass (set to 73.7 kg, from the OLINDA EXM compilation of organ masses).
The human total heart mass (tissue plus blood in chambers, 620 g for women and 840 g for men) was used when converting mouse heart time–activity data to human heart time–activity data. The human bladder time–activity data were obtained using both human bladder tissue only (bladder wall, 35.90 g for women and 47.60 g for men) and bladder plus contents (bladder contents, 200 g for both men and women) (20).
The activity in the remainder of the body for the mouse was calculated by subtracting the measured whole-body (whole field of view) activity from the sum of the activity data of the measured organs. For each measured time-point in the dynamic PET data, the ratio of the body-remainder activity to the whole-body activity was calculated for the average mouse time–activity data. The calculated human organ time–activity data were summed and multiplied by the ratio of the body-remainder activity to the whole-body activity derived from the mouse data in order to estimate body-remainder activity in humans.
The MIRD Committee S-value methodology (18), as implemented in the OLINDA/EXM software package (17), was used to perform the absorbed dose calculations. The S-value methodology provides the absorbed dose to a target tissue as the sum of dose contributions from all radioactivity-containing (source) tissues. The S value is usually obtained by Monte Carlo simulation based on a standard or reference geometry of the patient and the decay characteristics and emission spectrum of the radionuclide. S values for a number of source and target tissue combinations and a large number of radionuclides have been previously incorporated into OLINDA/EXM. Once the absorbed dose for a series of organs is obtained, the effective dose can be calculated using tissue-weighting factors.
Time–activity graphs were obtained for the following human organs (both male and female) based on the provided murine data: brain, heart, lungs, liver, muscle, large intestine, bladder, kidneys, and bone marrow. These graphs were fit using a monoexponential function and were integrated from 0 to infinity to obtain the time-integrated activity coefficient, or residence time.
Adult female and male phantoms were used, and absorbed-dose calculations were performed for 11C using the calculated time-integrated activity coefficients for the given source organs as input into OLINDA/EXM. The absorbed dose to the urinary bladder was estimated using the bladder model as implemented in OLINDA/EXM (17), with a biologic half-life of 1.6 h for PABA and a bladder voiding period of 1 h.
First-in-Humans Study
Three healthy volunteers (2 male, 1 female) at least 18 y old (age range, 23–30 y) were recruited from an ongoing first-in-humans 11C-PABA PET study at the Johns Hopkins Hospital (Table 1). The Johns Hopkins Institutional Review Board approved the study, and all subjects gave written informed consent. The prestudy evaluation included a medical history, a physical examination with vital signs, and laboratory tests (a comprehensive metabolic panel, including alkaline phosphatase, total bilirubin, liver transaminase levels, and renal function [blood urea nitrogen and creatinine]). The eligibility criterion was a laboratory evaluation showing normal liver function within 28 d before enrollment. Female subjects were screened for pregnancy and excluded if pregnant or lactating. Other exclusion criteria included subjects with hypertension, diabetes mellitus, a body mass index lower than 18.5 kg/m2 or higher than 30 kg/m2, a family history of renal disease, or a urinary tract infection in the prior 6 mo. Subjects who had been treated with an investigational drug, an investigational biologic, or an investigational therapeutic device within 30 d before radiotracer administration were also excluded.
Characteristics of Human Subjects
The subjects were injected with 11C-PABA (mean administered activity, 680.1 ± 7.8 MBq [range, 671.2–685.6 MBq]; mean administered mass, 593.3 ± 142.9 ng [range, 470–750 ng]), after which a 30-min dynamic single-bed-position PET scan was obtained on a Biograph mCT 128-slice PET/CT device (Siemens Healthineers) operating in 3-dimensional emission mode. The subjects were positioned supine with their arms above their head, and a scout scan encompassing the abdomen was used to locate the kidneys for the PET acquisition. The acquisition area included both kidneys at a single bed position. A 30-min list-mode acquisition was started just before radiotracer injection. The reconstructed images consisted of 10 frames for 5 s, 20 frames for 15 s, and 25 frames for 60 s. A low-dose CT scan was subsequently acquired for anatomic localization and attenuation correction. The subjects were asked to empty their bladder before injection and after the imaging was completed. To perform the quantitative analysis, 7 volumes of interest were manually drawn using the CT images as a reference as described for the preclinical experiments, plus the abdominal aorta. The bladder was excluded from the acquisition field. Renal perfusion was determined by visual assessment of the 11C-PABA transit through the abdominal aorta after the injection. The images were analyzed with Mirada XD (Mirada Medical) and PMOD (PMOD Technologies) for dynamic quantification. Amide, version 1.0.4, and Imager-4D (21) were used for data visualization. The subjects were followed up by telephone 25 d after imaging to assess for any side effects or other issues.
Statistical Analysis
For the animal imaging studies, data are represented on a linear scale as the average of the percentage injected dose per cubic centimeter ± SD. Data for postmortem biodistribution are represented as percentage injected dose per gram of tissue. For human imaging studies, data are represented on a linear scale as average SUV ± SD. All statistical analyses were performed using Prism, version 8 (GraphPad Software).
RESULTS
Animal Studies
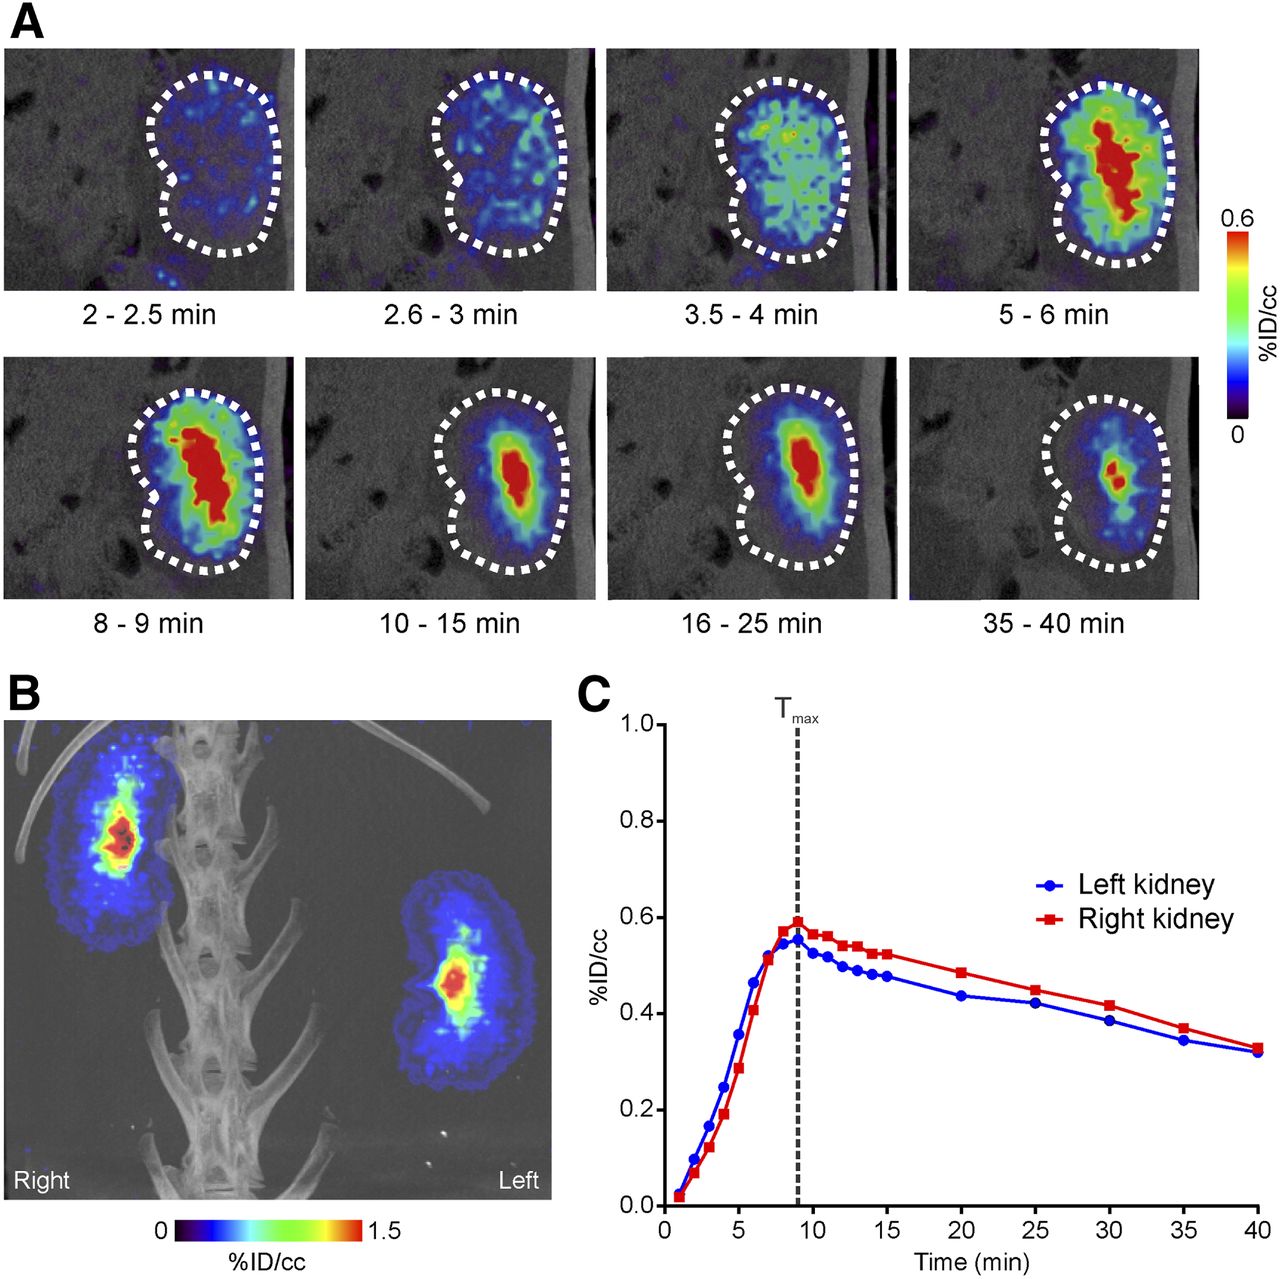
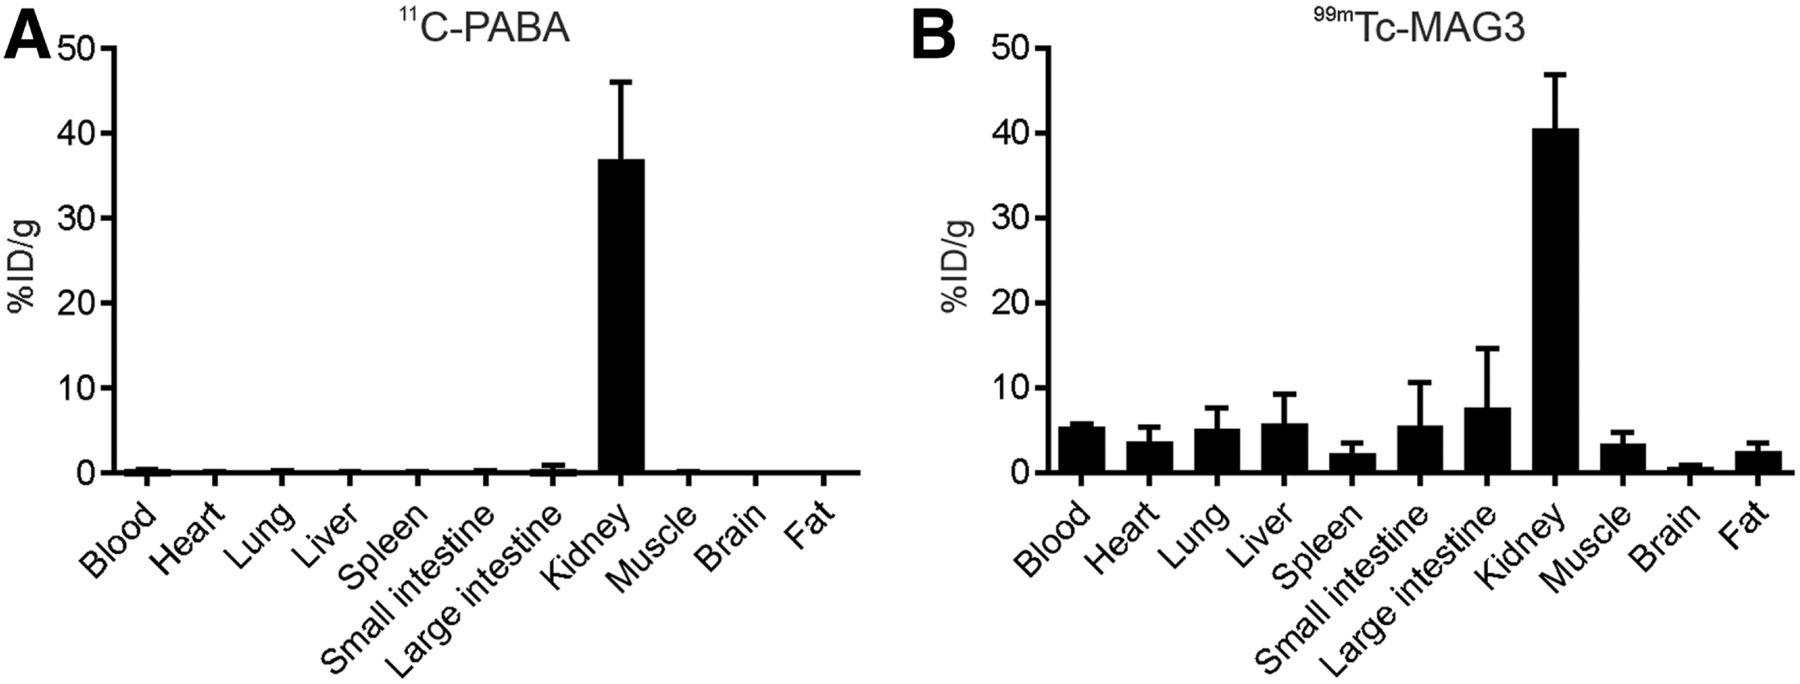
Whole-body dynamic PET of rats showed that 11C-PABA collected rapidly in the kidneys and was eliminated through the bladder. Minimal signal was observed in other organs. Visual assessment of the PET signal showed renal perfusion, followed by a gradual accumulation of the radiotracer in the renal cortex and a subsequent transition of activity into the collecting system (Figs. 1A and 1B). The time–activity curve (renogram) demonstrated a Tmax of 8.5 ± 3.9 min in both kidneys, followed by a rapid transit into the pelvicalyceal system, with a T1/2 of 32.2 ± 13.1 min. The differential uptake was 49% ± 3.1% and 50.9% ± 3.1% in the right and left kidneys, respectively. As would be predicted, the excretion phase correlated with increased uptake in the bladder (Fig. 1C). The postmortem tissue biodistribution of 11C-PABA and 99mTc-MAG3 was directly compared by measuring organ-associated radioactivity 30 min after simultaneous injection of both radiotracers in the same animals (Fig. 2). Uptake in background tissue was lower for 11C-PABA than for 99mTc-MAG3.

11C-PABA PET/CT renal imaging in healthy rats. (A) Coronal dynamic 11C-PABA PET images of right kidney from representative rat show rapid cortical uptake after 2 min, followed by rapid clearance through pelvicalyceal system. (B) Maximum-intensity-projection 11C-PABA PET/CT images show abdominal aorta and iliac arteries 60 s after injection, as well as high activity in bladder (Bl) after 20 min, with low background signal in other tissues. (C) Average 11C-PABA time–activity curves for kidneys and bladder. Data are mean (solid lines) and SD (shaded areas) (n = 4). %ID = percentage injected dose.

11C-PABA and 99mTc-MAG3 tissue biodistribution in rats. Healthy rats received simultaneous intravenous injections of 11C-PABA and 99mTc-MAG3 and were killed 30 min afterward. 99mTc-MAG3 counts were determined 2 h after 11C-PABA counts, when signal from 11C (physical half-life, 20 min) would have completely decayed. (A) Biodistribution of 11C-PABA was primarily within kidneys, with very low activity in all other measured organs. (B) Conversely, biodistribution of 99mTc-MAG3 had higher background activity. Data are mean and SD (n = 4).
In healthy rabbits, 11C-PABA PET also demonstrated high radiotracer excretion through the kidneys and low uptake in background organs. Visual assessment of the renal perfusion showed an accumulation of radiotracer in the cortex starting 3 min after injection, with a later transition into the pelvicalyceal system (Figs. 3A and 3B). Time–activity curves demonstrated a Tmax of 8.2 ± 1.3, a T1/2 of 36.5 ± 11.6 min, and a relative renal uptake of 50.7% ± 1.8% and 49.3% ± 1.8% for the right and left kidneys, respectively (Fig. 3C).
11C-PABA PET/CT renal imaging in healthy rabbits. (A) Coronal dynamic 11C-PABA PET/CT images of right kidney of representative rabbit show rapid delineation of renal cortex and then accumulation in pelvicalyceal system. (B) Maximum-intensity-projection 11C-PABA PET/CT image at 20 min shows similar uptake in left and right kidneys, with low background signal in other organs. (C) Average 11C-PABA time–activity curves for kidneys. Data are mean (n = 2). %ID = percentage injected dose.
Dosimetry
The calculated time-integrated activity coefficients are shown in Supplemental Table 1. The time-integrated activity coefficients were longest for the bladder wall and contents. The urinary bladder, followed by the kidneys and lungs, received the highest absorbed dose (Supplemental Fig. 1; Supplemental Table 2). The absorbed dose for the urinary bladder wall was 0.05 ± 0.01 mGy/MBq. The effective dose was estimated to be 0.0039 ± 0.0006 mSv/MBq.
First-in-Humans Study
There were no adverse or clinically detectable pharmacologic effects in any human subject. All had a normal glomerular filtration rate (Table 1). No renal anatomic abnormalities were found. The dynamic PET maximum-intensity-projection acquisition for a representative subject is shown in Supplemental Video 1. 11C-PABA rapidly localized to the kidneys, with minimal signal in other surrounding structures in the same field. The abdominal aorta and renal arteries were detected starting 20 s after injection, with a Tmax of 24.1 ± 7.6 s (Fig. 4A). The activity gradually accumulated in the renal cortex, reaching a maximal parenchymal uptake at 3.0 ± 0.4 min (Fig. 4B). The Tmax for the right and left renal pelvises was 9.4 ± 5.4 min (Supplemental Fig. 2). The T1/2 for the renal cortex was 23.3 ± 7.5 min, and the average cortical uptake over all time points was 50.9% ± 4.3% and 49.06% ± 4.3% in the right and left kidneys, respectively.
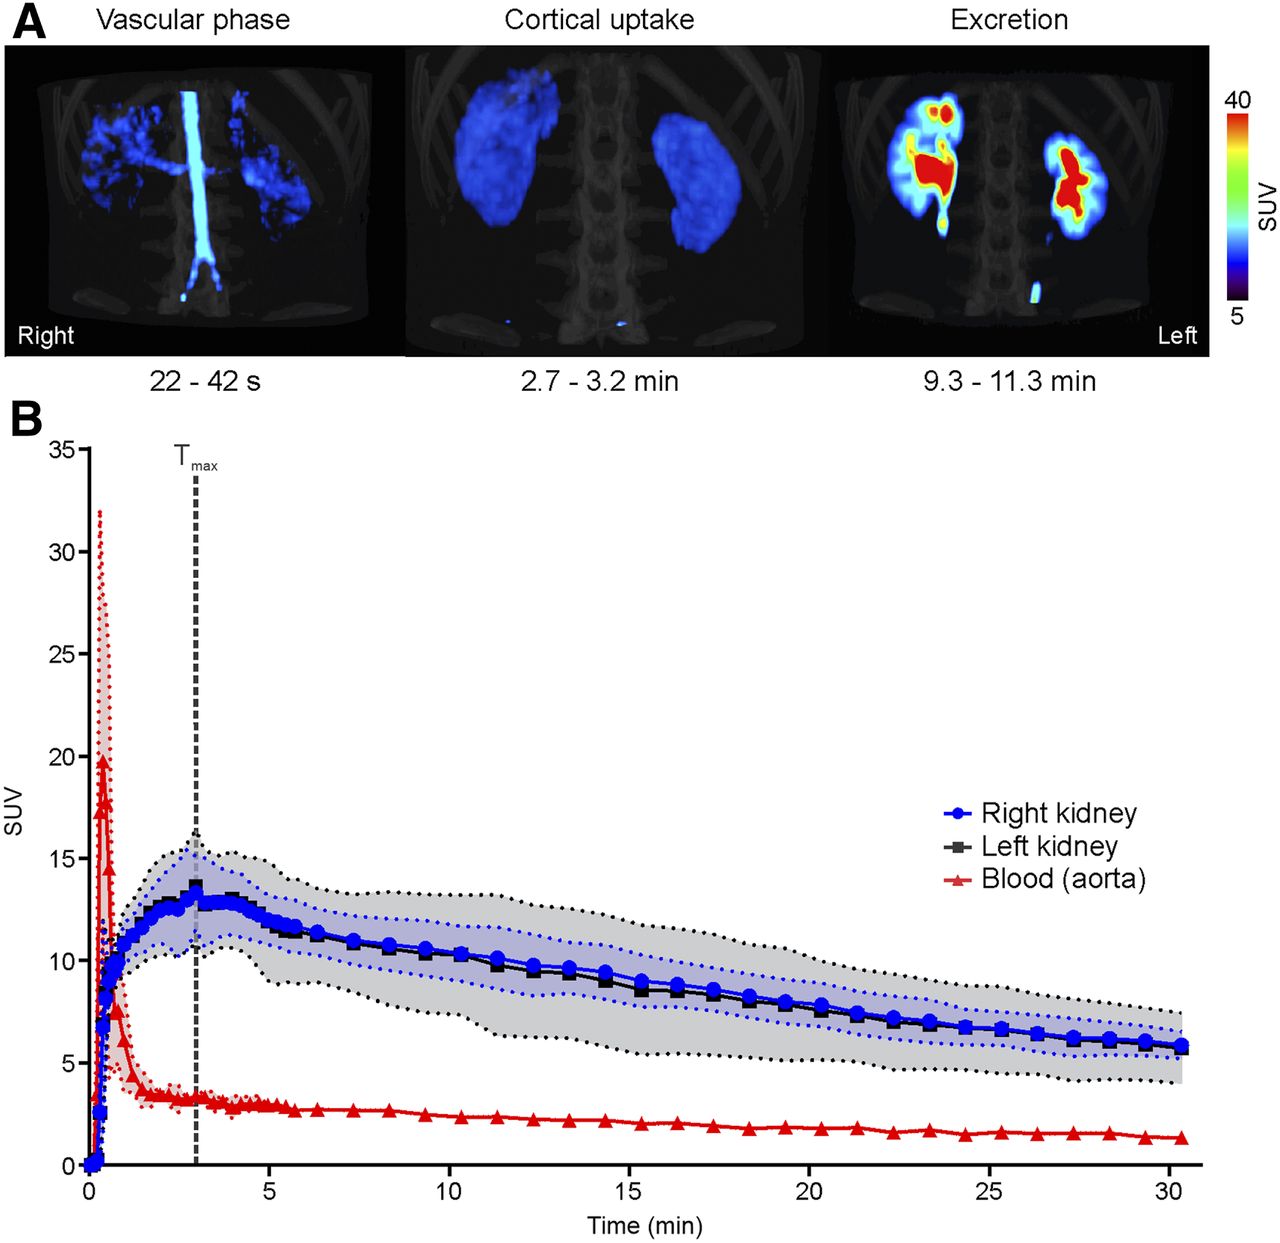
11C-PABA PET renal imaging in healthy human subjects. (A) Maximum-intensity-projection 11C-PABA PET/CT images of representative subject. Vascular phase is observed starting 22 s after injection, demonstrating renal perfusion. Cortical uptake phase is evident within 2.7 and 3.2 min, with maximal parenchymal uptake in renal cortex. Excretory phase is seen after 9 min, indicating maximal uptake in pelvicalyceal system. (B) Average 11C-PABA time–activity curves for kidneys and blood (aorta). Data are mean (solid lines) and SD (shaded areas) (n = 3).
DISCUSSION
The use of PET for renal imaging is an emerging field that has several key advantages over single-photon imaging in the evaluation of structural abnormalities and in quantification of function (2,6). Among these advantages are better spatiotemporal resolution and absolute camera-based quantification (4). In addition, time-of-flight technology and improved reconstruction algorithms may allow for a decrease in the amount of injected radioactivity. Moreover, PET enables a precise elimination of background activity from surrounding organs (e.g., from the major vessels), and threshold-based approaches can be used to define the activity in the cortex and renal collecting system. Conversely, for renal scintigraphy as opposed to PET, volumes of interest normally cover the entire kidneys to generate a renogram (4). Taken together, these advantages of PET radiopharmaceuticals for renal functional assessment might constitute a clinical benefit. For instance, common γ-emitting agents may underestimate the relative functional performance of one of the kidneys (e.g., malrotation of a single kidney, which can affect the ability to donate a kidney for transplantation) (22). Other clinical applications may include monitoring of therapy-induced renal remodeling, such as after abdominal radiation therapy (23). Renal parenchymal loss can be either diffuse or focal and can occur even at low doses, such as 10 Gy. PET-derived volumes of interest that cover areas at risk in the renal cortex or medulla may allow monitoring of renal injury after radiation or may even have predictive potential before therapy. Given these benefits, several PET radiotracers have shown promise for renal imaging (2,7). With the benefit of a longer physical half-life, 18F-fluorodeoxysorbitol has also been recently evaluated as a potential renal imaging agent (as a replacement for 99mTc-diethylenetriaminepentaacetic acid) in healthy and diseased rats and in healthy humans (24–26). Compared with 99mTc-diethylenetriaminepentaacetic acid, the tubular-function–reflecting radiotracer 99mTc-MAG3 has a more efficient extraction fraction (twice that of 99mTc-diethylenetriaminepentaacetic acid), which renders it the preferred imaging agent in patients with suspected obstruction and impaired renal function (27). Not surprisingly, 99mTc-MAG3 is the radiotracer of choice in clinical routine and is used in approximately 70% of the scans in the United States (27). However, recent years have witnessed an expanded use of PET, given its advantages over SPECT (28,29). Thus, PET agents with the potential to replace 99mTc-MAG3 are needed.
The exclusive renal excretion of PABA has been previously used to assess 24-h urine tests. Although PABA is metabolized by the liver, all its metabolites are also renally excreted (9,10). In fact, one of its main metabolites, para-aminohippuric acid, has been used as a gold standard to measure effective renal plasma flow because of its high renal tubular secretion, as well as active glomerular filtration once it enters the kidneys (30). Radiolabeling PABA with 11C provides high-quality dynamic images of the kidneys while reducing the radiation exposure due to the short biologic and physical half-lives of PABA and 11C, respectively, enabling use in young children. 11C-PABA PET renal imaging in 2 different mammalian models (rats and rabbits) showed rapid localization of the radiotracer in the kidneys with low background signal from other organs. A murine data-based human dosimetry analysis of 11C-PABA showed an effective dose 1.6 times lower than that of 99mTc-MAG3 (1). On the basis of these results, we performed a first-in-humans 11C-PABA PET study on 3 healthy subjects. The near-perfect split renal function observed in the small-animal models and human subjects without known underlying renal disease suggests the potential of 11C-PABA to detect unilateral renal disease or obstruction.
Although clinical implementation of 11C-PABA would be limited to locations with an on-site cyclotron, the intrinsic low radiation exposure of 11C-PABA is particularly well suited to pediatric populations. However, further preclinical and clinical studies are required to understand the potential use of this radiotracer in specific conditions. The present feasibility study has limitations. Patients were not encouraged to drink water before the PET scan, and a specific amount of water was not administered during the study. Further, although the first-in-humans results are encouraging, a larger number of subjects is needed to confirm these preliminary findings.
CONCLUSION
We describe a novel 11C-based tracer used for PET renal functional imaging. In healthy rats, rabbits, and humans, 11C-PABA demonstrated rapid renal excretion with a very low background signal. These results suggest that 11C-PABA might be used as an imaging radiotracer to evaluate renal kinetics and anatomy, providing high-quality images of the kidneys with low radiation exposure compared with the standard of care (SPECT and planar imaging).
DISCLOSURE
Alvaro Ordonez and Sanjay Jain are coinventors on a pending patent application (US2019050529, covering 11C-PABA for renal imaging) filed by Johns Hopkins University. This work was funded by the National Institutes of Health (Director’s Transformative Research Award R01-EB020539, R01-HL131829, and R01-EB025985 to Sanjay Jain), and the Department of Defense’s Congressionally Directed Medical Research Programs (PR-171338P1 to Sanjay Jain). Rudolf Werner was funded by the German Research Foundation (DFG) through the Clinician-Scientist Program PRACTIS. No other potential conflict of interest relevant to this article was reported.
KEY POINTS
QUESTION: What is the value of using 11C-PABA for PET renal imaging?
PERTINENT FINDINGS: In healthy rats and rabbits, dynamic PET demonstrated a rapid accumulation of 11C-PABA in the renal cortex, followed by rapid excretion through the pelvicalyceal system. In humans, 11C-PABA PET was safe and well tolerated. The cortex was delineated on PET, and the activity gradually transited to the medulla and then pelvis with high spatiotemporal resolution.
IMPLICATIONS FOR PATIENT CARE: These findings argue in favor of using 11C-PABA as a novel imaging radiotracer to evaluate renal kinetics and anatomy, providing high-quality images of the kidneys with low radiation exposure compared with the standard of care (SPECT and planar imaging).
Acknowledgments
We thank the subjects who participated in the study. Additionally, we thank Allen Chen, Rehab Abdallah, and Corina Voicu (Johns Hopkins Hospitals) for coordinating the human imaging studies and assisting with the image protocol and acquisition.
Footnotes
↵* Contributed equally to this work.
Published online Mar. 20, 2020.
- © 2020 by the Society of Nuclear Medicine and Molecular Imaging.
REFERENCES
- Received for publication November 15, 2019.
- Accepted for publication March 9, 2020.


Jump to section
Related Articles
Cited By...
- No citing articles found.