


Abstract
The SET-3000 G/X (clinical tomograph with high resolution and a large axial field of view) is a 3-dimensional (3D) (only) dedicated PET camera with germanium oxyorthosilicate (GSO) and bismuth germanate (BGO) scintillators. The main characteristic of the SET-3000 G/X PET scanner is 3D continuous-emission and spiral-transmission (CEST) scanning, yielding a reduction in whole-body scan time. We evaluated the physical performance of the SET-3000 G/X PET scanner with the National Electrical Manufacturers Association (NEMA) NU 2-2001 standard. Methods: A GSO 3D emission scanner is combined with a BGO transmission scanner separated axially by a lead shield. In the GSO scanner, small and thick scintillators (2.45 × 5.1 × 30 mm3) are arranged in small blocks (23.1 × 52 mm) to achieve high resolution and a high counting rate. The detector ring has a large solid angle with a diameter of 664 mm and an axial coverage of 260 mm (50 rings). The transmission scanner consists of BGO block detectors with a diameter of 798 mm and an axial width of 23.1 mm and is equipped with a rotating 137Cs point source of 740 MBq and a tungsten collimator. The low- and high-energy thresholds are set to 400 and 700 keV, respectively, in the emission system. The coincidence time window is set to 6 ns. In CEST acquisition, the patient couch moves continuously through the emission and transmission scanners in a 1-way motion. Emission coincidence data are acquired in the histogram mode with on-the-fly Fourier rebinning, and transmission single data are acquired with emission contamination correction. Results: With the NEMA NU 2-2001 standard, the main performance results were as follows: the average (radial and tangential) transverse and axial spatial resolutions (full width at half maximum) at 1 cm and at 10 cm off axis were 3.49 and 5.04 mm and 4.48 and 5.40 mm, respectively; the average sensitivity for the 2 radial positions (0 and 10 cm) was 20.71 cps/kBq; the scatter fraction was 50%; the peak noise equivalent count rate was 62.3 kcps at 9.8 kBq/mL; and the peak random rate was 542.1 kcps at 37.6 kBq/mL. Conclusion: The new integrated SET-3000 G/X PET scanner has good overall performance, including high resolution and sensitivity, and has the potential of reducing whole-body acquisition time to less than 10 min while improving small-lesion detectability with a low radiation dose.
Early and accurate detection of tumors with 18F-FDG needs a high-performance PET camera that can provide images with high spatial resolution and a high signal-to-noise ratio. In Japan, where cancer screening with 18F-FDG PET of symptom-free subjects is gaining popularity (1), PET with a low dose of 18F-FDG and high throughput is desirable. Recently, a new high-resolution and high-sensitivity PET camera (SET-3000 G/X) (2) was designed by Shimadzu Corp. and was installed at the Institute of Biomedical Research and Innovation for collaborative performance evaluation and parameter optimization. This PET camera features a new technique called continuous emission and spiral transmission (CEST), which allows high-throughput scanning with transmission-based attenuation correction and the administration of a low radiation dose. In this study, the basic performance of the PET camera was investigated with the National Electrical Manufacturers Association (NEMA) NU 2-2001 standard (3) for PET performance measurement. The clinical performance also was tested for a patient with a tumor and was compared with that of the ECAT EXACT HR+ PET camera (Siemens/CTI) (4,5).
MATERIALS AND METHODS
Camera Design
The details of the system are described in a previous report (2) and are summarized in Table 1. In brief, the PET camera uses cylindrically arranged germanium oxyorthosilicate (GSO) [Gd2SiO5(Ce)] crystals for dedicated 3-dimensional (3D) emission scanning and a ring of bismuth germanate (BGO) (Bi4Ge3O12) crystals with a 137Cs point source for transmission scanning; these scanners are coaxially attached and separated by a lead shield for CEST scanning (Fig. 1). The 137Cs point source is collimated axially and transaxially with a tungsten collimator. The rotation speed of the source is 3 s per rotation. Because the point source is highly collimated axially, the background coincidence rate of the emission scanner from the transmission source is considered to be negligible. In fact, the background single rate of the emission scanner from the transmission source is less than 500 cps. Axial collimation also decreases the scatter fraction of the transmission data and provides a more accurate attenuation value. The emission part and the transmission part are separated by a lead shield with a thickness of 32.5 mm to minimize cross contamination. The contamination from the emission detector to the transmission detector is corrected for by masking and measuring the background counts of the off-collimation detectors. Over the clinical range of activity, the attenuation coefficient obtained for a cylindric phantom from transmission data corrected for emission contamination was 0.095 ± 0.02 cm−1 (mean ± SD) and was not different from the value for a cold phantom. No significant increase in image noise was observed with this correction method (2). This arrangement allows simultaneous emission scanning and transmission scanning with a high-flux transmission source to reduce total scanning time, a goal that is usually difficult when the same detector is used for both purposes. Because there is no transmission source within the emission scanner, the diameter of the emission detector is as small as 664 mm, a feature that increases the solid angle and sensitivity, together with a long axial field of view (FOV) (260 mm). The GSO scintillator enables a small crystal size for high spatial resolution while maintaining scintillating light output. GSO has a high counting rate capability that allows 3D data acquisition with a large solid angle.
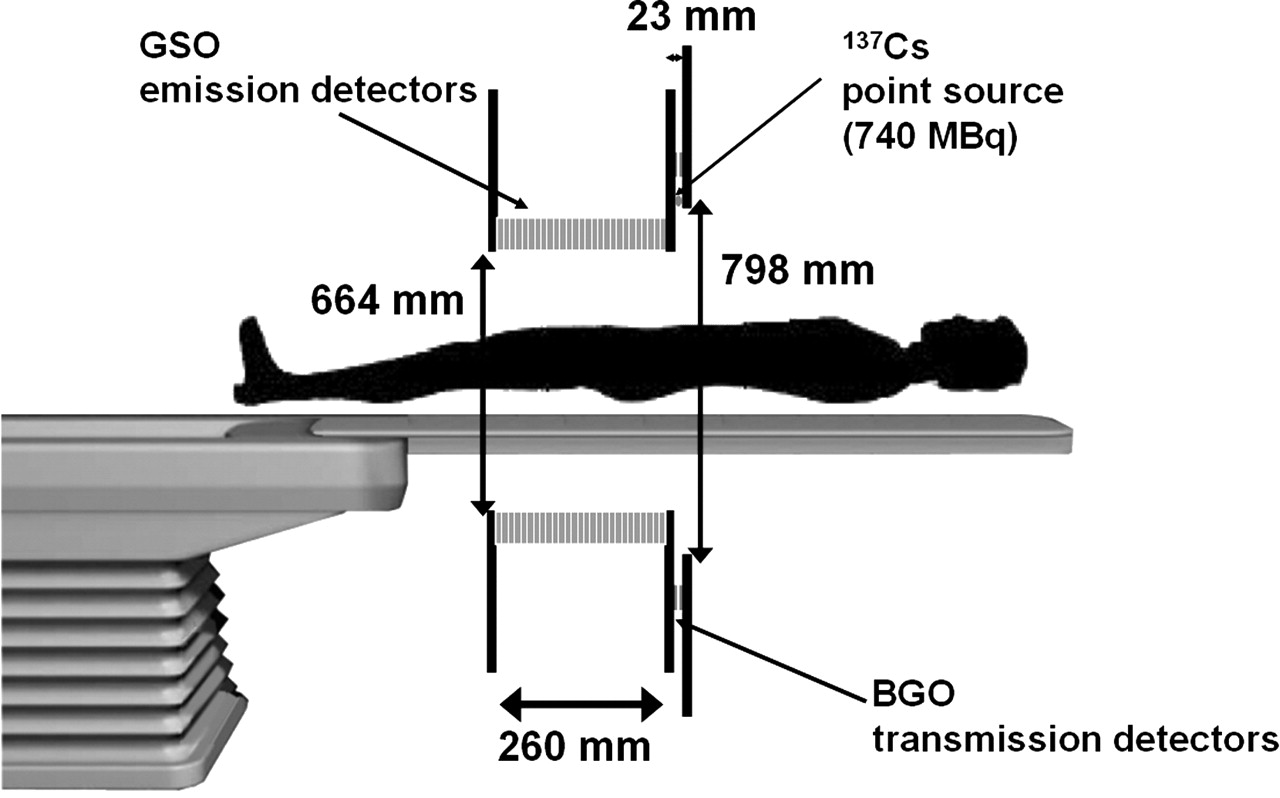
Schematic configuration of SET-3000 G/X scanner.
Main Specifications and Characteristics of SET-3000 G/X PET Scanner
Phantoms
Performance measurements for the SET-3000 G/X scanner were obtained in accordance with the procedure outlined in the NEMA NU 2-2001 standard (3). The NEMA NU 2-2001 performance tests require 3 sets of phantoms. The first one is an International Electrotechnical Commission body phantom set, which consists of torso cavity, removable lung insert, and 6 spheres (10–37 mm in inner diameter [ID]). All can be filled. The second one is a scatter phantom set, which includes a solid circular cylinder composed of polyethylene with a specific gravity of 0.96, with an outer diameter of 200 mm, an overall length of 700 mm, and a plastic tube that is 750 mm long and has an ID of 3.2 mm to hold the source activity. The third one is a sensitivity phantom set, which consists of 5 concentric aluminum tubes (each 700 mm long) and a 1.4-mL chloroethylene tube that can be filled and that is inserted into the center sleeve. The NEMA phantoms were manufactured by ITOI Resin Factory Corp. Detailed information and specifications for the NEMA NU 2-2001 phantoms can be found at http://www.itoijyushi.com (in Japanese). As specified by the NEMA NU 2-2001 standard, all measurements were obtained with the 18F isotope.
Performance Measurements
Spatial Resolution.
Spatial resolution was measured with a point source of 18F in a glass capillary tube with a 1-mm ID and a 2-mm outer diameter held on foam polystyrene. The axial length was less than 1 mm. The source was positioned at 1 cm and at 10 cm off center of the FOV and at the center and 6.5 cm (one fourth the axial FOV) off center along the axis. More than 100,000 counts were acquired for each source position. Sinograms were rebinned axially with the Fourier rebinning algorithm (6); this step was followed by 2-dimensional filtered backprojection (FBP) reconstruction. The full width at half maximum (FWHM) was obtained in the transverse and sagittal images.
Counting Rate and Scatter.
The NEMA solid cylindric phantom with a 20-cm diameter and a 70-cm length was made of polyethylene and had a linear hole at 4.5 cm off center. A plastic tube with a 75-cm length and filled with 863.2 MBq of 18F solution was placed in the hole. The phantom was placed at the center of the FOV, and the data were acquired at 90 time points (50 frames of 800 s and 40 frames of 1,600 s) up to 29 h (16 half-lives, to 15.3 kBq, which was 1/56,500 the initial activity). The total count (prompt coincidence) was measured for each frame.
The data were acquired at low counting rates and rebinned with single-slice rebinning (7). The sinogram profile was used to calculate the number of scatter events within a diameter of 24 cm (4 cm larger than the phantom diameter) and the number of true events within a 2-cm radius of the source. The scatter within the peak was estimated by assuming a constant background under the peak, the level of which was determined by averaging the intensities near the edge of the peak (at ±2 cm).
The tail-fitting method with a parabolic function was used to estimate the background (scatter plus random) fraction (background counts divided by total counts) for each acquisition frame (8). The scatter fraction was estimated at a low counting rate with negligible randoms by use of the procedure recommended in the NEMA NU 2-2001 standard. The true coincidence rate was computed for each frame by subtracting from the prompt coincidence the random plus scatter estimated from the sinograms. The random rate was estimated from the above-described background fraction and the scatter fraction. The noise equivalent count (NEC) rate was computed as (true × true)/prompt coincidence.
Sensitivity.
The absolute sensitivity was measured according to the NEMA NU 2-2001 procedure. A 70-cm-long line source with a 3.8-mm ID and filled with 2.3 MBq of 18F solution was scanned with 5 different metal sleeves at the center and 10 cm off center of the FOV. The sensitivity was computed as counts per second per kilobecquerel from the 5 datasets by extrapolating the data to nonattenuation measurements. In the acquisition configuration, the oblique axial coincidence acceptance is up to ±49 planes.
Accuracy of Corrections for Count Losses and Randoms.
The accuracy of corrections for dead-time losses and randoms was evaluated. The counting rate measurement was repeated with dead-time correction by use of the cylindric phantom described above; circular regions of interest (ROIs) with an 18-cm diameter were placed on each slice, the measured activity was evaluated against the actual activity concentration of the phantom, and images were reconstructed with FBP.
Image Quality.
The NEMA image quality phantom simulating a human torso and containing 6 spheres and a lung insert with a 30-mm-diameter cylinder was used. The background in the phantom was filled with water containing an 18F solution (5.3 kBq/mL). Four of the spheres (10-, 13-, 17-, and 22-mm IDs) were filled with 18F at 4 or 8 times the background activity, and the other 2 spheres (28- and 37-mm IDs) were filled with cold water.
The phantom was positioned at the center, together with the scatter and counting rate phantom containing 116 MBq of 18F simulating activity from outside the target and placed in contact at the edge, and scanned for a 100-cm length for 1 h. The data were corrected for attenuation and scatter and reconstructed with the dynamic row-action maximization-likelihood algorithm (DRAMA) (9) with 1 iteration. The scatter correction method used was the convolution subtraction method (10). DRAMA is an iterative algorithm similar to the row-action maximization-likelihood algorithm (RAMLA), but the relaxation parameter is controlled in such a way that the noise propagation from projection data to the reconstructed image is independent of the access order of the input data (subsets) in each cycle of the subiterations. An ROI equal to the size of the sphere was placed over each sphere, and the activity was measured. A 30-mm ROI was placed over the lung insert. The hot contrast recovery was computed as [(measured hot/measured background) − 1]/[(actual hot/actual background) − 1], and the cold contrast was computed as 1 − (measured cold/measured background).
The background variability was measured as the SD divided by the mean of a total of 60 ROIs (12 ROIs and 5 slices) placed over the background area, the ROI size being set in 6 different ways to match the sphere sizes. The accuracy of attenuation and scatter correction was computed as the measured lung insert activity divided by the background activity.
Human Imaging
Whole-Body Scan.
To evaluate the clinical performance of the SET-3000 G/X scanner, human studies were performed. For the whole-body scan, a patient (height, 172.4 cm; weight, 68.1 kg) with a metastatic tumor mass of unknown origin in the right pelvis and with bone and lymph node metastases was injected with 129.4 MBq of 18F-FDG and was scanned with the SET-3000 G/X camera for 95 cm for 10 min starting 97 min after injection in the CEST mode. For comparison, the same patient was scanned with the ECAT EXACT HR+ scanner for 85 cm for 28 min (2-min emission scan and 2-min transmission scan for each of 7 bed positions) starting 57 min after injection. As the ECAT scanner does not use DRAMA, both images were reconstructed with the ordered-subsets expectation maximization algorithm (11) (4 iterations and 8 subsets) after attenuation correction.
Brain Scan.
A healthy volunteer (height, 163.4 cm; weight, 56.6 kg) was injected with 183.1 MBq of 18F-FDG and underwent a 10-min emission scan and a 5-min transmission scan in the static mode. The images were reconstructed by use of FBP with a 4-mm gaussian filter after attenuation correction. Image pixel size was 1.0 mm in a 256 × 256 array.
RESULTS
Spatial Resolution
Table 2 shows the spatial resolution of the SET-3000 GX scanner. The spatial resolution was 3.49 mm FWHM at 1 cm off center of the FOV and was degraded to 3.82–5.14 mm FWHM at 10 cm off center. The axial resolutions were 5.04 mm at 1 cm and 5.40 mm at 10 cm off center.
Measured Spatial Resolution of SET-3000 G/X Scanner
Counting Rate and Scatter
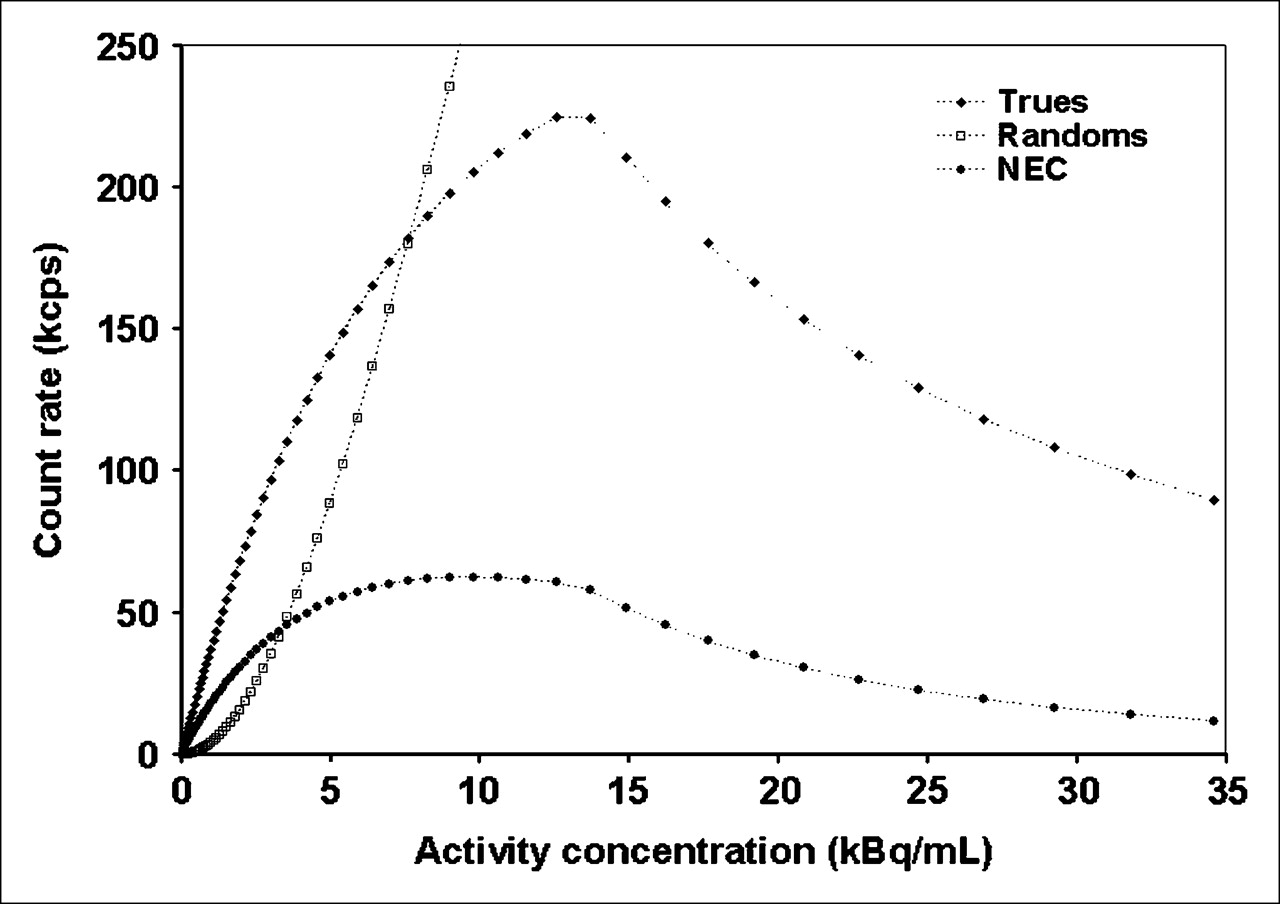
The intrinsic scatter fraction measured at low activity levels was 50%. The peak true counting rate was 224.7 kcps at an activity concentration of 13.7 kBq/mL. The peak NEC rate was 62.3 kcps at 9.8 kBq/mL. The measured counting rates of the trues and randoms and a plot of the NEC rate versus the activity concentration are shown in Figure 2. The random rate reached the true rate at an activity concentration of 7.6 kBq/mL.

Trues, randoms, and NEC rate plotted against activity concentration.
Sensitivity
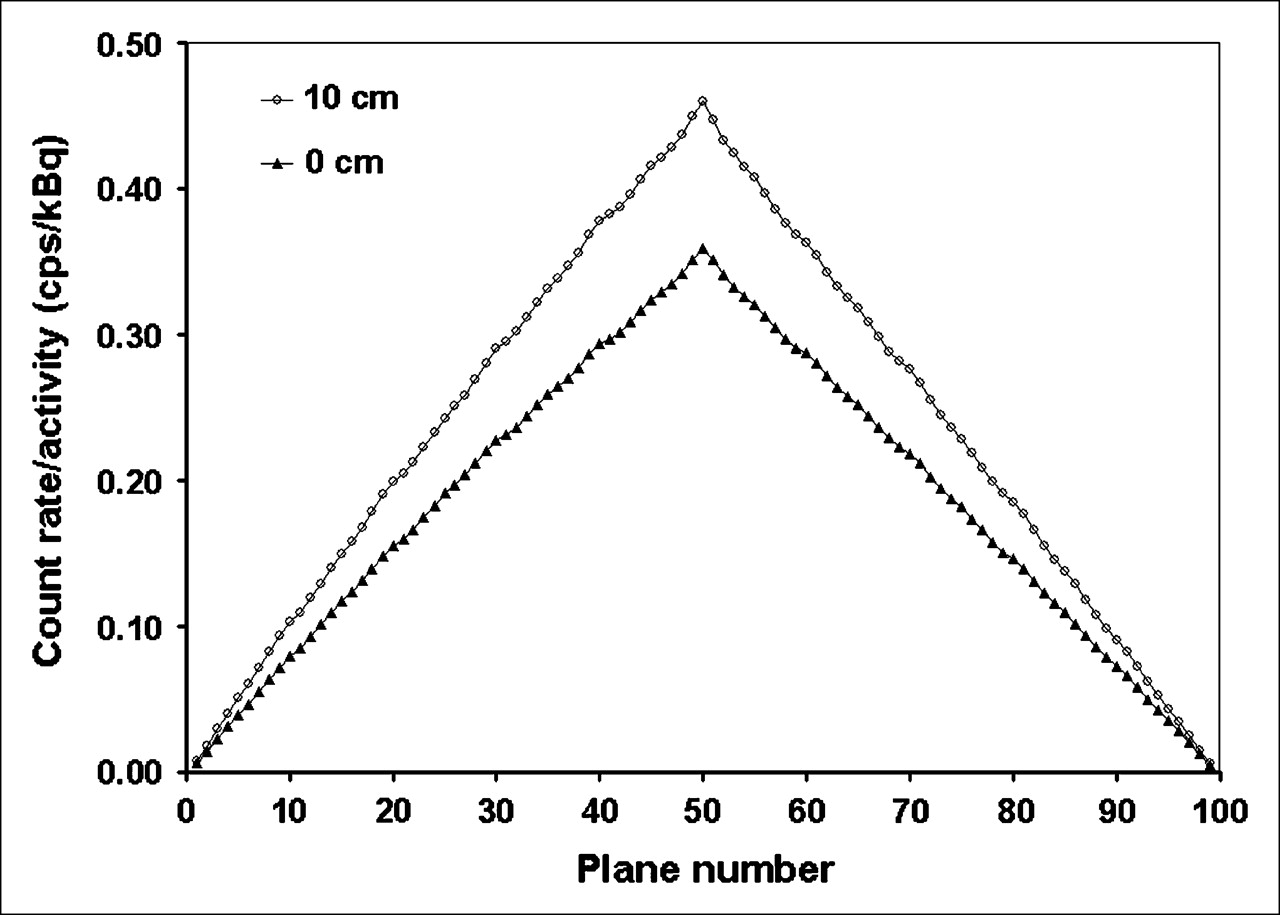
The absolute sensitivities of the SET-3000 G/X scanner were 18.2 cps/kBq with a standard energy window and 23.2 cps/kBq when the line source was placed at the center and at a radial distance of 10 cm. The axial sensitivity profile of the system is shown in Figure 3 for the source at the center of the FOV and at 10 cm off axis.

Axial sensitivity profile at center of FOV and at 10 cm off center.
Accuracy of Corrections for Count Losses and Randoms
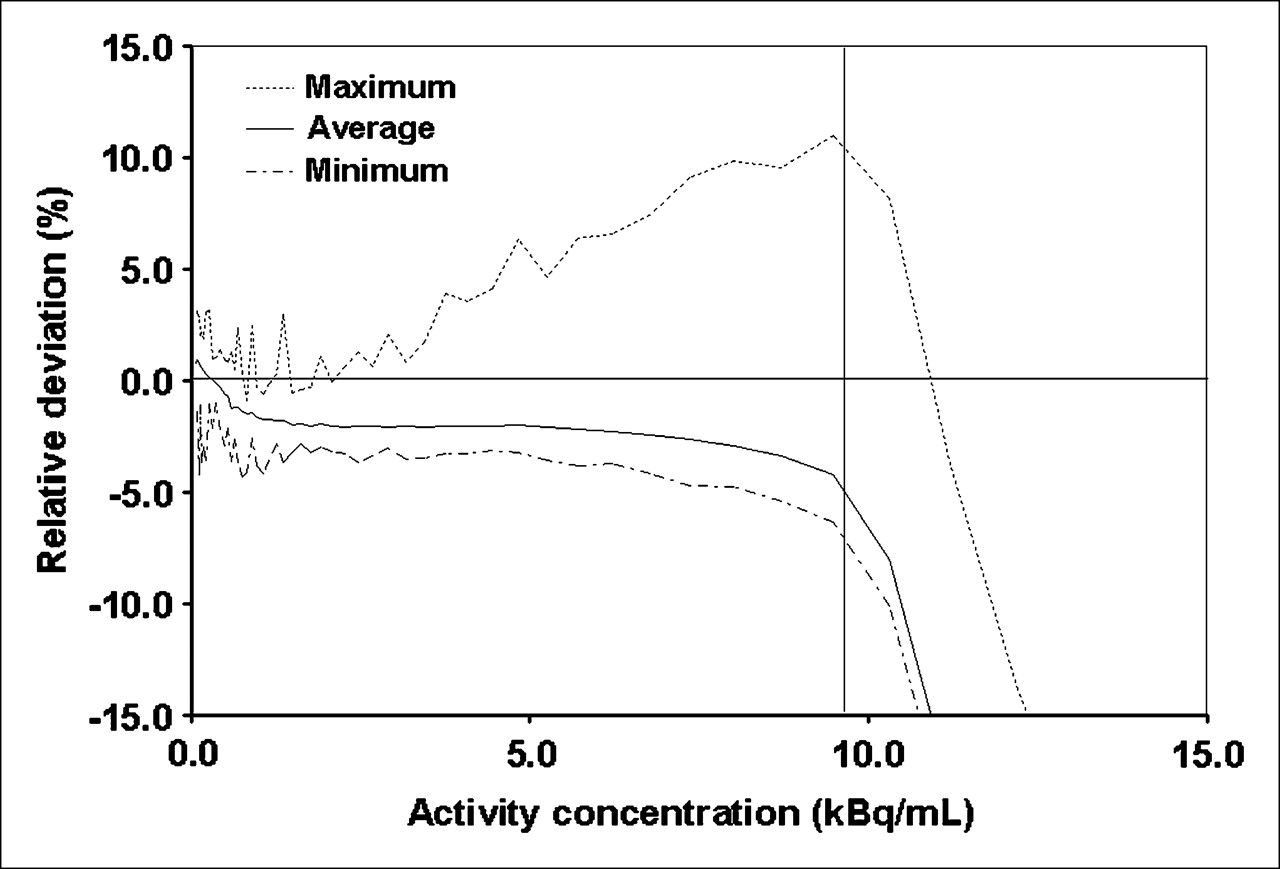
Figure 4 shows the relative percent error in measured image activity for the highest, lowest, and average values among the 99 slices that were plotted against the average effective activity concentration. In the NEMA NU 2-2001 standard, bias is defined as the absolute value of the deviation. Over the wide range of the scanner (at the peak NEC rate and below), the maximum bias was less than 11.0%, and the average bias was less than 4.2%.

Highest and lowest values of relative counting rate error over each slice, in percentages, for each acquisition. Horizontal line indicates 0% bias, and vertical line indicates activity level with peak NEC rate (9.8 kBq/mL). At this activity level, maximum bias was 11.0%.
Image Quality
Table 3 shows the results obtained with the image quality phantom. The measured contrasts of the hot and cold spheres against the background, the average residual attenuation and scatter correction error in the lung region, and background variability are shown. Figure 5 shows images of the image quality phantom at ratios of lesion activity to background activity of 4 and 8.
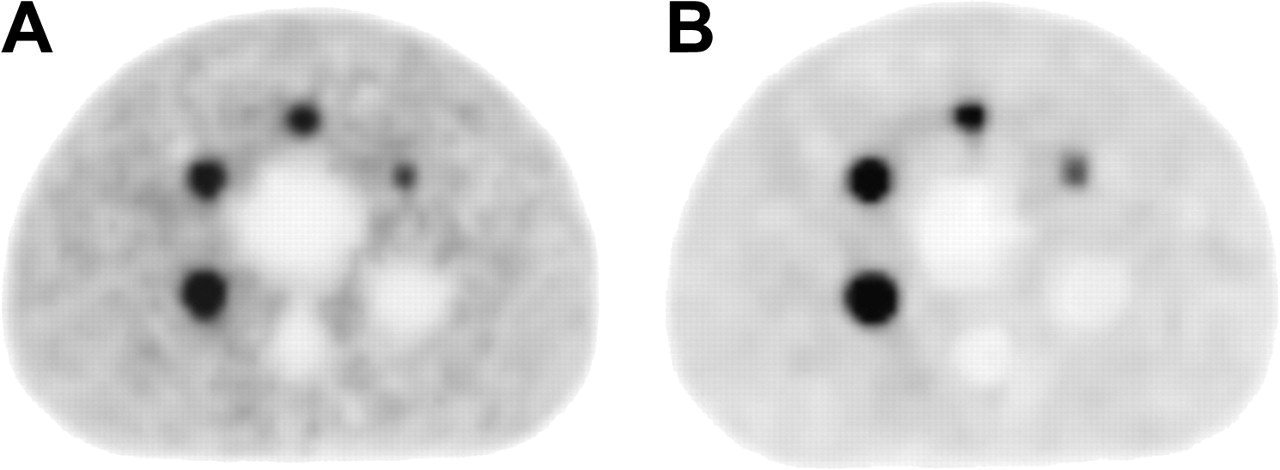
Reconstructed images of image quality phantom at ratios of hot-spot lesion activity to background activity of 4 (A) and 8 (B).
Percent Contrast, Background Variability, and Average Lung Residual of SET-3000 G/X Scanner Measured with Image Quality Phantom
Human Imaging
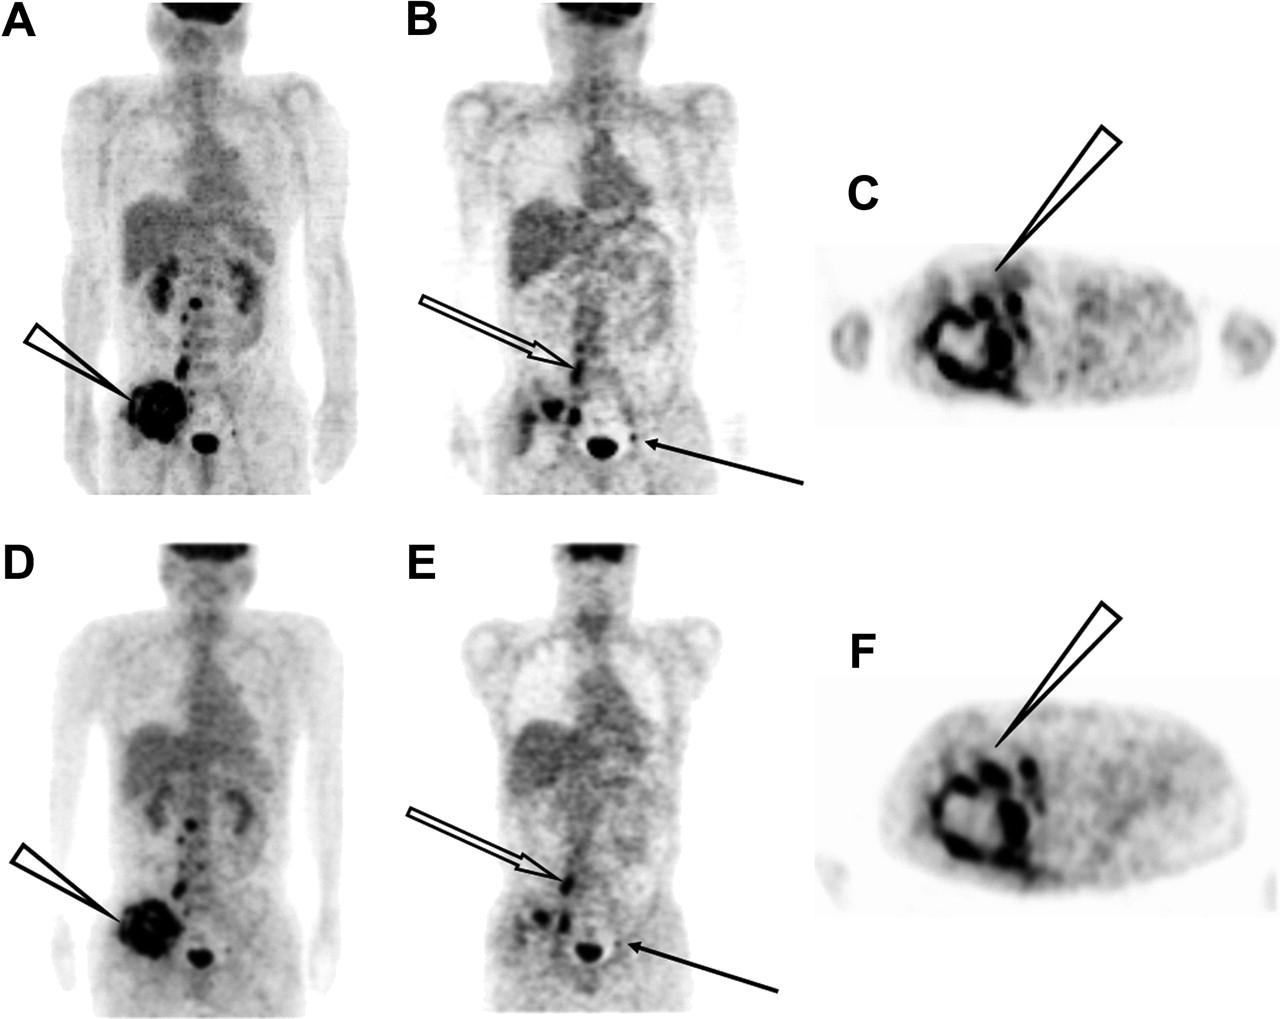
Figure 6 shows the whole-body images obtained for the patient with a tumor by use of the ECAT EXACT HR+ and SET-3000 G/X scanners. Both images revealed high-contrast uptake of 18F-FDG in the pelvic mass, with a complex contour and central necrosis. The bone and lymph node metastases also were demonstrated in both images. The SET-3000 G/X scanner provided images with equivalent diagnostic capability and image quality in one third the scanning time in this study.

PET images obtained with ECAT EXACT HR+ (A–C) and SET-3000 G/X (D–F) scanners. Selected maximum-intensity-projection (A and D), coronal (B and E), and transverse (C and F) slices are shown. Maximum-intensity-projection images show pelvic tumor with high abnormal 18F-FDG uptake (arrowheads). Coronal images show lymph node (solid arrows) and bone (open arrows) metastases. Transverse images show irregular contour and central necrosis of pelvic tumor (arrowheads).
Figure 7 illustrates the brain images obtained for the healthy subject; the images revealed fine gray matter structures of the brain.
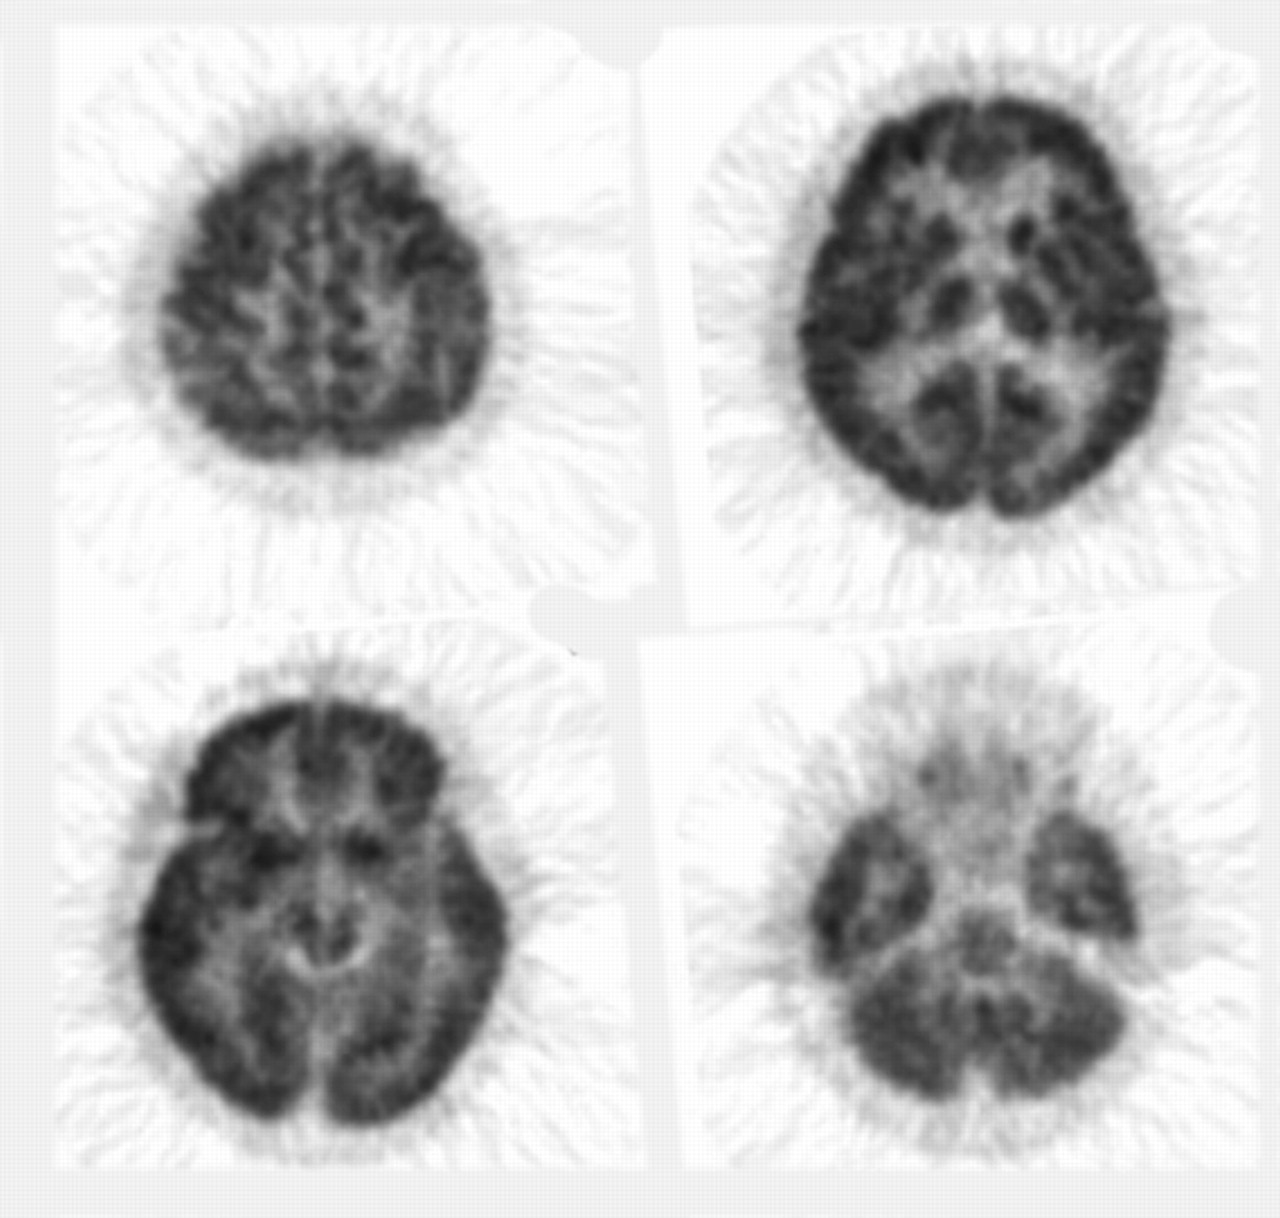
Images obtained for healthy volunteer with SET-3000 G/X scanner. Volunteer was scanned 100 min after injection.
DISCUSSION
Spatial Resolution
The measured spatial resolution near the center of the FOV was 3.5 mm, a value that is the best of all those that have been reported for commercially available whole-body PET cameras for clinical use. This high resolution was realized by reducing the GSO crystal size to 2.45 × 5.1 × 30 mm, and the high light output of GSO enables discrimination of input signals from different crystals. The spatial resolution at 10 cm from the center of the FOV was degraded by 30%, but it was still higher than those of currently available PET cameras (12–14). In this work, the spatial resolution was measured at a stationary bed arrangement according to the NEMA NU 2-2001 standard. Similar results were obtained with the CEST data acquisition mode regardless of the bed velocity (3.62 mm FWHM transverse, 5.47 mm FWHM axially at 1 cm off center, 3.93 mm FWHM tangentially, 5.29 mm FWHM radially, and 6.07 mm FWHM axially at 10 cm off center). Therefore, the CEST mode does not degrade spatial resolution.
Counting Rate Characteristics
The scatter fraction was 50%, a value that was somewhat higher than those of currently available PET cameras (12–14), possibly because of the large solid angle of this PET camera. The energy window was set to 400–600 keV; this window was narrower than that of BGO cameras because it took advantage of the high light output of the GSO scintillator, but it was wider than that of other GSO cameras to maintain sensitivity. Because the scintillation decay of GSO is 60 ns, far shorter than that of BGO, the coincidence time window was set to 6 ns to reduce the random rate and to maintain the high NEC rate. The measured peak NEC rate (62.3 kcps) was comparable to those of currently available PET cameras but was not as high as that expected from the high sensitivity realized by the 3.0-cm-thick GSO, probably because of the high random rate caused by the large solid angle. The peak NEC rate was observed at an activity concentration of 9.8 kBq/mL, a value that was much higher than that in standard clinical 18F-FDG scans. In the typical clinical situation, in which the body soft-tissue (liver) activity concentration is assumed to be 3 kBq/mL, the NEC rate is 41.1 kcps, a value that is sufficiently high to provide images with high signal-to-noise ratios. However, because it is difficult to match the activity concentration of the NEMA NU 2-2001 phantom to that of the human body, the 70-cm cylinder NEC rate curves may not provide exact predictors of the activity concentrations required for peak NEC rates in whole-body imaging. (15).
In any event, the optimum time window and energy window for clinical 18F-FDG whole-body scanning may need further investigation, and the peak NEC rate may be increased.
Sensitivity
The measured sensitivities (18.2 and 23.2 cps/kBq) were more than twice as high as those of currently available PET cameras (12–14). This result was realized by the large solid angle of the detector crystals, with a high packing fraction, and the thick radial crystal size (30 mm). The sensitivity off center of the axial FOV was increased by 30%, possibly because of the small detector diameter. The slice sensitivity was low because of the thin slice. However, the CEST mode allows the use of virtually all lines of response within the detector rings, including those between rings far apart by a maximum of 49 rings, and provides axially homogeneous sensitivity throughout the length of the scan (16).
Accuracy of Corrections for Count Losses and Randoms
The measurement of correction for count losses and randoms shown in Figure 4 indicated consistent negative bias over almost the entire range of activity. This result probably was caused by overestimation and low precision of the reference measurement at the very low activity specified in the NEMA NU 2-2001 protocol, at which a 3D camera may be affected by the environmental background radiation, a situation that is not corrected for in this system. The relative deviation in Figure 4 showed a fairly constant bias of −2.0% to −2.5% in the range of 1–7 kBq/mL, corresponding to the counting rate of the clinical setup. This result suggests that the clinical measurement could be free of significant bias attributable to count losses if calibrated with a phantom with corresponding activity.
Image Quality
The results obtained with the image quality phantom revealed high contrast in hot regions, the measured contrast being higher than those of many other scanners in the 3D mode (5,12,13), suggesting a small partial volume attributable to high spatial resolution. This property may increase the detectability of tumors and improve the quantification of 18F-FDG uptake. The measured activities in cold regions and in the lung insert were comparable to the data obtained with other scanners (5,13), suggesting that correction for attenuation and scatter was done appropriately.
In general, the PET attenuation correction was done with rotating 68Ge rod sources by coincidence detection or with a 137Cs point source by singles detection, the latter being used in the present PET camera. The singles detection method collects many more counts and provides better statistics than the coincidence detection method, and 137Cs is more economical because it has a much longer half-life (30.2 y) than 68Ge (271 d). As the photons from 137Cs have higher energy (662 keV) than annihilation γ-rays (511 keV), the measured attenuation coefficient is corrected appropriately.
The images were reconstructed with DRAMA (9). The noise level determined by visual inspection was low, indicating the effectiveness of this reconstruction algorithm. The measured background variability was higher than those of other scanners despite the higher sensitivity, possibly because the reconstruction parameters for the clinical setup were used. The image noise of RAMLA or DRAMA depends on the reconstruction parameters more than does that of the ordered-subsets expectation maximization algorithm and tends to expand (5,13,14). The detailed parameters of DRAMA need to be optimized for routine clinical situations. Additionally, attenuation and scatter correction procedures need to be optimized further.
Human Imaging
The 10-min whole-body 18F-FDG PET scan of a patient with a tumor provided high-quality images visualizing the main tumor with central necrosis as well as bone and lymph node metastases, demonstrating the practicability of the PET camera for oncology scans (Fig. 6). The images were compared with those obtained for the same patient with a 28-min ECAT EXACT HR+ PET scan. Although an exact comparison is impossible because of a change in the radioactivity distribution during the 2 scans, the 2 scans provided equivalent image quality, indicating that the new PET scanner may have patient throughput approximately 3 times higher than that of the ECAT EXACT HR+ scanner for whole-body oncology imaging.
The brain study in Figure 7 revealed high-quality images that clearly visualized the sulci, gyri, and other gray matter structures. These data suggest the possibility and practicability of the use of the new PET scanner for detecting epileptic foci having local hypometabolism as well as for the differential diagnosis of dementia on the basis of the pattern of radioactivity distribution.
Considerations for PET/CT
PET/CT scanners have the great advantage of providing PET/CT fusion images and are rapidly replacing dedicated PET cameras in the market, and the PET camera described in this article can constitute the PET part of a PET/CT scanner. Most of the currently available PET/CT systems use CT for attenuation correction, although CT-based attenuation correction is subject to artifacts attributable to respiratory-phase differences, contrast media, and metals. Furthermore, in those systems, the CT scan must be acquired for the entire axial length of the PET scan to acquire data for attenuation correction and therefore may include areas for which fusion images are not necessarily requested. Because the PET camera described in this article uses the CEST technique, which provides attenuation data without additional scanning time and with little additional radiation exposure, for the transmission scan, CT is not required for attenuation correction if the PET camera is incorporated into a PET/CT system. Instead, with this new PET/CT system, it will be possible to acquire CT not over the entire axial length but only in areas for which fusion images are requested.
The high spatial resolution of the PET scanner will be valuable for the identification of radioactivity uptake from nearby structures, such as lymph nodes versus arterial plaques or bones, even in a PET/CT system. Because of the possible minor mismatch between PET and CT as a result of patient or organ motion, CT does not totally compensate for the spatial resolution of PET, although there is a trend toward disfavoring the spatial resolution of the PET unit in PET/CT systems.
CONCLUSION
The newly designed SET-3000 G/X PET camera uses the CEST technique. The basic performance evaluated with the NEMA NU 2-2001 standard, together with the human images, indicates that it provides high spatial resolution, high sensitivity, and high throughput with a low radiation dose, properties that would be useful and beneficial in a clinical model. It is suitable for whole-body oncology scanning, including cancer screening, as well as brain and heart scanning. This PET camera also can be incorporated into a PET/CT system in which CT may be acquired not over the entire body but only in areas for which fusing images are requested.
Acknowledgments
We thank Keiji Shimizu, Eiri Minota, Eiji Watanabe, and the cyclotron staff for their expert technical assistance. Part of this study was presented at the European Association of Nuclear Medicine Congress (September 4–8, 2004, Helsinki, Finland).
References
- Received for publication May 23, 2005.
- Accepted for publication September 16, 2005.


Jump to section
Related Articles
Cited By...
- Cerebrospinal Fluid Clearance in Alzheimer Disease Measured with Dynamic PET
- Genetic and Environmental Influences on Regional Brain Uptake of 18F-FDG: A PET Study on Monozygotic and Dizygotic Twins
- Quantitative Analysis of Amyloid Deposition in Alzheimer Disease Using PET and the Radiotracer 11C-AZD2184
- Superiority illusion arises from resting-state brain networks modulated by dopamine
- A Novel PET Index, 18F-FDG-11C-Methionine Uptake Decoupling Score, Reflects Glioma Cell Infiltration
- Quantification of Cerebral Blood Flow and Oxygen Metabolism with 3-Dimensional PET and 15O: Validation by Comparison with 2-Dimensional PET
- Evaluation of Image Registration in PET/CT of the Liver and Recommendations for Optimized Imaging
- Positron Emission Tomography As an Imaging Biomarker