


Abstract
Genetic or environmental influences on cerebral glucose metabolism are unknown. We attempted to reveal these influences in elderly twins by means of 18F-FDG PET. Methods: 18F-FDG uptake was studied in 40 monozygotic and 18 dizygotic volunteer twin pairs aged 30 y or over. We also created 18 control pairs by pairing age- and sex-matched genetically unrelated subjects from dizygotic and monozygotic pairs. SUV images of the brain were reconstructed and analyzed by voxel-based statistical analysis with automated region-of-interest setting. The 18F-FDG uptake in each cerebral lobe was semiquantified by taking a ratio of SUVmean in each region of interest to whole-brain SUVaverage. We calculated an intraclass correlation coefficient of SUV ratio in each region of interest for monozygotic and dizygotic pairs. By comparing differences in coefficients between monozygotic and dizygotic pairs, genetic and environmental contributions were estimated. Results: The intraclass correlation coefficient in monozygotic pairs was significantly higher than that in dizygotic pairs in the parietal lobes bilaterally (P < 0.001) and in the left temporal lobe (P < 0.05) but was not significantly different in other lobes. Conclusion: The present study indicated that in the right and left parietal lobes and left temporal lobe, cerebral glucose metabolism is influenced more by genetics than by environment, whereas in other brain regions the influence of environment is dominant.
Glucose and oxygen are essential fuels for metabolism of glucose in the brain. Functional activation of neurons is normally associated with increases in local cerebral glucose utilization and blood flow (1). PET using the glucose analog radiopharmaceutical 18F-FDG is applied to evaluate regional cerebral glucose metabolism. In healthy subjects, the cerebral metabolic rate of glucose shows interindividual variability regionally and globally (2). Age-related changes during development and aging and sex differences in brain glucose metabolism have been reported (3–7). The resting-state metabolic network has been examined in healthy volunteers (8–10). However, factors influencing variations in cerebral metabolism itself have not been precisely investigated yet. The patterns of glucose metabolism in the brain appear to be influenced by various factors, including genetic and environmental factors. However, the magnitude and proportion of these influences remain unknown.
The twin method has been used to estimate the extent of genetic and environmental influence on associations among multiple observed variables (11). Although the twin method has been used mainly in the field of behavioral genetics, it is also applicable to nonbehavioral traits. Twins are classified into two major groups: monozygotic and dizygotic. The twin method is based on the assumption that monozygotic twins share all their genes whereas dizygotic twins share, on average, only half their genes. Any observed differences in the phenotype of interest between a pair of monozygotic twins would be expected to be due to environmental factors. Inclusion of dizygotic twins allows genetic factors to be separated from environmental factors. By comparing similarities between monozygotic and dizygotic twins, the extent of genetic and environmental influence on a particular trait can be estimated. When a genetic influence is dominant, monozygotic twins would be more similar than dizygotic twins regarding that trait. When an environmental influence is dominant, the similarity between monozygotic twins regarding the trait would tend to be the same as that between dizygotic twins.
Several twin studies using brain 18F-FDG PET have found a genetic contribution to regional brain glucose metabolism in such conditions as Alzheimer disease (12), posttraumatic stress disorder (13), and familial frontotemporal dementia (14). However, the degree of genetic and environmental influence on cerebral glucose metabolism in the resting state in healthy humans has remained unknown. The present study used 18F-FDG PET to estimate this influence.
MATERIALS AND METHODS
Participants
This study was conducted between January 2011 and December 2014 as a part of the twin research of Osaka University based on the Osaka University Aged Twin Registry. Subject pairs were recruited using several methods such as newspaper advertisements and posters in hospitals. All subjects volunteered to participate in this research, which was conducted with the approval of the Osaka University Ethics Committee. Written informed consent was obtained from each participant before the study.
Among the subjects undergoing 18F-FDG PET, we targeted asymptomatic, right-handed twin pairs aged 30 y or over. Twin pairs were excluded if one or both twins were left- or mixed-handed or if the handedness of a twin was unknown. Twin pairs who were not raised together were also excluded. The zygosity of the twins was confirmed by genotyping for multiple genetic markers: analysis of 15 short tandem repeat loci. Twins were determined to be monozygotic when all short tandem repeat loci were identical. Otherwise, the twins were determined to be dizygotic. The final cohort included 58 twin pairs, 40 of whom were monozygotic (12 male and 28 female pairs; mean age, 60.3 ± 12.1 y; range, 35–88 y) and 18 dizygotic (9 male and 9 female pairs, all of the same sex; mean age, 64.9 ± 15.4 y; range, 32–85 y). F and t testing showed no significant differences in age variance or mean between monozygotic and dizygotic pairs (P > 0.05). The demographic characteristics of the subjects are shown in Table 1.
Demographic Characteristics of Subject Pairs
To compare similarities in brain 18F-FDG distribution between the brains of twin pairs and the brains of genetically unrelated pairs, we created 18 control pairs by pairing one member of each twin pair with a genetically unrelated individual who was of the same sex and not more than 1 y older or younger than the twin (5 male and 13 female pairs; mean age, 61.7 ± 10.9 y; range, 40–84 y). There was no significant difference in age variance or mean between the control pairs and the dizygotic and monozygotic pairs.
18F-FDG PET
The participants were told to fast for at least 4 h before undergoing PET. Blood glucose levels were checked immediately before intravenous administration of 18F-FDG (∼3.7 MBq/kg of body weight). Afterward, those participants who had been enrolled between January 2011 and March 2011 (5 monozygotic and 3 dizygotic pairs) sat quietly in a dedicated waiting room with their eyes closed for 60 min, and those enrolled between October 2011 and December 2014 (35 monozygotic and 15 dizygotic pairs) sat for 45 min. 18F-FDG PET was performed with an Eminence Sophia (SET 3000GCT/X) PET scanner (Shimadzu). The images were obtained using a 3-dimensional acquisition with an axial field of view of 50 cm in a 128 × 128 matrix (4 × 4 mm for each pixel) for 8 pairs or a 256 × 256 matrix (1 × 1 mm for each pixel) for 50 pairs. Iterative image reconstruction was performed using a dynamic row-action maximization-likelihood algorithm (15). Attenuation was corrected using a 137Cs external transmission source. The extent of regional 18F-FDG uptake was expressed as SUV:
Image Analysis
We performed 3-dimensional stereotactic surface projection analysis as developed by Minoshima et al. (2,16), using the interface software iSSP (version 5; Nihon MediPhysics Corp.). Each image set was realigned to the bicommissure stereotactic coordinate system (17). Differences in individual brain sizes were eliminated by linear scaling, and regional anatomic differences were minimized by a nonlinear warping technique (18). Each brain was therefore standardized anatomically to match an atlas brain while preserving the regional 18F-FDG activity. Subsequently, the maximum cortical activity was extracted to adjacent predefined surface pixels on a pixel-by-pixel basis using 3-dimensional stereotactic surface projection.
Using the analysis software Stereotactic Extraction Estimation (version 2.1; Nihon MediPhysics Corp.) developed by Mizumura et al. (19), we divided cortical activity into 5 cerebral lobes (frontal, parietal, occipital, temporal, and limbic, with limbic defined as the cingulate gyrus and the internal temporal cortex), calculated SUVmean for each of these regions, and performed region-of-interest analysis.
We then normalized the datasets to the whole-brain SUVaverage of each subject on the hypothesis that most of the brain was unaffected by disease. We adjusted the global individual variability of 18F-FDG accumulation by replacing regional SUVmean by a ratio of regional SUVmean to whole-brain SUVaverage. The ratio images were used to create pixelwise similarity images and to analyze the intraclass correlation coefficients (ICCs) of SUV ratio in each region of interest for the monozygotic and dizygotic pairs and the control pairs.
Similarity Image
According to a previous twin study on brain structure by Thompson et al. (20), we created pixelwise similarity images of brain 18F-FDG uptake. The difference in SUV ratio in each monozygotic and dizygotic pair was averaged for each pixel and compared pixel by pixel with the control pairs. The relative average difference in SUV ratio (monozygotic/control and dizygotic/control) was displayed on the standard MR brain atlas.
Statistical Analysis
In the SUV ratio images, ICC rI was calculated as follows: where (xi,1,xi,2) denotes the value of twin members and
  denotes the mean of
  (grand mean) (21). The ICC ranged from 1.0 to −1.0, being large and positive when variance was small within pairs but large between pairs. By comparing the difference in ICCs between monozygotic and dizygotic twins, it is possible to estimate genetic and environmental contributions to regional 18F-FDG uptake. If the ICC of monozygotic twins is significantly higher than that of dizygotic twins, a genetic influence is suggested. The significance of differences between the ICCs of monozygotic and dizygotic twins was evaluated by z testing. A P value of less than 0.05 was considered statistically significant. These analyses were performed using Excel 2010 (Microsoft).
RESULTS
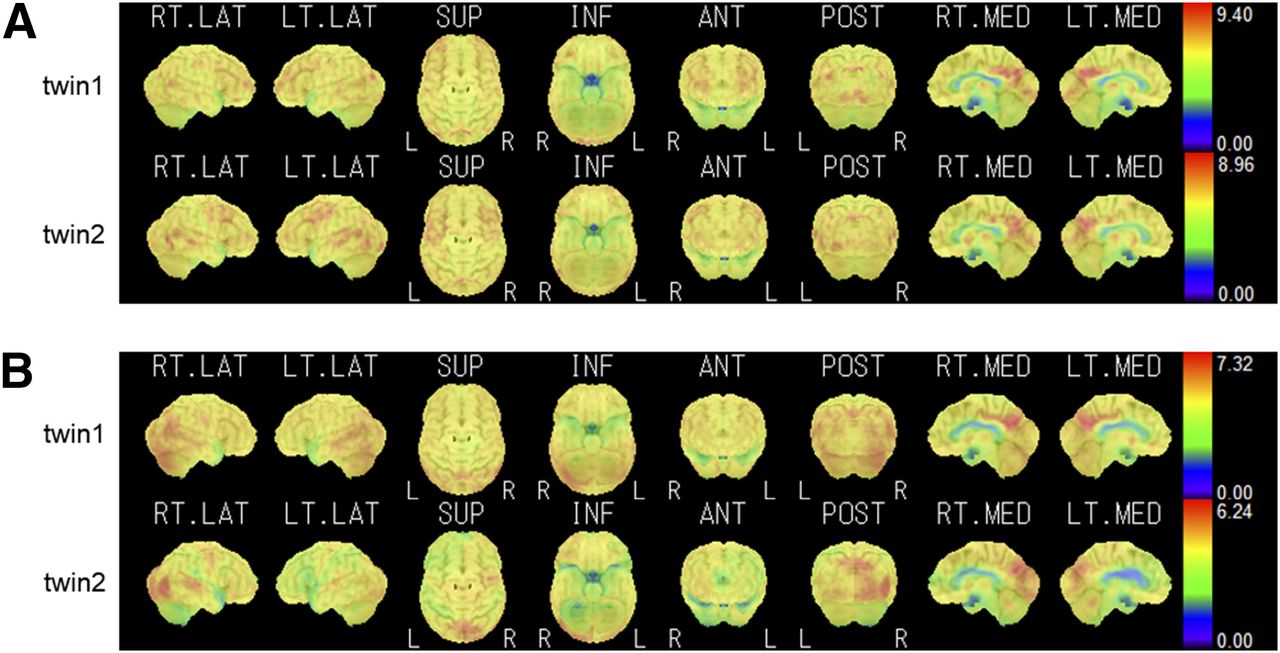
Figure 1 shows the SUV images of two pairs of representative monozygotic twins, as analyzed by the iSSP software. Maximum cortical activity is projected on the brain surface and visualized from various directions. The metabolic distribution is different between pairs but similar within pairs. Figure 2 shows two pairs of representative dizygotic twins. Compared with metabolic distribution in the representative monozygotic twins, that in these dizygotic twins differed both between and within pairs.

Representative SUV images of 2 monozygotic pairs, pair of 67-y-old female twins (A) and pair of 74-y-old male twins (B). Distribution of high-metabolic-activity regions and low-metabolic-activity regions is displayed on color scale. Right lateral (RT. LAT), left lateral (LT. LAT), superior (SUP), inferior (INF), anterior (ANT), posterior (POST), right medial (RT. MED), and left medial (LT. MED) projections are shown from left to right. In each panel, top row shows images of one twin and bottom row shows images of the other.

Representative SUV images of 2 dizygotic pairs, pair of 65-y-old female twins (A) and pair of 84-y-old male twins (B). Distribution of high-metabolic-activity regions and low-metabolic-activity regions is displayed on color scale. Right lateral (RT. LAT), left lateral (LT. LAT), superior (SUP), inferior (INF), anterior (ANT), posterior (POST), right medial (RT. MED), and left medial (LT. MED) projections are shown from left to right. In each panel, top row shows images of one twin and bottom row shows images of the other.
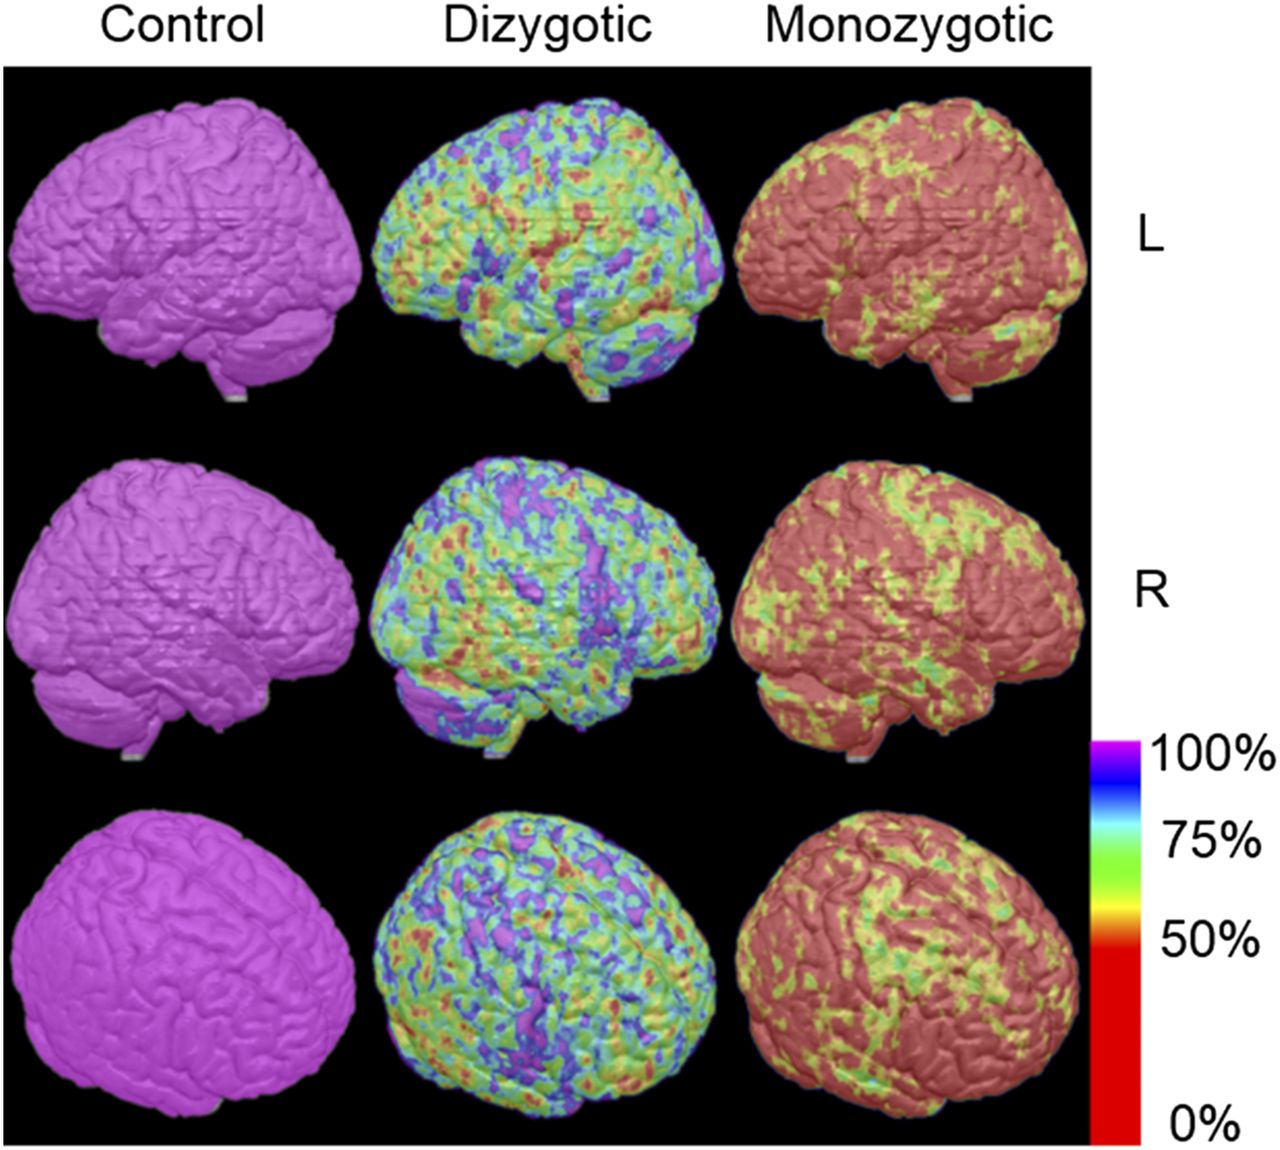
Figure 3 shows similarity images for the dizygotic and monozygotic pairs. A less than 50% average difference in SUV ratio (as percentage of control pair) was seen in most of the brain in monozygotic pairs but in only limited areas of the brain in dizygotic pairs.

Similarity images of dizygotic and monozygotic pairs compared by control pairs. Average difference in SUV ratio (as percentage difference in control pairs) between members of dizygotic twins and monozygotic twins is displayed pixel by pixel on standard MR brain atlas in color scale. Average difference in SUV ratio between members of control pairs was set to be 100%.
Table 2 shows the ICCs for each lobarwise region of interest. In the control pairs, there was no significant correlation in SUV ratio in any lobe but the right temporal and right limbic. SUV ratio correlated significantly in the left and right frontal lobes, right temporal lobe, and right and left limbic lobes in both monozygotic and dizygotic pairs but not between monozygotic and dizygotic pairs, indicating a predominantly environmental influence. The ICCs of monozygotic twins were significantly higher than those of dizygotic twins in the left and right parietal lobes (P < 0.001) and left temporal lobe (P < 0.05), indicating a predominantly genetic influence. In the other lobes, ICCs were significant in monozygotic pairs but did not significantly differ between monozygotic and dizygotic pairs.
ICCs for Each Lobarwise Region of Interest
DISCUSSION
To our knowledge, this is the first reported PET study of genetic and environmental influence on regional brain 18F-FDG uptake in cognitively normal elderly monozygotic and dizygotic twins and genetically independent control pairs.
It was noteworthy that the ICCs of the right temporal and right limbic lobes were large (≥0.53) in control, dizygotic, and monozygotic pairs but were not significantly different among the groups of genetically independent, dizygotic, and monozygotic pairs. The similarity among groups in this case would be caused predominantly by shared environmental factors such as cultural background, language, the PET study conditions (visual or auditory stimuli), and the psychologic stress of undergoing a PET examination.
Chugani and Phelps studied maturational changes in brain glucose metabolism using PET in neurodevelopmentally normal infants (3). In their study, the sensorimotor cortex (precentral and postcentral gyri) was the part of the cerebral cortex showing the highest 18F-FDG accumulation at birth. In contrast, the frontal and association cortices did not show an increase in glucose metabolism until 8–9 mo. Brain regions that develop later after birth may have a higher probability of being influenced by the environment. Chugani et al., in performing a further study on a larger population of children, found a decline in cerebral glucose metabolism to the adult level during the second decade of life (22). They speculated that maturational changes in brain glucose metabolism match the initial overproduction and subsequent elimination of excessive neurons, synapses, and dendritic spines. The decline process is likely to be influenced more by environmental factors than by genetic factors.
In the developing murine brain, 2-deoxy-3H-glucose uptake has been shown to be paralleled by an increase in glucose transporter 1 and 3 messenger RNA and by protein and hexokinase activity (23). Proteins such as hypoxia-inducible factor 1α also affect glucose metabolism by increasing expression of glycolytic enzymes and glucose transporters (24). In patients with glucose transporter 1 deficiency syndrome due to mutation of the SLC2A1 gene, brain glucose hypometabolism has been documented (25). These observations suggest that deoxyglucose uptake is related to expression of genes encoding glucose transporter and glycolytic enzymes.
Morphologic studies have reported that brain structure is highly heritable. Individual studies and metaanalyzed studies have found high heritability in intracranial volume, total brain volume, total cerebral volume, hemispheric volumes, cerebral lobe volume, and total and regional gray matter and white matter volumes, although estimates were highly variable across the studies (26–28).
Thompson et al. studied the influence of genetics on regional gray matter distribution by means of MRI in 10 dizygotic and 10 monozygotic pairs (20) and found that genetic factors influenced cortical structure in the Broca and Wernicke language-processing areas of the brain. Our finding that the predominant genetic influence on 18F-FDG uptake is in the left parietal and temporal lobes in all right-handed subjects was consistent with observations on the morphologic heritability of cortical gray matter in these areas. A genetic influence in the left and right frontal lobes was found in the study of Thompson et al. but not in the present study. The 18F-FDG result might not be accounted for solely by anatomic similarity and partial-volume effect. The metabolic pattern might be influenced more by environmental factors in the frontal lobes than in the parietal lobes and left temporal lobe.
Studies using resting-state functional MRI have also revealed a genetic influence on functional connectivity in the default-mode brain network. Glahn et al. demonstrated that up to 40% of variance in the default-mode brain network is under genetic control (29). Korgaonkar et al., by extracting resting-state activity from task-based functional MR images, demonstrated that about 9%–41% of the variance in functional connectivity is attributable to a genetic contribution (30). These functional MRI studies indicate a genetic contribution to resting-state brain function, as is consistent with the present study.
In rodents, genetic influences on memory function and behavior have long been studied. Silva et al. first demonstrated that a single genetic change in α-calcium/calmodulin–dependent kinase II mutant mice induced impairment of spatial learning (31). Recently, it was also demonstrated that expression of the vesicular glutamate transporter gene in mice is related to behavioral flexibility by modulating glutamatergic signaling in synapses (32). These rodent studies indicated that gene expression to synthesize specific enzymes critically influences brain function and behavior. In humans, a genetic influence on word recognition (33) and reading was reported by means of the twin method (34). The relationship among genetic influence, cerebral glucose metabolism, and higher cortical function can be analyzed in the present twin-pair population in the future.
Our study had 4 limitations, with the first being the relatively small sample size, particularly the number of dizygotic twins. It was difficult to recruit a large number of elderly twin subjects in Japan, and there are fewer dizygotic than monozygotic twin births in Japan (1:2 in the birth years of the participants) (35,36). This disproportionality and small sample size might have led to a larger measurement error. In addition, we could not estimate the relative influence in men and women separately because our sample size was not sufficiently large.
Second, the PET scan starting time and axial field of view before March 2011 were different from those after October 2011. At the beginning, we collected only whole-body images. After we had found a metabolic similarity in the brain between monozygotic twin pairs, we added a dedicated brain scan (starting 45 min after injection) before the whole-body scan (starting 60 min after injection). Regional 18F-FDG uptake differed slightly depending on the starting time of the scan (37,38). Pixel size differed between whole-body scanning and dedicated brain scanning. Although both starting time and pixel size were the same in intrasubject pairs, the difference in pixel size could have influenced the results.
Third, we normalized global individual variation by taking the ratio of SUVmean to whole-brain SUVaverage. As reference regions, the thalamus and pons are too small to produce reliable values because of the partial-volume effect and measurement error. Normalization using the cerebellar mean, as is done most often in blood flow studies, is not necessarily suitable either, because the cerebrum is not always parallel or relevant to the cerebellum in relation to glucose metabolism (39,40). There is no consensus on the best region for brain-PET normalization, as stated in an autumn 2008 newsletter of the Society of Nuclear Medicine and Molecular Imaging (41).
Fourth, there may be acquired epigenetic changes due to DNA methylation, histone modification, and noncoding RNA-associated gene silencing (42). Such changes may occur in one twin. Regional metabolic changes due to epigenetic changes were included in the environmental effects in the present study.
CONCLUSION
Despite the limitations of this study, we found that genetic and environmental factors influence metabolism of glucose in the human brain as represented by 18F-FDG uptake in the resting state. The magnitude of these influences differs among brain regions. A genetic influence was most dominant in the left and right parietal lobes and the left temporal lobe.
DISCLOSURE
The costs of publication of this article were defrayed in part by the payment of page charges. Therefore, and solely to indicate this fact, this article is hereby marked “advertisement” in accordance with 18 USC section 1734. This study was supported by KAKENHI grants-in-aid S 24229008 and C 26462204 for scientific research. This work was also supported in part by the Osaka Medical Research Foundation for Intractable Disease. However, the funders had no role in study design, data collection, or analysis. No other potential conflict of interest relevant to this article was reported.
Acknowledgments
We received useful advice from the Osaka Twin Research Group: Yasufumi Kaneda, Kazuo Hayakawa, Yoshinori Iwatani, Shiro Yorifuji, Mikio Watanabe, Chika Honda, and Kayoko Omura, Center for Twin Research, Osaka University Graduate School of Medicine.
Footnotes
↵* Contributed equally to this work.
Published online Nov. 19, 2015.
- © 2016 by the Society of Nuclear Medicine and Molecular Imaging, Inc.
REFERENCES
- Received for publication July 19, 2015.
- Accepted for publication October 27, 2015.


Jump to section
Related Articles
Cited By...
- No citing articles found.